×
模态框(Modal)标题
在这里添加一些文本
Close
Close
Submit
Cancel
Confirm
×
模态框(Modal)标题
×
Journal
Article
Figure
Search
EN
中文
Home
About Journal
About Journal
Indexed in
Awards
Editorial Board
Guide for Authors
Browse
Current Issue
Online First
Archive
Highlights
Topic
Archive by Subject
Most Viewed
Most Download
Most Cited
E-mail Alert
RSS
Subscribe
Publication Ethics
Contact us
EN
中文
Figure/Table detail
Spatiotemporal patterns and driving mechanisms of intra-city human mobility under extreme weather:A case study of Shanghai during Typhoon Bebinca
ZHANG Yan, LU Yuwen, ZHAI Guofang
PROGRESS IN GEOGRAPHY
, 2026, 45(
4
): 882-896. DOI:
10.18306/dlkxjz.2026.04.015
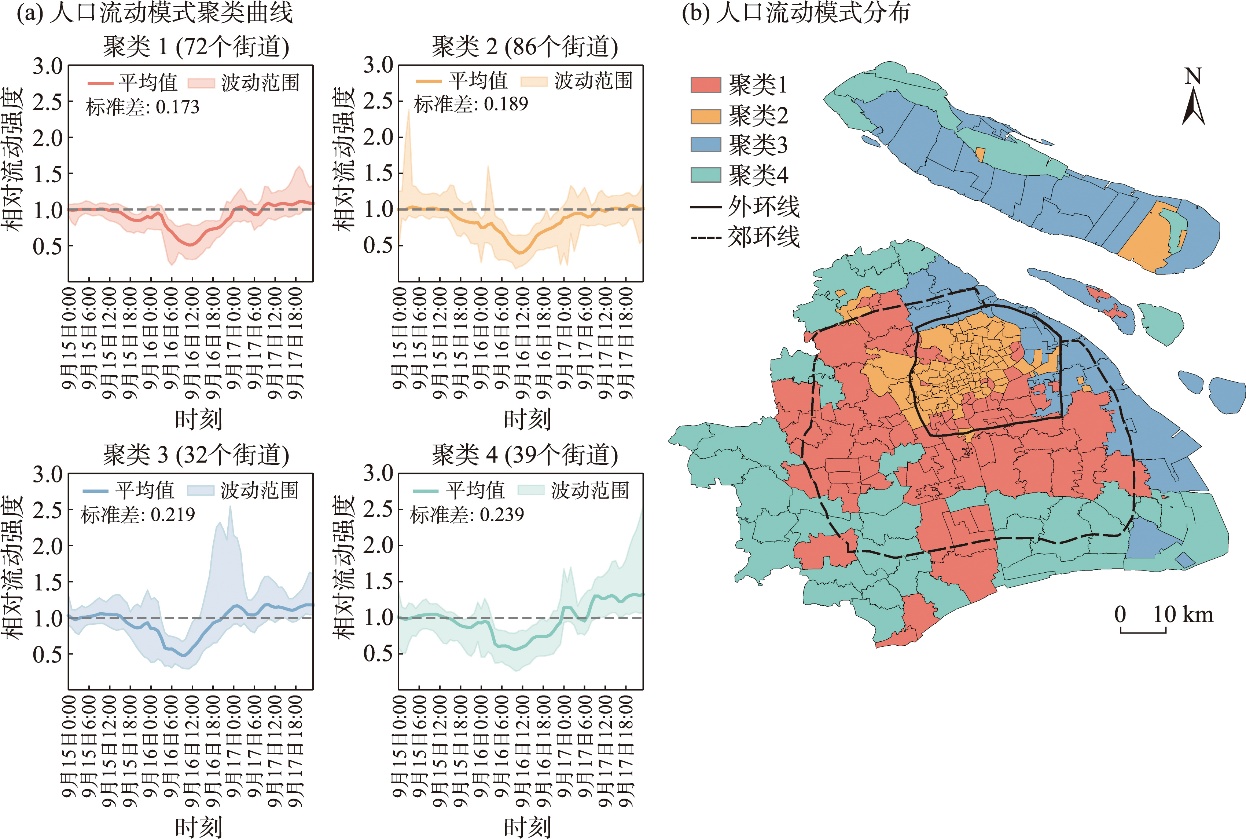
Fig.5
Clustering and distribution of human mobility modes
Other figure/table from this article
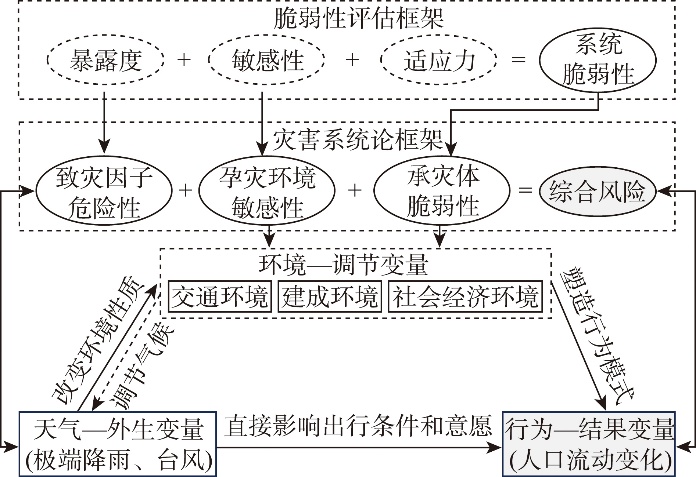
Fig.1
The "weather-environment-behavior" analytical framework
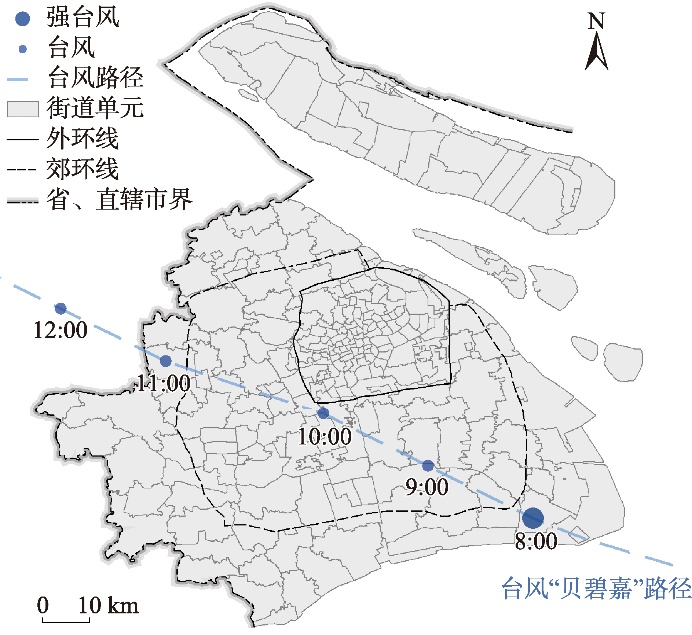
Fig.2
The study area
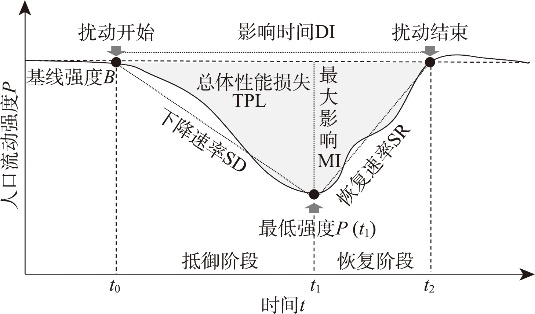
Fig.3
The resilience curve of human mobility
Tab.1
Definition and formula of resilience indicators
Tab.2
Definition of variables and descriptive statistics
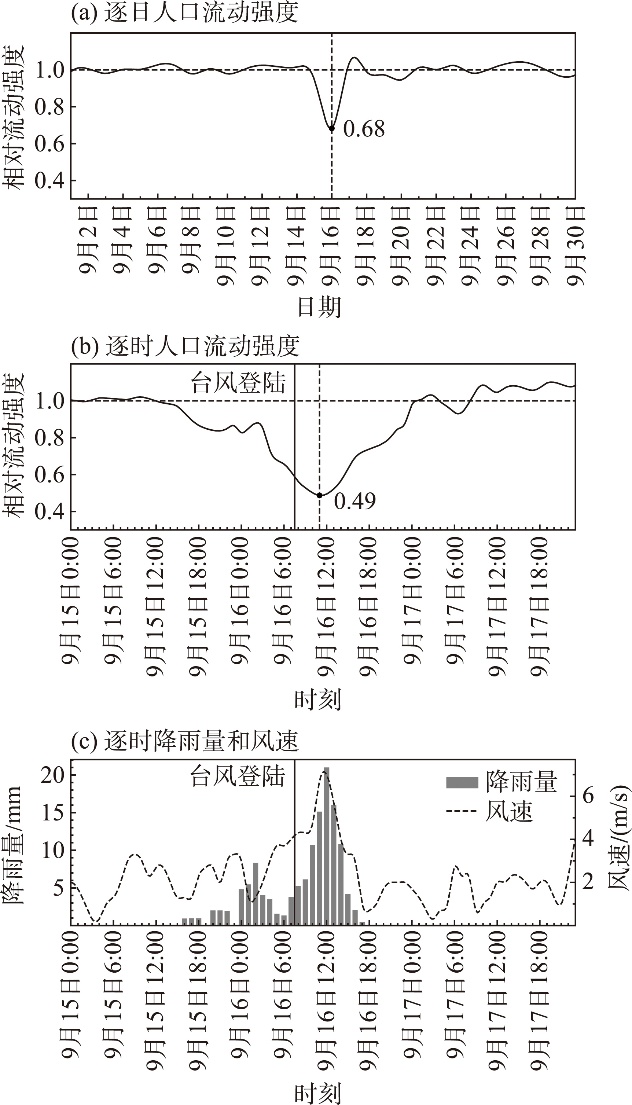
Fig.4
Time-series variation of mobility intensity and weather conditions
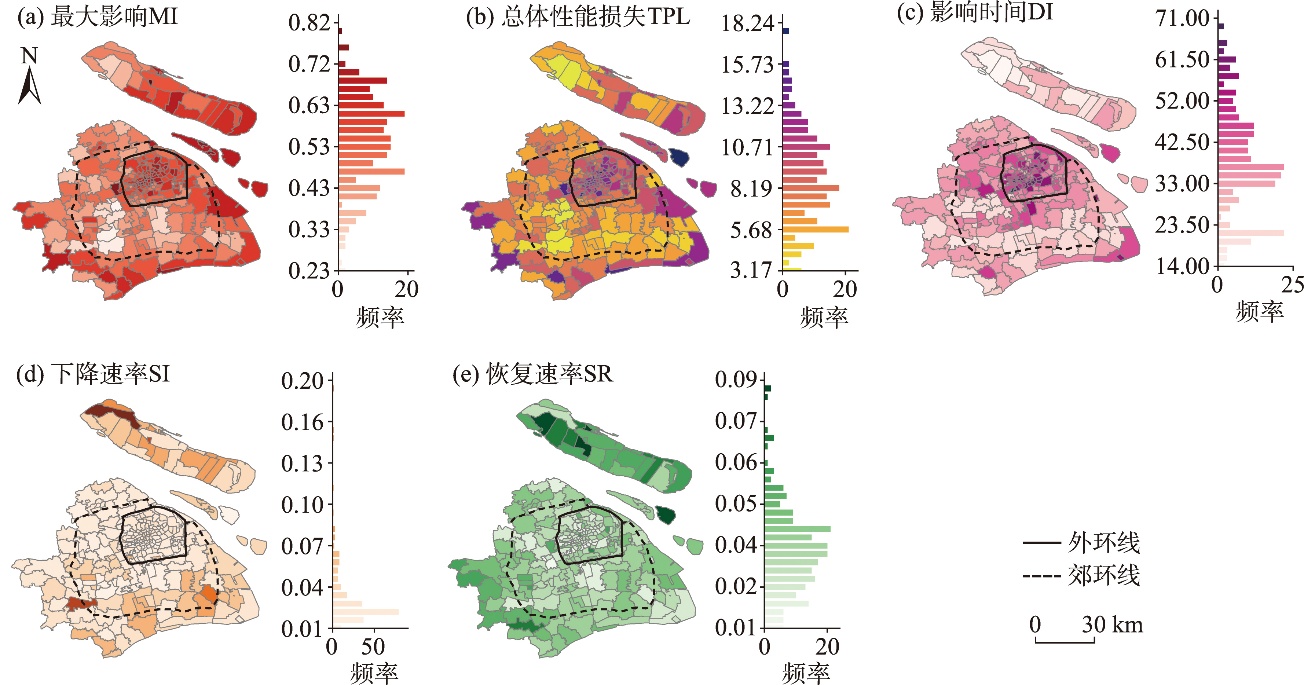
Fig.6
Spatial and frequency distribution of human mobility resilience indicator values
Tab.3
Results of global regression by the ordinary least squares (OLS) model
Tab.4
Results of partial regression by the geographically weighted regression (GWR) model
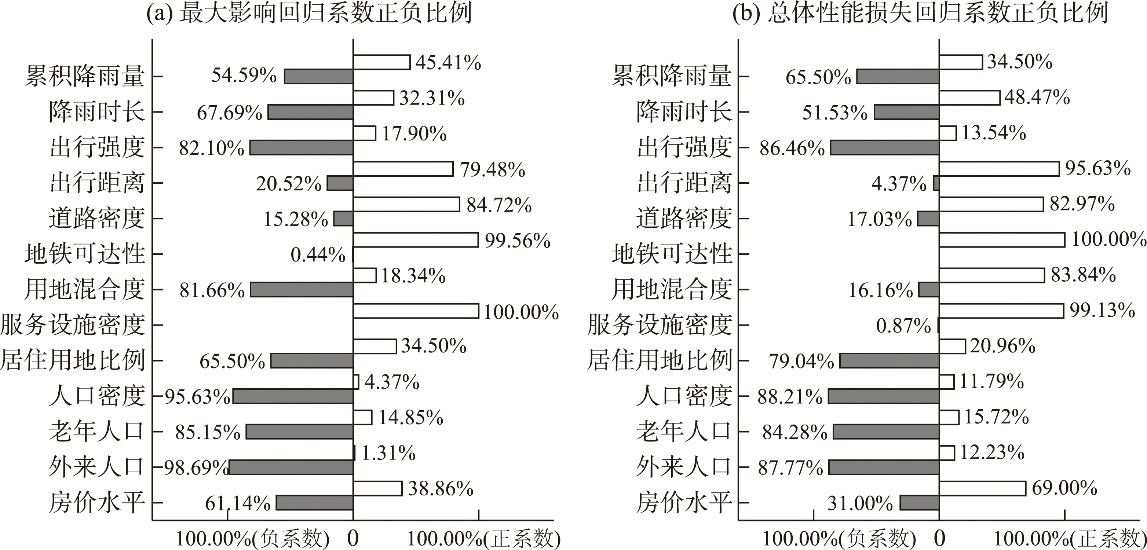
Fig.7
Positive and negative proportion of regression weights for different variables
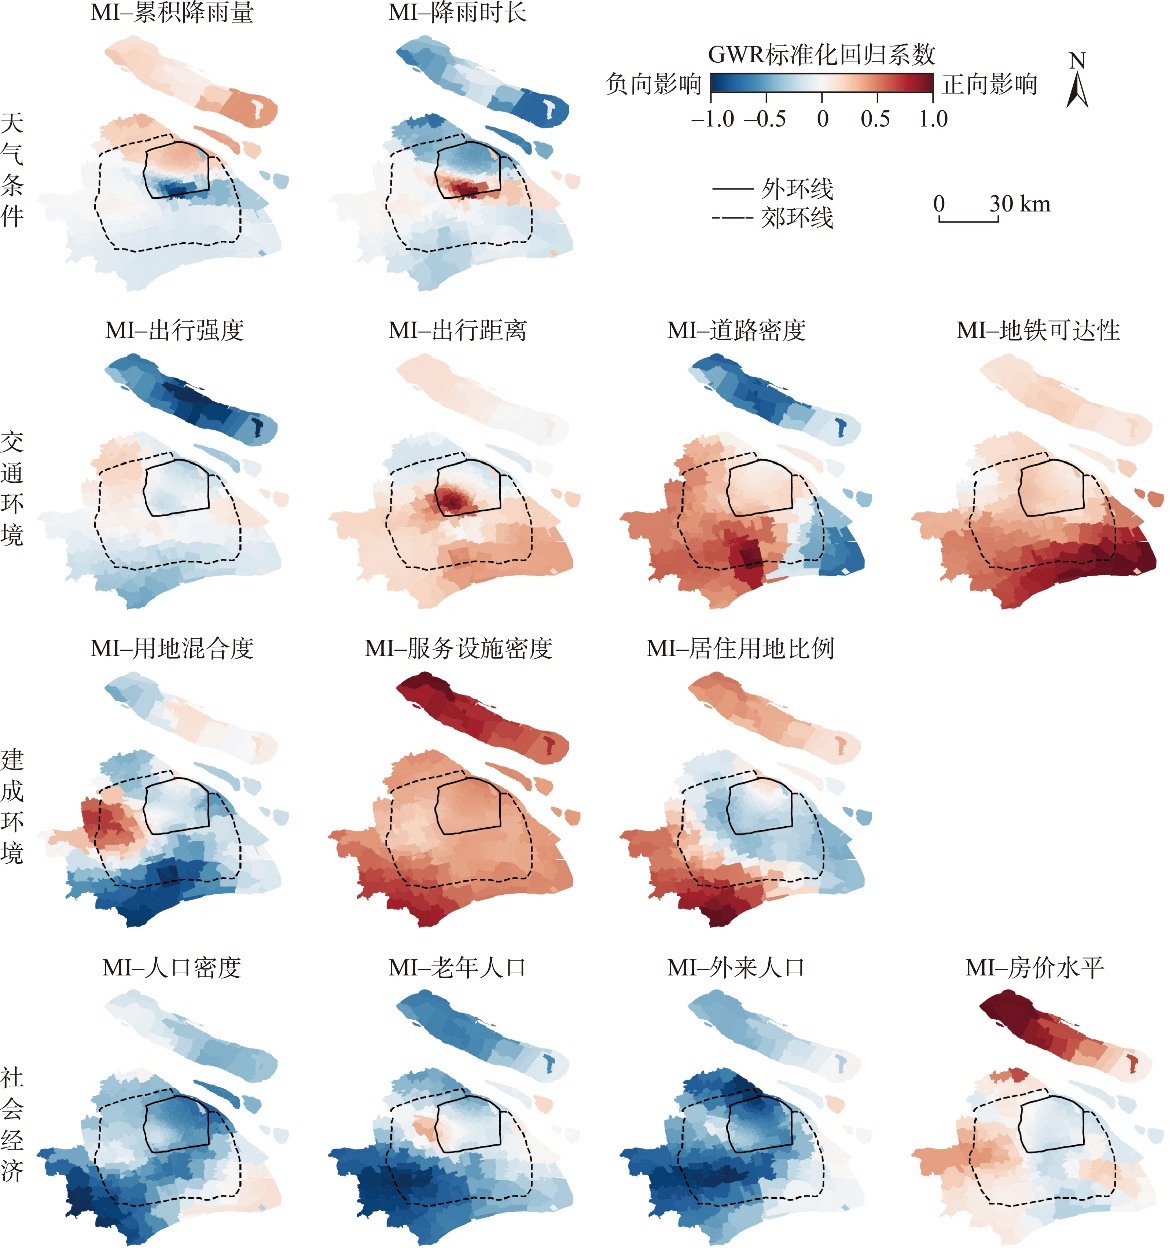
Fig.8
Distribution of GWR coefficients for factors driving MI
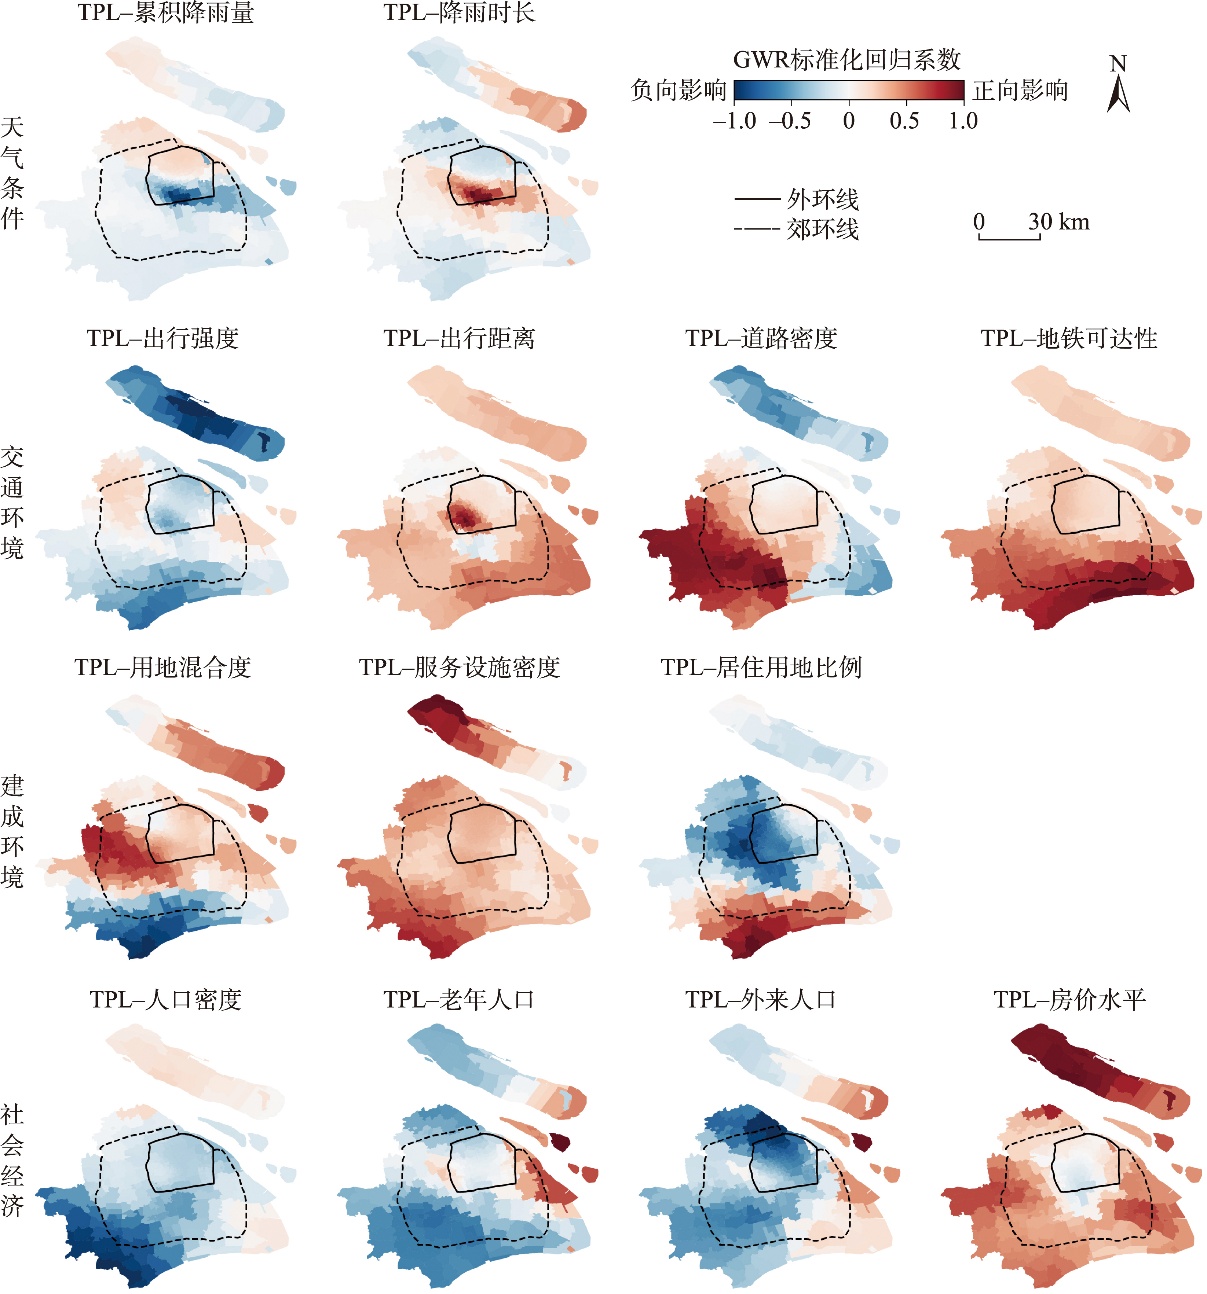
Fig.9
Distribution of GWR coefficients for factors driving TPL