

教育公平是实现社会公平的内在需求和基本保障[1-2],也是满足人民日益增长的美好生活的需要。党的二十大报告提出“促进教育公平,加快义务教育优质均衡发展”;《中华人民共和国国民经济和社会发展第十四个五年规划和2035年远景目标纲要》提出,“要巩固义务教育基本均衡成果,推动义务教育优质均衡发展和城乡一体化”。基本公共教育资源的空间布局直接关系到公共教育服务的均等化,教育优质均衡发展对实现高质量发展和社会公平正义具有重要的意义。尽管已有研究运用两步移动搜索法技术,开展中国大城市教育资源的可达性分析,但前人大多在行政村、社区、镇街等地理尺度上开展分析,采用单一指标(如学位数)评价教育资源的服务供给水平,且只考虑某种出行方式(如步行)的情景,分析结果与现实存在着较大的偏差。因此,有必要对已有的两步移动搜索法进行改进,更准确地评价城市教育资源的可达性水平,为实现教育资源的空间优化配置和构建更公平的教育发展新格局提供决策参考。
随着教育地理学的兴起,越来越多学者运用地理学的理论与方法开展教育公平性和教育资源优化配置的研究。国内外地理学者大多关注教育资源的空间分布格局及其影响机制[3-4]、教育设施的空间规划选址[5-6]、教育资源可达性评价[7]、学区划分[8]等话题。其中,空间可达性评价方法是衡量教育空间公平性的常用手段[9-10]。可达性最早由Hansen[11]提出,主要用于衡量从需求点到目标点的相对便捷程度,关注供给和需求的空间分布及空间匹配程度[12]。教育资源空间可达性的研究方法主要有比例模型[13]、最短距离法[14]、等值线法[15]、网络分析法[16]、引力模型[17]、两步移动搜索法及其各种改进模型[18]等等。其中,引力模型和两步移动搜索法可以综合考虑供给和需求双方条件、空间阻抗、交通模式等因素,能较客观地进行可达性评估,是目前公共服务设施可达性分析最为成熟的2种方法[19]。引力模型又称潜能模型或重力模型,该模型以区域中的所有供给点与需求点相互产生的势能总和来反映点与点间的可达性水平。有学者在引力模型的基础上,评估中小学的可达性水平[17,20]。
与引力模型相比,两步移动搜索法(two-step floating catchment area model, 2SFCA)用供需比的形式直观表现出获得服务的机会累计值来衡量其可达性,可以更好地识别出可达性低值区,可实现性强,对现实的模拟更具参考价值[21-22]。为使研究结果更符合实际,许多学者在传统两步移动搜索法的基础上进行改进[9],通过引入距离衰减函数、调整搜索半径、引入竞争因素和考虑多出行模式等措施提升可达性的评估水平[23-24]。21世纪以来,国内外不少学者将改进后的两步移动搜索法引入教育资源的空间可达性研究,评价某区域范围内居民获得教育资源的便捷程度,研究不断深入,但仍存在一定局限性。首先,对教育需求人口的统计空间尺度的确定,多数学者使用行政村、街区、大尺度格网的人口数据[18,25-26],尺度较大,少数学者以居住小区、建筑物等相对精细的空间尺度统计需求人口[27⇓-29],但不同小区和建筑物存在形态不规则与尺度差异,且人口数据获取繁琐、精准度有限。也有学者利用学籍信息获取学生居住精准空间位置,但仍以行政村作为结果统计基本单元,可达性评估不够精细[30]。其次,对教育资源服务能力的评估,多数学者采用学位数、专任教师数等单一指标评价教育资源的服务能力[26⇓-28,30],但学校的服务能力是多种指标和因素综合作用的结果,不同等级服务能力影响可达性的客观评价。部分学者引入多指标评估学校的服务能力,但指标数量较少,且没有结合当地居民的需求与偏好对各项指标进行赋权,从而难以准确地评价学校的实际综合服务能力[18,23]。再者,现有研究多以单一出行方式或固定的搜索距离研究教育资源可达性[27-28],忽视了出行方式选择的多样性,以及由不同出行方式产生的服务范围的灵活性。实际上,学生出行行为是家庭多成员多因素综合考虑下的决策,不同群体对通学出行方式的选择存在差异[23],且对不同出行方式的时间长度接受不同,从而影响学校的空间服务范围以及对可达性的评估结果。
为弥补上述研究不足,本文选取东莞市为研究案例地,以200 m×200 m的细粒度格网为分析单元,构建考虑小学综合服务能力和多出行模式情景的两步移动搜索法模型,结合东莞市的实有人口数据、人口普查数据、学校服务能力数据和学生出行调查数据,测度东莞市小学空间可达性状况并揭示其空间分异格局。本文试图回答以下问题:东莞市小学可达性水平存在何种空间差异特征,东莞市及其下辖各镇街小学的分布公平性水平如何,影响东莞市小学空间可达性的因素有哪些?
1 研究区域、数据与方法
1.1 研究区域
东莞市位于广州与深圳之间,综合经济实力位居国内百强城市前列,是新一线城市。1988年东莞市升格为地级市,下辖中心城区4个街道、28个镇以及松山湖高新区,成为中国仅有的4座不设区县的城市之一。2017年市委、市政府为促进区域间要素资源的自由流动和优化配置,推动统筹区域联动协调发展,将全市划分为6大片区,分别是城区片区、松山湖片区、滨海片区、水乡新城片区、东部产业园片区、东南临深片区①(① 城区片区包括南城、莞城、东城、万江4个街道和高埗镇、石碣镇;滨海片区包括长安镇、虎门镇、沙田镇和厚街镇;松山湖片区包括松山湖高新区(东莞生态产业园区)、茶山镇、寮步镇、大朗镇、大岭山镇、石龙镇、石排镇;水乡新城片区包括麻涌镇、中堂镇、望牛墩镇、洪梅镇、道滘镇;东部产业园片区包括常平镇、谢岗镇、东坑镇、桥头镇、企石镇、横沥镇、黄江镇;东南临深片区包括塘厦镇、清溪镇、凤岗镇、樟木头镇。)。根据第七次人口普查(简称“七普”)和《东莞市统计年鉴2021》,至2020年末东莞市常住人口为1046万人,常住人口城镇化率达到92.2%。东莞路网整体趋于均衡发展,公路网密度约259.69 km/100 km2,居全省前列,农村路网同样密度较高。2019年全市有486所小学,在校小学生人数84万多人,非本市户籍学生超过80%,保障外来人口随迁子女享有平等教育资源是东莞市义务教育发展的重要任务。2020年东莞市政府通过了《东莞市教育扩容提质千日攻坚行动计划(2020—2022年)》,计划2022年完成义务教育阶段学校建设项目104个,增加学位12.74万个。东莞市教育扩容提质建设攻坚时期,急需对城市现有教育资源布局情况有更科学合理的研究,指导新时期学校的规划布局以及学区的划分。
1.2 数据来源
(1) 人口数据。数据来自东莞市公安局2018年一标三实的实有人口数据和七普数据。七普数据空间粒度粗,只到镇街级别,但学龄人口数量准确度高;一标三实的实有人口记录每个登记人口的经纬度,可以精准定位人口空间位置,粒度细致到格网级别,但学龄人口数量存在偏差。两套人口数据相互校验使人口数据更具时效性、准确性。具体做法是以一标三实的人口数据为基础,计算每个200 m×200 m格网小学学龄人口的占比,将七普数据的小学学龄人口数按比例分配到每个格网,得到七普的小学学龄人口格网数据,最终生成25651个人口数非零的格网作为可达性分析的需求单元。根据已有研究,40 m和50 m、100 m、400 m分别是社区(村)、县区、省域的人口空间数据适宜格网尺度[31⇓-33],其中40~200 m能较准确地揭示研究区局部区域的人口分布差异,是空间关系表达效果较好的格网尺度[31]。为保证格网尺度的精细度,减少数据冗余且提高计算效率,本文使用200 m的格网作为东莞市小学空间可达性的基本分析单元。细粒度格网人口数据有利于减小形状不规则产生的计算误差,尤其对农村地域人口密度相对较低的地方,有利于提高两步移动搜索法空间可达性的计算精度[34]。
(2) 路网数据。数据来自东莞市自然资源局,包括道路类型、级别、长度等数据。结合《城市道路交通规划设计规范(GB 50220—95)》以及东莞市小学上下学时间段实际交通状况,对各级道路不同交通方式的速度进行赋值(表1),利用ArcGIS进行空间分析时,各级道路所有交通方式的速度单位均转化为“m/min”。
表1 各等级道路不同出行方式的通行速度
Tab.1
| 道路类型 | 小汽车/ (km/h) | 公共汽车②/ (km/h) | 骑行/ (m/min) | 步行/ (m/min) |
|---|---|---|---|---|
| 快速路 | 50 | 35 | 300 | 80 |
| 主干路 | 40 | 25 | 300 | 80 |
| 次干路 | 30 | 15 | 300 | 80 |
| 支路 | 20 | 10 | 300 | 80 |
| 其他路 | 10 | 0 | 300 | 80 |
② 公共汽车的平均行车速度往往低于小汽车。根据2020年东莞市政府发布的《东莞市交通发展白皮书》,东莞市高峰期道路公交平均运行速度在25 km/h以上。公交行驶速度设置以白皮书报告的平均速度为基础,根据不同级别道路进行赋值。主干道及以上等级的道路速度设置等于或高于平均速度;次干道、支路受停靠站、高峰时段交通拥堵,以及非机动车、行人的干扰会逐渐增大,道路速度依次降低;支路以下的其他路基本不通公交,速度设为0。
(3) 设施数据。包括小学的位置点空间数据及服务能力数据,小学位置点通过百度地图坐标拾取器爬取各小学的坐标数据,利用ArcGIS 10.2处理成矢量点数据。小学服务能力数据来自东莞市教育局的2018—2019年度的教育统计报表,包括东莞市义务教育阶段学校的学生规模、师资条件和硬件设施等相关基本信息。
(4) 学生通学出行行为与择校行为调查数据。研究团队于2021年12月在东莞市开展有关学龄儿童通学行为及择校因素的问卷调查,问卷内容涵盖小学生上下学的交通方式、出行时间、出行距离、家庭接受的上学极限时长和极限距离以及择校因素等。问卷由所调查学校教师发放给学生家长进行填写,最终回收问卷813份,其中有效问卷755份。
1.3 研究方法
1.3.1 学校综合服务能力
文章利用熵值法确定9大指标的客观权重,再根据问卷调查对择校因素的调查结果运用AHP层次分析法测算3大类别的主观权重,最终确定主客观综合权重测算学校综合服务能力
式中:
式中:
表2 东莞市小学服务能力权重
Tab.2
| 类别 | 变量 | 指标 | 客观权重 | 主观权重 | 综合权重 |
|---|---|---|---|---|---|
| 师资条件 | 专任教师数(人) | 0.0729 | 0.4231 | 0.0873 | |
| 一级以上职称教师数(人) | 0.3038 | 0.4231 | 0.3639 | ||
| 本科及以上学历教师数(人) | 0.0843 | 0.4231 | 0.1009 | ||
| 学校容量 | 用地面积(m2) | 0.0859 | 0.2576 | 0.0627 | |
| 班数(个) | 0.0659 | 0.2576 | 0.0481 | ||
| 在校生数量(人) | 0.0735 | 0.2576 | 0.0536 | ||
| 硬件设施 | 图书数量(册) | 0.0596 | 0.3193 | 0.0538 | |
| 计算机数量(台) | 0.1040 | 0.3193 | 0.0940 | ||
| 校舍面积(m2) | 0.1501 | 0.3193 | 0.1357 |
1.3.2 多出行模式M及时间阈值
问卷调查结果显示,东莞市小学生上学出行方式呈现多样化,主要用步行、骑行、小汽车、公共交通等方式上学,根据不同出行方式将学生分成4个组别的人口。不同出行方式居民愿意付出的极限时间存在差异。根据已有研究,小学生通学理想的出行时间是15 min左右,能够忍受的最大出行时间是30 min,步行与骑行等非机动出行方式受学生与接送者的生理性制约,出行极限时间相对较短[38]。另外,结合《城市公共服务设施规划标准》(GB50442)及学龄儿童通学家庭出行行为调查的统计结果③(③ 搜索半径的最大时间阈值的设置是以研究团队在东莞开展的学龄儿童通学行为调查结果为依据。步行方式有96%的居民接受10~20 min,其中接受15 min的居民达56.7%;骑行方式有81.5%的居民接受5~20 min,其中接受15 min的居民达50.5%;小汽车有86.9%的居民能接受10~30 min,其中接受25 min的居民达45.4%;公共交通有74.5%的居民能接受10~30 min,其中接受25 min的居民达42.9%。),对不同出行方式设置不同的搜索时间阈值(表3)。
表3 东莞市小学生通学4种出行模式的人口比重与搜索半径
Tab.3
| 指标 | 出行模式 | |||
|---|---|---|---|---|
| 步行 | 骑行 | 小汽车 | 公共交通 | |
| 人口比重/% | 24.9 | 25.8 | 38.6 | 10.7 |
| 搜索半径 | 15 | 15 | 25 | 25 |
1.3.3 基于综合服务能力多出行模式的两步移动搜索法
综合服务能力多出行模式两步移动搜索法的计算步骤如下:
第一步,以每所小学为供给点
式中:
根据已有研究,居民在一定范围内对教育服务设施的访问会随距离增加先缓慢下降,随着不断远离起始点,衰减速率会加速变快。高斯函数类似正态分布曲线,能更好地模拟现实中的衰减情况[28]。
第二步,以东莞市任一格网居民点
式中:
1.3.4 基尼指数
式中:GI指地理空间单元(全市、片区或镇街)的小学教育公平性指数,即基尼指数;
1.3.5 空间回归分析
拉格朗日乘数检验、LM-Error和LM-Lag的检验结果均显著,表明所选取的社会经济条件与小学可达性的数据存在较强的空间关系,空间回归模型的结果较普通最小二乘法(OLS)回归模型的结果更优。基于空间滞后模型和空间误差模型检验结果的比较,空间误差模型LogLikelihood(-90585.765)、R2(0.936)均较空间滞后模型的LogLikelihood (-94734.8)、R2(0.901)大,空间误差模型的AIC(181184)、SC(181232)均较空间滞后模型的AIC(189484)、SC(189541)小。相较而言,空间误差模型具有更好的解释作用,拟合效果更好,更适用于本文研究。空间误差模型是考虑周边区域解释变量对研究区域解释变量的影响,模型公式如下:
式中:
本文采用空间误差模型进行分析,将教育可达性作为因变量。模型的自变量选取参考已有公共服务设施和教育资源相关研究的机制分析,义务教育资源空间配置与常住人口、城市经济水平、产业结构、教育投入、道路交通等因素有关[41⇓-43]。结合东莞市以及本文研究的具体情况,从教育需求者、教育投入经济能力等视角出发,选取常住人口、学龄人口、人均GDP、财政支出、教育经费等5个社会经济条件作为自变量④(④ 常住人口和学龄人口数据是由七普获得镇街尺度数据,并以一标三实实有人口的格网尺度数据为基础,将七普数据换算进格网,取得格网尺度的常住人口和学龄人口数据。人均GDP、财政支出、教育经费数据是由《2021东莞市统计年鉴》和东莞市政府官网获得镇街尺度数据,考虑人均GDP镇街内部的均质性,及财政支出与教育经费在镇街内的教育投入强度基本一致,在空间回归分析中这3个数据采用镇街尺度。),探索东莞市小学空间可达性的影响因素。
2 东莞市小学学龄人口和学校的空间分布特征
2.1 学龄人口空间分布特征
统计各格网居民点的小学学龄人口数,以反映东莞市小学教育资源的需求规模。如图1,东莞市小学学龄人口密度分布呈现一主多副的空间格局。密度较高的区域主要集中在中北部地区,以城区片区的东城、莞城、南城、万江4个街道的学龄人口最为集中,形成学龄人口的核心聚集区;滨海片区的长安镇、东南临深片区的凤岗镇、松山湖片区的石龙镇和大朗镇等出现学龄人口次级散点副中心。水乡新城片区的麻涌镇、洪梅镇、望牛墩镇,东南临深片区的银瓶山周边清溪镇、樟木头镇等,以及松山湖片区和滨海片区交界处大岭山四周相邻镇街地区学龄人口相对稀疏。
图1
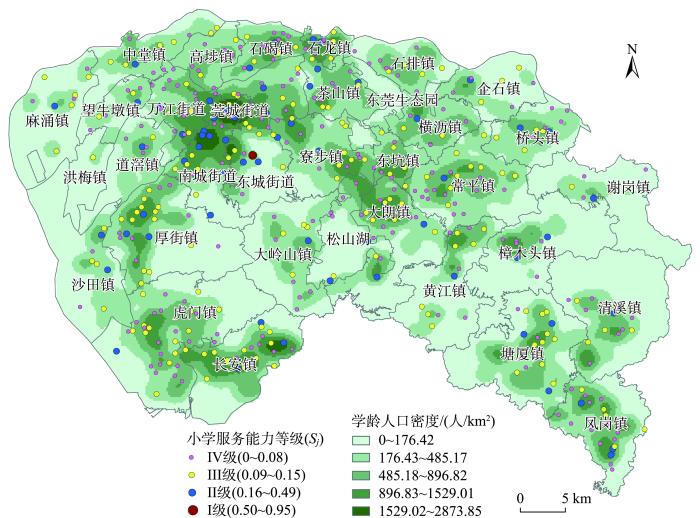
图1
东莞市小学学龄人口密度与学校服务能力的空间差异
注:底图源自东莞市自然资源局提供的第三次全国国土调查的东莞市镇街边界图,底图无修改。下同。
Fig.1
Spatial variation of primary school-aged population density and service capability of primary schools in Dongguan City
总体上,东莞市域学龄人口密度以中心城区为主核心区向外呈距离衰减,镇域学龄人口密度较低,但在各镇中心多出现学龄人口集聚点。人口稀疏区域多为水域、山地等地形复杂的地区。
2.2 小学服务能力结构特征
基于小学服务能力因子
3 东莞市小学空间可达性与公平性分析
3.1 小学空间可达性水平的空间差异
计算东莞市全域范围内的小学可达性得分,利用自然断点法将各格网可达性得分划分为5个等级(图2),并计算各镇街小学空间可达性的均值、标准差和极值(图3)。东莞市小学空间可达性水平整体上呈现西高东低,且可达性由高值区由向四周随距离衰减。可达性最高(1.10~1.71)和较高(0.82~1.09)的区域居民格网数量少,仅占总数的8.72%,主要集中在城区片区4个街道和滨海片区的虎门镇、厚街镇,呈S形带状分布。其中,可达性得分最高的格网位于虎门镇(1.7098),均值最大的镇街是莞城街道(0.7255)。该区域经济发达,政府财政的教育投入能力强,且地势平坦开阔,道路等级高、路网密度高且通达性好,小学教育资源供给能力强。另外,还有部分区域(望牛墩镇、麻涌镇、大岭山镇、黄江镇等)尽管学校数量较少且服务能力等级较低,但由于学龄人口数量少且周边地区有服务等级较高的学校,因此存在可达性得分较高的格网。
图2
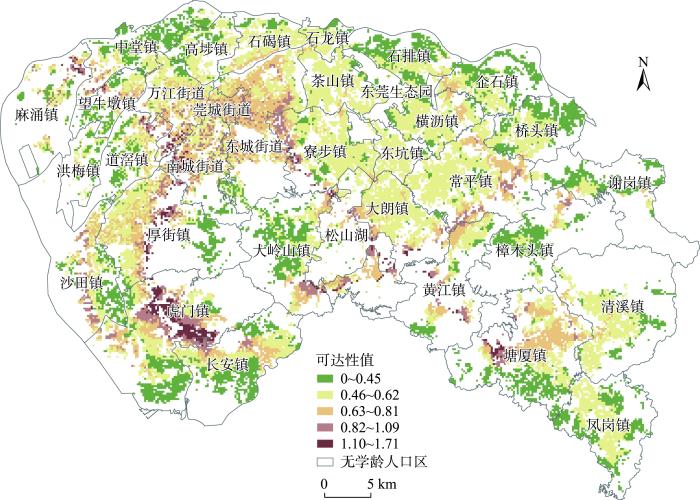
图2
基于综合服务能力多出行模式两步移动搜索法的东莞市小学空间可达性分布
Fig.2
Spatial variation of accessibility of primary schools in Dongguan City by comprehensive service capability and multi-model 2SFCA method
图3
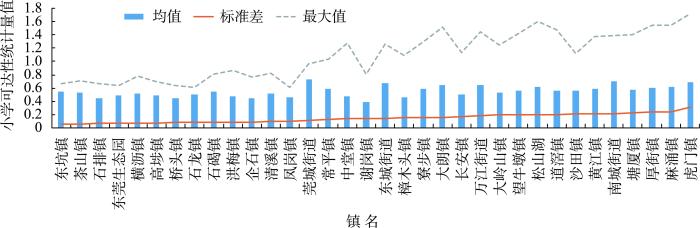
图3
东莞市小学空间可达性值基本统计量
Fig.3
Basic statistics of accessibility of primary schools in Dongguan City
可达性等级较低(0.46~0.62)的格网占总数的47.32%,在地形复杂区域以外地区均有分布,特别是松山湖片区北部和东部产业园片区中北部的镇有大面积成片分布,所在镇街的可达性最大值与均值都偏低,这些地区地势平坦,人口分布较为均衡,学校数量较多但服务能力一般。可达性等级低(0~0.45)的格网占总数的26.82%,在西北水乡新城片区,东部产业园片区北部的企石镇、桥头镇、谢岗镇,滨海片区虎门镇和长安镇的南部,东南临深片区的南部,以及松山湖片区和滨海片区交界处大岭山的四周均有零星分布,其中有24个格网可达性得分为0,18个集中在凤岗镇。这些地区大多远离东莞市的市中心和各镇镇中心,存在地形复杂和小学服务能力弱的特点。另外,可达性得分标准差最大的5个镇街分别是南城街道、塘厦镇、厚街镇、麻涌镇和虎门镇,说明这5个镇街小学教育资源的供需关系空间差异最大。可达性得分标准差最小的5个镇街分别是东坑镇、茶山镇、石排镇、东莞生态园和横沥镇,均位于东莞市中北部,镇域面积小且教育供需关系差异小。
3.2 基于可达性的东莞市小学教育资源公平性评价
根据《东莞市城市总体规划(2016—2030年)》和《东莞市教育事业发展第十四个五年规划和2035年远景目标纲要》,东莞市在各镇街基础教育设施规划布局基础上,依托并服务于片区社会经济产业格局和发展定位,探索建立义务教育片区统筹协调机制,加强片区义务教育统筹管理和教育优质资源跨区域共享。基于可达性的视角,通过基尼指数和洛伦兹曲线在市域、片区、镇街3个尺度上评价小学教育资源的公平性具有重要现实意义。基尼指数的高低可以反映市域、各片区、各镇街内部可达性的公平性程度,不同片区与不同镇街基尼指数的对比则反映了区域之间可达性的公平性差距。
东莞市域小学教育资源空间分配整体上处于绝对公平的水平(0.1604)。6大片区中,东部产业片区(0.1190)和城区片区(0.1292)教育公平程度最高,城区片区的学校服务能力整体上偏强,东部产业片区的学校服务能力整体上偏弱。滨海片区(0.2091)教育公平程度最低,小学的空间可达性差异最大(图4)。镇街尺度上,全市有31个镇街小学教育资源的基尼指数小于0.2,占总数的91.18%,说明东莞绝大部分镇街内部教育资源空间分配处于绝对公平的水平。将镇街基尼指数分为5个等级,反映其空间格局(图5)。结果表明,松山湖片区北部和东部产业园片区西北部的大多数镇公平性较好,基尼指数小于0.1,其中茶山和东坑两镇公平性最高,镇内格网间教育资源可达性差距小,具有良好的教育公平性;滨海片区(长安镇、虎门镇、沙田镇等)、水乡片区(麻涌镇、望牛墩镇)和松山湖片区(大岭山镇、松山湖高新区)的基尼指数整体偏高,大多镇街的基尼指数介于0.16~0.25之间,其中虎门镇、麻涌镇、松山湖高新区的基尼指数最高,镇街内部可达性差异较大,公平性最低;城区片区多数镇街基尼指数以0.11~0.15为主,镇街内部格网教育资源可达性差异水平居中。
图4
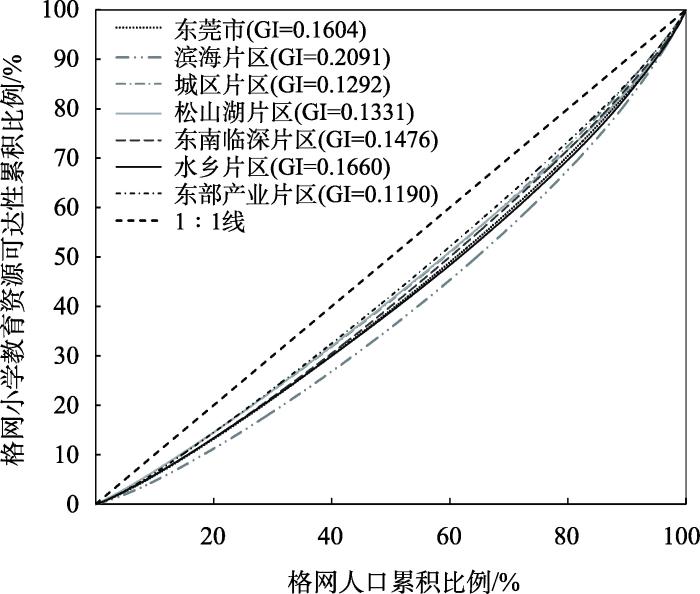
图4
东莞市小学教育资源分配洛伦兹曲线图
Fig.4
Lorenz Curve diagram of accessibility of primary schools in Dongguan City
图5
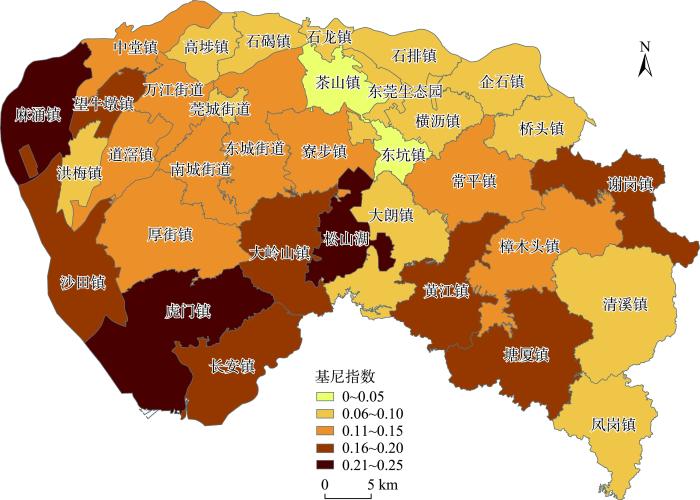
图5
东莞各镇街小学教育资源公平性的空间差异
Fig.5
Spatial variation of equity in accessibility of primary schools in Dongguan City
3.3 小学空间可达性的机制分析
本文运用空间误差模型(SEM)识别小学空间可达性的决定因素(表4)。结果表明,在需求者特征上,教育资源可达性与常住人口存在显著负相关关系,可能是教育部门基于户籍人口规模配置公共教育资源,未能完全匹配常住人口规模的实际情况,导致在控制其他因素的前提下,经济发达且常住人口多的地区教育资源可能出现可达性低;教育资源可达性与学龄人口呈显著正相关关系,原因可能是教育资源充沛的地区吸引大量有孩家庭迁入,且政府对该地区维持教育资源的高供给。在教育资源投入经济能力上,教育资源可达性与财政支出相关性不显著,与人均GDP和教育经费投入呈正相关,说明由人均GDP所反映的城市经济发展水平影响财政的收入、城市的发展、公共设施的建设等,但财政支出能力并不直接影响教育资源的可达性,教育经费支出能力才是影响教育资源可达性水平的直接因素,决定教育资源软硬件设施的投入水平。
表4 空间误差模型的估计结果
Tab.4
| 变量 | SEM结果 | 变量 | SEM结果 |
|---|---|---|---|
| 常住人口 | -0.009***(0.001) | 空间误差项 | 0.708***(0.005) |
| 学龄人口 | 0.686***(0.006) | Log Likelihood | -90585.765 |
| 人均GDP | 0.056***(0.013 ) | AIC | 181184 |
| 财政支出 | -0.372(0.285) | SC | 181232 |
| 教育经费支出 | 5.992**(2.938) | R2 | 0.936 |
| 常数 | -0.719**( 0.340) | N | 25651 |
注:*、**、***分别表示P<0.1、P<0.05、P<0.01;括号内值为标准误差。
东莞市中心城区是历次城市规划的建设重点,人均GDP整体水平较高,教育经费投入能力大,学龄人口密度高,教育资源可达性与公平性均较高。莞城与东城2个街道的城市建设成熟,新区开发渐少,教育资源经过多年建设基本稳定、配套均匀,教育资源供给与学龄人口需求变化保持较好的平衡。南城街道逐渐发展成为城市中心,万江街道发展提速,2个街道近10年人口增速超过莞城与东城,学龄人口也快速增长,旧村改造与新城建设加快,教育资源配套仍在完善中,但服务能力等级高的学校分布集中于街道中心区域,外围区域教育配套较弱,导致小学教育空间配置的可达性与公平性较莞城和东城2个街道稍低。石排、茶山、企石、桥头、东坑、横沥、凤岗等镇在近20多年成为新增城市用地密度高、制造业生产空间扩展热点的区域,但地方经济以中小企业为主,镇域生产总值、教育经费投入能力偏弱,学校以低等级为主且较分散,镇中心教育资源配套不够完善,导致该区域可达性较低,但公平性较高。东莞南部受深圳影响最深,虎门、长安、厚街、大岭山、松山湖、大朗、黄江、樟木头、塘厦等镇,形成一条电子信息产业带,该区域经济水平高,地区生产总值、教育经费投入排位靠前,但镇域经济、学龄人口与教育资源分布重心主要在镇中心,外围村镇工业园宿舍区和城中村多外来人口聚居,教育配套建设不足,大部分镇内部可达性高低差异较大,公平性较低。
4 结论与讨论
4.1 结论
本文构建了考虑学校综合服务能力和多出行模式情景的两步移动搜索法,测度了东莞市小学空间可达性状况与空间分异格局,评价了其公平性水平与形成机制。主要结论如下:
(1) 东莞市小学教育可达性呈现西高东低的空间格局,由高值区向四周随距离增加而衰减。可达性较高的区域主要在中心城区4个街道和滨海片区的厚街镇和虎门镇;可达性较低的区域主要在松山湖片区和东部产业园片区的北部大面积成片分布;可达性低的区域主要位于水乡地区、大岭山、银瓶山等地形复杂地区。南城街道、塘厦镇、厚街镇、麻涌镇和虎门镇等镇街内部小学教育资源供需关系存在较大的空间差异;东坑镇、茶山镇、石排镇、东莞生态园和横沥镇等镇街内部教育供需关系差异较小。
(2) 在公平性分析上,东莞市市域范围处于绝对公平的水平,东部产业片区和城区片区公平程度最高,滨海片区公平程度最低,91.18%的镇街小学教育资源空间分配处于绝对公平,茶山镇和东坑镇空间分配最公平,虎门镇、麻涌镇、松山湖高新区镇内教育资源公平性最低。
(3) 在机制分析上,空间误差模型对社会经济条件与教育可达性关系的拟合效果更好,其回归分析结果表明,学龄人口规模、人均GDP和教育经费支出是东莞市小学空间可达性的主要影响因素,对教育资源的空间配置具有正向推动作用;常住人口与教育资源空间配置存在负相关关系;财政支出与教育资源空间配置相关性不显著。
4.2 讨论
本文基于多源数据,纳入学校综合服务能力和多出行模式改进传统两步移动搜索法,在细粒度人口格网尺度上测度小学教育资源的可达性,为城市教育资源可达性的测度提供新思路。结合含有学生通学行为和择校考虑因素的东莞市问卷调查数据,设定多出行模式两步移动搜索法的参数,对学校各项指标进行赋权并评价其综合服务能力,研究结果更符合小学教育资源的可达性真实情况。基于一标三实实有人口数据和七普数据相互校验的人口数据更具时效性,对当下研究区域教育资源供需关系的评价更具指导价值。在细粒度格网尺度上开展研究,比在社区或以上尺度上开展研究更能反映教育资源可达性在行政单元内部的异质性。
实践层面上,本文可为东莞小学教育资源空间公平配置提供一定的参考。首先,在供需上,可考虑在资源供给不足且可达性差的地区增建学校,如洪梅镇、麻涌镇、企石镇、石排镇,以及虎门镇和长安镇的西南部等;在地形复杂、人口稀少分散的地区,可以对原有服务能力较弱的学校进行扩容提质,扩大教育服务规模,如大岭山、银瓶山等周边地区;推动服务能力等级高的学校分散分布,弱化超级学校的规模效应,如加大该类学校的分校发展或资源跨区域调配,缓解中心城区一带与外围地区的教育差距。其次,交通网络沟通供需双方,对可达性影响大,应重视道路设计与交通规划。东莞市小学生公共交通出行比例最小,步行可达性最低。根据东莞市2020年开启的“15 min优质生活圈”,可考虑通过优化路网建设,加强城市步行与非机动车交通系统的建设,优化公共交通连接供给点与需求的线路安排,降低私人驾车出行比例,加强通学的绿色出行可达性。此外,加强居民宣传,了解民众的教育诉求,鼓励民众参与教育资源配置的规划与建设,使教育配置更好地满足民众的实际需求。
本文也存在不足之处:一是未考虑小学学区划分影响,也未对公办小学和民办小学加以区分;二是仅考虑不同出行模式设置出行极限时间阈值,且时间阈值的设置存在一定的主观性,未考虑学校服务能力的差异对服务空间范围的影响;三是未根据实际的公交汽车线路图和时刻表计算公交汽车的速度,导致模型分析结果与现实存在一定的偏差;四是由于学校活动场地面积数据的缺失,无法评价学校在学生动商培养方面的硬件条件;五是在分析小学空间可达性机制的时候仅使用人口截面数据,无法获取各网格的学龄人口规模在过去一段时间的变化状况,忽视了教育部门在配置教育资源的时候会考虑未来学龄人口变化趋势的情况,从而导致空间回归模型出现遗漏变量的问题。
参考文献
大连市初中教育消费者的社会空间结构研究
[J].
DOI:10.13249/j.cnki.sgs.2018.07.014
[本文引用: 1]

基于消费者差异的特色均等化是义务教育未来发展的重要指向。运用因子生态分析法对大连市域范围内189所初级中学学生的问卷调查数据进行分析,提取出5个主因子并划分为5类初中教育消费者,得出大连市初中教育消费者在空间上呈现出职业的城乡分化、受教育水平的南北差异等多重分异特征。然后采用聚类分析方法和集中度指数将所研究的初中教育消费者所在学校划分为4类,即高学历高收入家庭子女学校、城市中上收入家庭子女学校、农民及外出务工人员子女学校和工人及办事人员子女学校。最后根据不同类型初中教育消费者所在学校空间上的分布特征,归纳出大连市初中教育消费者社会空间结构的圈层分布特征。
The socio-spatial structure of middle school education consumers in Dalian
DOI:10.13249/j.cnki.sgs.2018.07.014
[本文引用: 1]
The equalization with characteristics based on consumers’ differences is an important director for developing compulsory education in following years. Factorial ecological analysis method is used to analyze the survey data of questioned students from 189 middle schools in Dalian City. Five principal factors are extracted and classified into five kinds of middle school consumers. Four kinds of middle school consumers could be divided with the hierarchical cluster analysis methods and concentration index. At last, according to the distribution characteristics of different middle school consumers, it summarized that what is the distribution characteristics of the middle school students’ social space structure in Dalian. The following conclusions can be drawn. 1) There exists a significant difference in spatial structure of middle school students in Dalian, which is shown differently with diversified classification standards. As a whole, it presents such the complex spatial characteristics as the urban and rural division of occupation and the north-south education difference. 2) Given the demand-side, the middle school education consumers in Dalian can be divided into four categories: the first is for children in highly educated and high-income families,the second is for children in urban middle-income families, the third is for children in farmers and migrant workers families, and the forth is for children in the workers and staff families. There are significant differences in the composition of the social groups represented by the students and their students in each type of school, which further leads to the emergence of schools with different characteristics and types. 3) The differences of social groups with a unit of school show obvious spatial distribution characteristics. The core layer, the core of a city, has the schools for children in highly educated and high-income families. The second layer, which is the marginal area and the new urban area of a city, has schools for the children of upper-middle income families and industrial workers as well as office workers. The outer layer where the outlying counties area, has schools for children of farmers and migrant workers.
城乡基本公共服务设施布局均等化研究: 以常州市教育设施为例
[J].
Research on equalized layout of urban and rural public facilities: A case study of educational facilities in Changzhou
市域义务教育资源均衡水平的空间特征与分布模式: 以大连市小学为例
[J].
Spatial characteristics and distribution pattern of the equilibrium level of municipal compulsory education resources: Take Dalian primary school as an example
中国优质基础教育资源空间格局形成机制及综合效应
[J].
DOI:10.11821/dlxb202002008
[本文引用: 1]
教育关乎一个国家人口素质的提升和综合实力的发展,也是塑造国家和地区人地关系的重要因素。通过回顾并反思中西方人文地理学视角下的教育资源配置研究,总结当前中国相关研究的不足。借鉴当前西方教育资源空间格局研究中所采取的“资源格局—影响机制—社会效应”的主流路径,本文利用多种空间分析和机制研究方法,对中国优质基础教育资源空间格局、形成机制和综合效应进行了分析。研究发现:① 优质小学基础教育资源和优质中学教育资源的区域格局和强度虽各有差异,但都体现出不平衡的发展特征,特别是在区域尺度上,体现出明显的东西部差异。此外,中国几大城市群,如京津冀,沪宁杭,珠三角,武汉都市圈以及成渝都市圈等,是优质基础教育资源的优势区域;② 优质小学教育资源的形成和规模增长与城市居民经济自由度以及城市专任教师规模两个因素高度相关;优质中学教育资源的形成和规模增长和城市本底经济社会发展水平因素高度相关;③ 在多元相关机制作用下,中国优质教育资源空间结构在当下及未来必定处于复杂动态变化之中,并将更为深刻地塑造着城市与城市、城市与社会之间的互动关系。本文有助于理解中国优质教育资源空间结构不平衡的现状,同时反思和探索教育资源结构所蕴含和产生的政治意义和社会影响。
Analysis of the spatial structure, mechanism and social-political effects of the high-quality basic educational resources in China
DOI:10.11821/dlxb202002008
[本文引用: 1]
Education is not only important for strengthening a country's population quality and comprehensive power but key in reshaping the "man-land" relations in a country. This article reviews studies on the distribution of educational resources in both Chinese and Anglophone literature and summarizes the research gaps in the Chinese literature, which include but are not limited to the downplay of the analysis of mechanism and comprehensive effects of the spatial structure of educational resources. Employing different map-making technologies and mechanism-analysis methods, this article dives into three findings. First, though spatial features are slightly different between primary school level and middle school level, eastern regions generally have higher quality educational resources than western regions. In addition, urban agglomeration, including Beijing-Tianjin-Hebei, Shanghai-Ningbo-Hangzhou, and the Pearl River Delta, have an advantage in attracting and cultivating high-quality educational resources. Second, the quantity of high-quality primary school resources is positively correlated with annual per capita disposable income of urban households and number of full-time primary school teachers. The quantity of high-quality middle school resources is positively correlated with the comprehensive economic and social performance of the city. Third, when affected by multiple mechanisms, the spatial structure of China's high-quality educational resources is dynamic and deeply intertwines with the interrelations between cities as well as between the societies within each city. This article contributes both to the understanding of the unequal spatial structure of high-quality educational resources in China and to the analysis of complex socio-political effects on this transforming structure. Its findings encourage further research on the connection between the spatial structure of a region's educational resources and its cooperation and geopolitics as well as on the resulting social mobility among different social strata. Study limitations include: place-related elements, such as local political resources, were not sufficiently considered when selecting factors; there is a lack of longitudinal analysis; and not enough attention is paid to the combination of number-based data and geo-information-based data in analyses.
农村中小学选址的空间运筹
[J].
DOI:10.11821/dlxb201310010
[本文引用: 1]
农村中小学的选址问题是当前地理学区位理论应用的一个热点,学校作为一个设施对学生上学安全和便捷程度有很大影响。许多学者研究了学校的区位问题,然而对农村地区来说,采用模型不够适合。本文学校选址研究充分考虑P-重心模型和P-中心模型的优缺点,在P-重心模型的基础上对模型进行改进,增加学生上学最大距离不超过某一阈值的约束,这样改进后的模型同时具有P-中心和P-重心模型的优点,既保证农村偏远地区的学生上学相对方便,又保证加权距离和相对最小。为了方便应用,应用地理信息科学方法,使用改进的节点交换搜索算法求解,然后通过Visual Studio 开发平台和ArcGIS Engine 二次开发组件库开发了农村中小学最优选址的决策支持系统。最后以山东省某镇为例,用该系统解决该镇的小学选址,结果发现改进后同时具有P-重心和P-中心特性的模型比传统的P-重心模型更能适合农村小学选址,能够作为小学学校规划选址的辅助决策依据。
Space operation of rural primary and secondary school location
DOI:10.11821/dlxb201310010
[本文引用: 1]
The location of the primary and secondary schools has a great significance on ensuring the safety and convenience when students attending and leaving schools. Many previous researches have proposed school location-allocation models, but the models are not suitable for rural schools. In this manuscript, we improve the P-median model by fully considering the advantages of P-center model and P-median model. A maximum distance constraint between students' home and school are coupled into the original P-median model. Thus, the improved P-median model owns the advantages of both P-center model and P-median model, i.e. ensuring the convenience for students from remote rural areas, and minimizing the sum of weighted distance. In order to facilitate the model application, an decision support system based on our newly derived vertex substitution search algorithm for allocating optimal location of rural elementary and secondary school were developed on the ArcGIS Engine development component library and Visual Studio development platform. Afterwards, a town of Shandong province is taken as a system test case. The school location selected by our system is better than the locations selected by traditional P-median model. The results prove that the improved P-center model can supply a reference for allocating the location of elementary and secondary school.
A multiperiod school location planning approach with free school choice
[J].
DOI:10.1068/a40285
URL
[本文引用: 1]
The subject of this paper is a new approach to multiperiod school location planning in urban areas. Most of the existing approaches in the field do not consider free school choice nor are they able to consider substitution effects between school locations. We minimize the location and transport costs with respect to students choosing the school with the highest utility. Since these school choice probabilities (determined by a mixed multinominal logit model) depend on the available schools, we have to consider two steps. First, we generate for each period a set of scenarios indicating which school is open and which is not. For each scenario we allocate the students to available schools according to capacity and utility. Second, we select for each period one scenario in order to minimize total costs. Problems with a long planning horizon and a large number of demand points are solvable. We apply this approach to schools of the City of Dresden, Germany.
社区生活圈基础教育设施空间可达性评价与布局优化研究: 以大连市沙河口区为例
[J].
DOI:10.13249/j.cnki.sgs.2020.11.002
[本文引用: 1]
使用基于Rhino平台的UNA工具包,从住宅楼层面对大连市沙河口区幼儿园、小学和初中3类基础教育设施的空间可达性进行分析,并提出布局优化措施及新增选址方案。主要结论如下:① 各类基础教育设施空间分布不均,存在重复与缺失并存的现象;设施与住宅楼空间分布“错位”现象严重。② 各类基础教育设施均存在服务范围内住宅楼数量较少的问题,学区内的学生上下学需要耗费较长的路程与时间,若设施仅服务于规定服务范围内的居民,则部分设施会存在利用不足的情况。③ 在规定服务范围内,初中的可达比重最大,其次是小学和幼儿园。在规定服务范围外,幼儿园可达性为差及以下的比重最大,其次是初中和小学。④ 设施布局主要存在2个问题:设施供应不足和设施利用不足,对此提出相应的优化思路。并在考虑可达性和供需的情况下,提出2个新增设施参考选址方案,以改善设施可达性。其中方案一增加140所,方案二增加107所。
Spatial accessibility evaluation and layout optimization of basic education facilities in community life circle: A case study of Shahekou in Dalian
DOI:10.13249/j.cnki.sgs.2020.11.002
[本文引用: 1]
As an important part of basic public service facilities, basic education facilities are of great significance for improving the quality of life of residents and improving the efficiency of urban operations. At present, the research on educational facilities is comprehensive, mainly focusing on spatial layout, spatial accessibility and facility configuration. However, in the research scale, residential units and even subdistrict are mostly basic units. Such accuracy is obviously poor. This paper uses UNA toolkit, which based on Rhino, to analyze the spatial accessibility of three basic education facilities in kindergarten, elementary school and junior high school in Shahekou District of Dalian from the residential building and community level, and proposes optimization ideas and site-selection schemes. The main conclusions are as follows: 1) The spatial distribution of various basic education facilities is uneven, and there are phenomena of duplication and lack of coexistence; the phenomenon of “dislocation” of facilities and residential buildings is serious. 2) All kinds of basic education facilities have the problem of a small number of residential buildings within the service area. It will take a long time and distance to go to school. If the facility only serves residents within the scope of the specified service, some facilities may be underutilized. 3) In the scope of the prescribed services, junior high schools have the largest proportion of accessibility, followed by primary schools and kindergartens. Outside the prescribed scope of services, kindergartens have the worst accessibility, followed by junior high schools and primary schools. 2.97% of residential buildings with poor accessibility of the three types of facilities. These areas should give priority to adding education facilities. 4) In consideration of supply, demand and accessibility, two new facilities reference site selection schemes were proposed.
School admissions and the segregation of school intakes in New Zealand cities
[J].
DOI:10.1080/00420980701302361
URL
[本文引用: 1]
Although small, New Zealand is a useful comparative case for studying changing school admissions policies and their impact in urban areas. This article reviews New Zealand's admissions policies and their impact over three periods: the post-war social-democratic period, the 1990s when quasi-market policies were embraced in New Zealand; and the period since 2000 when the present Labour government reintroduced school admissions by residential zoning. The available evidence from all of these periods shows that New Zealand's urban middle classes have always sought and been successful in finding ways to educate their children in socially advantaged schools, but have done this in different ways depending on the policy of the day. The evidence from all periods also shows socially advantaged urban schools participating enthusiastically in this project.
两步移动搜寻法及其扩展形式研究进展
[J].
DOI:10.18306/dlkxjz.2016.05.006
[本文引用: 2]
两步移动搜寻法是公共服务设施空间可达性研究中的重要方法,在国内外公共服务设施布局研究中得到了广泛应用,且发展出了众多扩展形式。但国内研究中对两步移动搜寻法尤其是其扩展形式的应用还较为有限。本文对两步移动搜寻法的主要扩展形式进行系统梳理和总结,将国内外研究中提出的两步移动搜寻法扩展形式归纳为基于引入距离衰减函数的扩展、对搜寻半径的扩展、针对需求或供给竞争的扩展以及基于出行方式的扩展4类,并分析了各种扩展形式的优缺点、适用情景以及未来可能改进方向。旨在为相关研究的方法选择提供参考,促进两步移动搜寻法及其扩展形式在国内相关领域的应用和发展。
Research progress of the two-step floating catchment area method and extensions
DOI:10.18306/dlkxjz.2016.05.006
[本文引用: 2]
Two-step floating catchment area (2SFCA) method is an important method of research on spatial accessibility to public services, which has been widely applied in studies on the spatial layout of public service facilities. Various extensions of 2SFCA have been developed. However, the application of the 2SFCA method and especially its extensions is still very limited in China. Thus, this study systematically summarizes the major extensions of the 2SFCA method. Such extensions found in existing literature can be classified into four categories. The first category focuses on the distance-decay function, replacing the dichotomous distance-decay form of the original 2SFCA by a multilevel discrete form as in the Enhanced 2SFCA, or continuous forms such as in the gravity-style, Gaussian-style, and Kernel-density-style distance-decay functions. The second category deals with the delimitation of catchment areas. The original 2SFCA form adopts a buffer-ring (BR) method delineating the catchment areas as concentric circles with certain radii of physical distance or travel time. A number of extensions have improved the BR method, including the Variable 2SFCA, the Dynamic 2SFCA, and the Multi Catchment Sizes 2SFCA. Moreover, a novel nearest-neighbor (NN) method for delineating the catchment areas by identifying a finite number of nearest facilities for each demand node has been proposed. The third category strives to improve the accuracy of 2SFCA by accounting for the competition among demand nodes or among supply nodes. The initial extension of this category is the Three-step Floating Catchment Area (3SFCA) method, following which other extensions such as the Modified 2SFCA and the Huff 2SFCA are proposed to make further improvements. The fourth category extends the travel means of the demand side, including the Multi-mode 2SFCA taking into account various potential transportation modes, and the Commuter-based 2SFCA integrating service visits and commuting behavior. The advantages and disadvantages, scenarios appropriate for their application, and potential improvements in the future of these extensions are also discussed. This study can contribute to the choice of method in relevant studies and promote the implementation and development of the 2SFCA method and extensions in relevant research fields in China.
公共服务设施空间可达性及其度量方法
[J].
DOI:10.11820/dlkxjz.2010.10.009
[本文引用: 1]
空间可达性度量既可用于评价公共服务设施空间布局的合理性,也可用于比较规划方案的优劣。公共服务设施空间可达性度量需要针对不同设施特有的空间布局目标,选取与之相适应的可达性评价因子,并采用合适的度量方法展开,对此进行专题研究的文献并不多见。本文一方面在对公共服务设施按照时效性、接受性、数量、等级性进行分类的基础上,系统阐述如何针对不同设施进行空间布局目标设定和可达性评价因子选取;另一方面将主要的度量方法分为比例法、最近距离法、基于机会累积的方法、基于空间相互作用的方法,并对各类方法的应用领域及优缺点予以分析比较,同时以潜能模型、两步移动搜寻法为例探讨相关方法在公共服务设施空间可达性度量中的应用;最后在对上述研究总结评述的基础上,本文指出多等级设施空间可达性、从需求者的活动规律考虑空间可达性、针对各类设施的综合空间可达性以及相关度量方法与GIS的集成等主题值得投入更多关注。
Spatial accessibility to public service facilities and its measurement approaches
DOI:10.11820/dlkxjz.2010.10.009
[本文引用: 1]
Spatial accessibility measurement can be applied to assess the rationality of public service facilities distribution, and can be used to compare the merits and drawbacks of related planning schemes. As for spatial accessibility measurement to public service facilities, the primary issue is to select corresponding accessibility evaluation factors according to specific spatial distribution targets of various facilities presumed by facilities features and service demands, and the next is to apply appropriate accessibility measurement approaches according to the evaluation factors and to achieve the accessibility calculation. However, it is unlucky that the present literature on such thematic studies is scarce. On the one hand, we analyze the classification to public service facilities from the perspectives of service urgency, acceptability, quantity (single or various) and hierarchic rank, and then we discuss how to presume spatial distribution targets and select corresponding accessibility evaluation factors of different facilities. On the other hand, we introduce the main measurement approaches including the methods based on supply (provider) versus demand (population), the shortest travel impedance (time or distance), opportunities to be accumulated, and spatial interaction, and furthermore we compare the applications as well as the merits and drawbacks of various approaches, and discuss how to measure spatial accessibility of public service facilities based on potential model and two-step floating catchment area method. Finally, based on the above review and summary, we point out that the following research topics should be devoted more attention to: the spatial accessibility measurement to hierarchical facilities, comprehensive examination of the spatial accessibility measurement from the point of view of demanders activities, integrated spatial accessibility measurement to multiple facilities in the study area, and the integration between complicated measure approaches and GIS.
How accessibility shapes land use
[J].DOI:10.1080/01944365908978307 URL [本文引用: 1]
Comparing GIS-based methods of measuring spatial accessibility to health services
[J].DOI:10.1007/s10916-006-7400-5 URL [本文引用: 1]
农村中小学布局调整之空间可达性分析: 以河南省巩义市初级中学为例
[J].
Analysis of spatial accessibility for redistricting in rural China: A case study of the secondary schools in Gongyi City, Henan Province
河南省县域学校体系规模、可达性演化特征及其分异
[J].
DOI:10.13249/j.cnki.sgs.2020.10.014
[本文引用: 1]
县域义务教育学校体系规模的合理布局、适龄儿童入学可达性对义务教育公平和均衡发展具有重要意义。采用基尼系数、齐夫指数等方法对泌阳县2004—2016年县域小学学校体系规模空间演化特征、就学可达性变化及其空间分异进行了实证研究。结果表明:研究区县域小学规模两极分化严重,学生和教师的城乡不平衡指数大大增加,首位学校以及位序靠前的学校垄断性增强,学校规模从均衡发展演化为非均衡状态;2016年入学距离在2 km范围内的自然村相比2004年略有降低,距最近完全小学在2 km范围内的自然村出现大幅降低,完全小学大幅减少,服务范围增大,覆盖度出现显著降低;2016年各乡镇学生、教师基尼系数显著增加,全县范围空间分异规律基本一致;相比2004年,2016年地形高度、距乡镇政府所在地距离对自然村入学距离影响显著增强,特别是对最近完全小学入学距离的影响更大。
Scale and accessibility of school system and its spatial differentiation of elementary schools in Henan Province
DOI:10.13249/j.cnki.sgs.2020.10.014
[本文引用: 1]
The article adopts Gini coefficient, Ziff index, accessibility analysis and urban-rural imbalance index to empirically study the model of the scale spatial pattern of the urban and rural school system scale of the compulsory education in the central agricultural area of county in Henan from 2004 to 2016. The results show that: 1) The difference in the size of primary schools in the district and county area increased, the polarization was serious, the number of middle suitable size decreased significantly, and the urban-rural imbalance index between students and teachers increased greatly. The Ziff index analysis of order of primary school students in the county shows that the first school and the top schools increased in size and monopoly. 2) Compared with 2004, there was a slight decrease from the natural villages within 2 km specified by the Ministry of Education in 2016; the natural villages were significantly reduced from the nearest complete primary school in 2016. The number of natural villages with a school distance of more than 2 km increased by 2.87, and there was a significant reduction (50.6%) in complete primary schools. And there was a sparse spatial distribution and an increase in the range of services. 3) The coverage of all primary schools in the study area in 2016 was less than that in 2004, but the coverage of complete primary schools decreased significantly, with 1 km coverage reduced by 60%, compared to 2004; and the coverage of 2 km service area decreased by 48%. The 2 km coverage required by the Ministry of Education accounts for only about 40% of the county's area, which did not meet the requirements of the Ministry of Education. 4) The Gini coefficient of students and teachers in the townships in the study area in 2004 was relatively small, but the size of the school and the teachers were in a state of balanced development as a whole, and the Gini coefficient of students and teachers increased significantly in 2016, and the spatial differences were basically consistent. The main part of the townships with large changes in the Gini coefficient is around the county and towns with high level of urbanization. 5) The natural villages in the study area showed the change of elevation with the increase of enrollment distance; the further the distance of admission is, the higher the average altitude is. Compared with 2004, with the increase in altitude from the nearest primary schools and the nearest complete primary schools, an average distance increased significantly. 6) In 2016, compared with 2004, the distance from villages and towns has a greater impact on the access to school, especially on that to the nearest complete primary schools.
南京市高级中学可达性及空间分布特征研究
[J].
Study on accessibility and spatial distribution characteristics of senior high schools in Nanjing
城市基础教育设施的空间可达性与公平性研究: 以上海市浦西8区小学为例
[J].
Research on the accessibility and equity of urban basic educational facilities: A case of primary schools in Puxi, Shanghai
山区贫困县中小学空间格局变化与可达性分析: 以河南省嵩县为例
[J].
DOI:10.18306/dlkxjz.2018.04.011
[本文引用: 2]
山区贫困县具有经济落后、交通不便、人口分散且居住空间格局快速变化等特点,使得其中小学空间格局变化及可达性分析在教育公平中具有重要意义。本文以豫西山区贫困县嵩县为例,利用1997、2007、2015年中小学数据,运用趋势面分析和引力模型等方法对其空间格局变化及其空间可达性进行研究。主要结论为:①嵩县中小学空间布局在一些地形条件地区局部集中:小学在浅山丘陵区和低山区分布相对较多,初中则局部集中在浅山丘陵区;②撤点并校使中小学数量减少,各行政村内学校数量的分布差距缩小,趋势线逐渐平缓;③Voronoi模型的Cv值结果显示,中小学空间分布呈集聚分布状态,随着中小学数量的减少其空间集聚程度逐渐下降,在县域北部沿东北—西南走向呈现面状密集分布区,沿境内两条主要干线路(G311和S247)分别形成南北和东西向狭长带状分布区;④2015年中小学空间可达性区域差别明显,小学最远入学距离为最近入学距离的160倍,有26.1%的村庄初中入学距离达10 km以上,且全部位于中山和低山地区;⑤地形、交通、人口、经济、政策因素等对嵩县教育资源的分布具有重要影响。
Changing spatial pattern and accessibility of primary and secondary schools in a poor mountainous county: A case study of Song County, Henan Province
DOI:10.18306/dlkxjz.2018.04.011
[本文引用: 2]
Poor mountainous regions in China suffer from economic underdevelopment, inconvenient transportation, scattered population distribution, and fast-changing residential spatial pattern. These make the study of spatial distribution changes of primary and secondary schools in these regions critical for improving education equality. By using the case of Song County in the poor mountainous region of western Henan Province, this study acquired long-term school data (1997, 2007, and 2015), and analyzed the changes in spatial pattern and spatial accessibility of these schools employing the trend surface analysis technique and gravity model. The results show that: (1) Primary and secondary schools in Song County were partially concentrated in areas with some terrain conditions. Primary schools were found more in the hilly and low-mountainous areas, and secondary schools concentrated in the hilly areas. (2) School merges decreased the total number of institutions and the differences in the number of schools among different villages, and the trend line became flat gradually. (3) The Cv value of the Voronoi model shows that schools followed an aggregated distribution pattern, and the degree of aggregation decreased as the number of schools decreased. The schools were mainly found in a region spreading from northeast to southwest in the northern part of the county, forming two narrow distribution bands along the two main roads (S247 and G311). (4) School accessibilities were spatially varied in 2015. The longest distance to school was 160 times that of the shortest distance to school. Villages that had more than 10 km distance to schools were all found in the mid-mountainous and low-mountainous areas, constituting 26.1% of the total number. (5) Terrain, transportation, population, economy, and government policy were all influential to the distribution of educational resources in Song County.
基于改进型两步移动搜索法的县域义务教育资源空间可达性评价: 以湖北省监利县为例
[J].
Spatial accessibilities evaluation of compulsory education at county level based on improved two-step floating catchment area method: Taking Jianli County of Hubei Province as an example
基于改进高斯两步移动搜索法的深圳市公园绿地可达性评价
[J].
DOI:10.18306/dlkxjz.2021.07.004
[本文引用: 1]
公园绿地可达性是衡量城市宜居水平的重要指标。针对传统可达性分析多用统计数据开展评估而导致的供需尺度失衡问题,论文以深圳为例,采用公园绿地空间矢量数据和手机信令数据获取供需空间分布,采用高斯两步移动搜索法计算交通小区(TAZ)尺度公园绿地可达性,并结合可达性结果及供需、交通情况聚类,剖析可达性差异化模式及成因。主要结论如下:① 通过改进传统可达性计算数据源和高斯两步移动搜索模型,建立城市中微观尺度公园绿地可达性评价及成因研究框架,可更精确地评估优化城市公园绿地可达性;② 深圳市公园绿地综合可达性整体水平较高,但存在明显的从中心向外围递减的趋势,社区公园可达性差异与公园绿地供需不匹配是造成各区域可达性差异大的重要原因;③ 根据K均值聚类分析结果,将深圳市TAZ单元分成低供给低需求低可达性区、中供给低需求中可达性区、高供给高需求中可达性区、高供给低需求高可达性区,各类区域具有差异化的可达性内涵、特征和成因;④ 公园绿地可达性提升可针对不同分区特征,通过公园布局优化、道路建设和居住区规划布局等差异化方式实现。研究充实了城市公园绿地可达性评价案例,提出的基于手机信令数据和高斯两步移动搜索法的可达性分析方法不仅可应用于城市公园绿地布局与规划,也可为其他地理现象可达性分析提供思路参考。
Evaluation of green space accessibility based on improved Gaussian two-step floating catchment area method: A case study of Shenzhen City, China
DOI:10.18306/dlkxjz.2021.07.004
[本文引用: 1]
Accessibility of park green space is an important indicator of the livability level of a city. In order to solve the problem of scale imbalance between population and park green space distribution data by traditional accessibility analysis, this study used mobile phone signaling data to obtain the spatial distribution of population, and adopted the Gaussian two-step floating catchment area method to calculate the accessibility of park green space at the scale of traffic analysis zone (TAZ) in Shenzhen City. It also conducted a cluster analysis based on the accessibility results, supply and demand, and traffic conditions. The main conclusions are as follows: 1) More refined population information can be obtained through mobile phone signaling data to improve the accuracy of demand assessment. For different types of parks, the Gaussian two-step floating catchment area method represents an improvement in calculating the accessibility of parks in the city. 2) The overall level of comprehensive accessibility of park green space in Shenzhen is relatively high, but there is an obvious decreasing trend from the city center to the periphery. The mismatch between the accessibility of community parks and the supply and demand of park green space is an important reason for the large difference of accessibility among different regions in Shenzhen. 3) According to the results ofK-means clustering analysis, the TAZ units of the city was divided into low supply low demand low accessibility zone, medium supply low demand medium accessibility zone, high supply high demand medium accessibility zone, and high supply low demand high accessibility zone. 4) The accessibility of park green space can be improved by optimizing park layout, road construction, and residential area planning and layout. By improving data source and model of the traditional accessibility calculation, this study enriches the cases of park green space accessibility evaluation, and the proposed accessibility analysis method based on mobile phone signaling can also provide a reference for the accessibility analysis of other geographic phenomenon.
基于改进潜能模型的县域小学空间可达性研究: 以湖北省仙桃市为例
[J].
DOI:10.18306/dlkxjz.2017.06.005
[本文引用: 1]
空间可达性是评价教育设施布局合理性的重要指标,而潜能模型是度量教育设施空间可达性的重要方法。本文在引入学校服务能力因子的基础上,综合考虑学校服务能力等级影响和居民极限出行时间构建就学影响因子,对潜能模型加以改进。通过以湖北省仙桃市为典型县域单元的案例研究,结果表明:①村级居民点尺度,乡镇中心和高等级公路沿线居民点的小学空间可达性普遍较高,并按照一定的半径范围呈距离衰减过程,而乡镇毗邻地区居民点的小学空间可达性相对较差;②乡镇(街道)尺度,可达性较高的乡镇(街道)主要分布在沿G318的北部地区,且城乡间、主城区与城郊的小学空间可达性均存在一定差距;③改进潜能模型能合理地评价各农村居民聚落点和各乡镇的小学空间可达性,当摩擦系数β取值为2时,能更为准确地揭示农村居民所能获取的教育资源,为相关部门决策提供科学依据。
Spatial accessibility analysis of primary schools at the county level based on the improved potential model: A case study of Xiantao City, Hubei Province
DOI:10.18306/dlkxjz.2017.06.005
[本文引用: 1]
Spatial accessibility is an important index to evaluate the configuration of educational facilities, and potential model is an important method to measure the accessibility of educational facilities. This study improved the potential model from two aspects: by introducing the factor of primary school service ability, and constructing the school influence factor by considering the influence of schools with different grades of service capability and local residents' travel time limit. Based on the data of Xiantao City in Hubei Province by the end of 2010 on primary schools, residents, traffic network, and so on, the improved potential model was applied to assess the variation of spatial accessibility to primary schools in Xiantao City. The results show that: (1) At the village-level settlement scale, the spatial accessibility of primary schools for the residents is universally high at township centers and along transport corridors, and shows a distance attenuation effect at certain radius, but the spatial accessibility of primary schools at settlements between townships is relatively low. (2) At the township scale, the towns with higher spatial accessibility are mainly distributed in the northern area along the G318 road. (3) The improved potential model could reasonably evaluate the spatial accessibility of primary schools in each rural settlement and township. Also, when the value of friction coefficient (β) is set as 2, the educational resources available for rural residents can be reflected more accurately, and this provides a reference for the decision making by relevant government departments.
基于改进两步移动搜索法的上海市黄浦区公园绿地空间可达性分析
[J].
DOI:10.18306/dlkxjz.2021.05.005
[本文引用: 1]
为解决高密度城市公园绿地供需不平衡的问题,论文提出了一套改进的两步移动搜索模型,并以上海市黄浦区为例,对其现有公园绿地进行步行条件下的空间可达性分析。首先从网络爬取研究范围内居住小区POI信息,将其聚合在边长100 m的正六边形蜂窝网内,计算得到每个人口单元的人数及人口密度,并利用百度地图API路径规划接口爬取各供给点和需求点间基于实时路况的出行时间;其次,以黄浦区2019年底已建公园绿地为例,从居住区人口需求、可达性分级、冷热点和盲区分析4个方面对其供需配置进行量化分析,结果表明,黄浦区公园绿地可达性水平整体北高南低,和人口密度分布呈负相关,存在供需错位问题,且仍有9.16%的显性盲区和16.5%的隐性盲区亟待消除。研究结果为进一步优化绿地空间布局和选址提供指导依据;最后从适度增量、盘活存量、社区共治3个方面提出建议,以期为黄浦区绿化“十四五”规划提供理论支持。
Spatial accessibility of park green space in Huangpu District of Shanghai based on modified two-step floating catchment area method
DOI:10.18306/dlkxjz.2021.05.005
[本文引用: 1]
In order to solve the problem of unbalanced supply and demand of park green space in high density cities, this study used a Gaussian based two-step floating catchment area method to analyze the spatial accessibility of existing park green space in Huangpu District of Shanghai, under walking conditions. First, we extracted the point of interest (POI) data of residential areas from the Internet and aggregated them into a 100 m long hexagonal cellular network to calculate the number of people and population density, then through the Application Programming Interface (API) of Baidu Map we extracted the travel time between supply and demand points based on actual road conditions. Second, the paper took the park green space built by the end of 2018 in Huangpu District of Shanghai as an example, and considered the four aspects of residents' demand, accessibility classification, cold and hot spots, and blank areas. The results show that the accessibility level of park green space in Huangpu District is higher in the north and lower in the south, which is negatively correlated with the population density distribution. The dominant blind areas (9.16% of the total area) and the recessive blind areas (16.5% of the total area) should be eliminated. This study made a quantitative analysis on the supply and demand allocation, to provide guidance for the further optimization of green space layout and site selection. Finally, recommendations were made from three aspects of "increasing green space appropriately", "strengthening the quality of existing green space" and "community co-governance", in order to provide theoretical support for the Fourteenth Five-Year Plan of greening Huangpu District.
Measures of spatial accessibility to health care in a GIS environment: Synthesis and a case study in the Chicago region
[J].
DOI:10.1068/b29120
URL
[本文引用: 1]
This article synthesizes two GIS-based accessibility measures into one framework, and applies the methods to examining spatial accessibility to primary health care in the Chicago ten-county region. The floating catchment area (FCA) method defines the service area of physicians by a threshold travel time while accounting for the availability of physicians by their surrounded demands. The gravity-based method considers a nearby physician more accessible than a remote one and discounts a physician's availability by a gravity-based potential. The former is a special case of the latter. Based on the 2000 Census and primary care physician data, this research assesses the variation of spatial accessibility to primary care in the Chicago region, and analyzes the sensitivity of results by experimenting with ranges of threshold travel times in the FCA method and travel friction coefficients in the gravity model. The methods may be used to help the US Department of Health and Human Services and state health departments improve designation of Health Professional Shortage Areas.
An improved accessibility-based model to evaluate educational equity: A case study in the city of Wuhan
[J].Limited studies focus on educational equity from the spatial accessibility perspective. This study combines survey data and big data and proposes a multi-mode Huff two-step floating catchment area (MMH2SFCA) method to calculate accessibility while considering multiple travel modes and school attractiveness. This method can also calculate education quality by extending the accessibility in each community. Results show that our proposed method can reliably identify the accessibility differences of schools across communities. The case study indicates an inequitable distribution of educational accessibility and quality. The communities with high accessibility are concentrated in the urban center and exurban zones surrounding schools, whereas high-quality areas are mainly concentrated in the urban center. Correlation analysis suggests that the educational quality of communities with high accessibility is not always high. The findings of this study can provide improvement for accessibility measurements and help explore a new research perspective for educational equity research.
Measuring spatial disparity in accessibility with a multi-mode method based on park green spaces classification in Wuhan, China
[J].DOI:10.1016/j.apgeog.2018.03.014 URL [本文引用: 1]
城市新区教育设施可达性评价与空间优化: 以深圳市坪山区为例
[J].
Accessibility assessment and spatial optimization of educational facilities in newly urbanized areas: A case of Pingshan district, Shenzhen City
Disparities in accessibility of public high schools, in metropolitan Baton Rouge, Louisiana 1990-2010
[J].DOI:10.1080/02723638.2014.936668 URL [本文引用: 2]
改进移动搜索算法的教育资源可达性分析
[J].
Spatial accessibility analysis of education resources by modified floating catchment area methods
移动搜索法在教育公共服务可达性评价中的改进与应用: 以福州城区幼儿园为例
[J].
The improvement and application of two-step floating catchment area method in measuring accessibility to education public service: A case study of kindergartens in Fuzhou
供需平衡视角下城市教育资源空间分布的合理性: 以武汉市为例
[J].
Rationality of the geographical distribution of urban education resources from the perspective of balancing supply and demand: A case study of Wuhan City
基于学籍地址和地理编码的乡村小学教育资源空间可达性分析: 以湖南省株洲县为例
[J].
DOI:10.13249/j.cnki.sgs.2022.06.005
[本文引用: 2]
基于“学籍信息中的家庭地址承载了学生空间位置”这一假设,通过学籍信息收集了湖南省株洲县小学生的家庭地址,借助高德开放平台提供的地理编码和POI搜索服务,获得到了株洲县小学生的空间位置和分布,并基于最短路径分析和高斯型两步移动搜索法分析了株洲县小学教育资源的空间可达性及其特征,尝试为区域教育资源的空间均衡性分析与规划配置提供新的数据源和方法借鉴。结果表明:① 基于学籍地址和地理编码技术能够较准确地获取株洲县小学生的空间分布。② 株洲县小学生就近入学距离的最大值、平均值和中位数分别为11.83 km、2.10 km和1.81 km,就近入学距离小于2.0 km的学生仅占55.46%,为株洲县兼顾公平和效率的教育资源配置工作带来了挑战。③ 株洲县北部城镇地区因学校数量较多,平均就近入学距离较小,教育资源的空间可达性普遍较高,且空间差异小,均衡性好;而东南部的乡村地区,平均就近入学距离较大,教育资源的空间可达性普遍较低,且空间差异大。④ 基于情景分析,在不造成局地生源稳定性问题的前提下,新增3所学校后,东南部地区的平均就近入学距离和教育资源的空间可达性有很大的改善,龙潭镇和龙门镇的平均入学距离由3784 m和3520 m降低到3116 m和2636 m,教育资源的空间可达性分别由0.0492和0.0982提高到0.0762和0.1496。
Spatial accessibility analysis of primary educational resources basedon student home address and geocoding: A case study in Zhuzhou County, Hunan Province
DOI:10.13249/j.cnki.sgs.2022.06.005
[本文引用: 2]
Based on the assumption that a student home address implies a geographic location, this study retrieved the geographic coordinates and spatial distribution of primary school students by using the geocoding APIs provided by AutoNavi Information Technology Co. Ltd after collecting the registered student home addresses in Zhuzhou, Hunan province. Shortest distances through the road network from student home to all schools in the area were calculated based on the Dijkstra algorithm and the spatial accessibility of primary educational resources was assessed by using a two-step floating catchment area method. This study is aiming at providing a new method to obtain the spatial distribution of primary school students and a new viewing angle to assess the spatial equilibrium of educational resources in rural areas. Results show that: 1) the geographic coordinates can be adequately obtained by using registered home addresses and geocoding APIs. 2) The maximum, mean, and medium of shortest distances from student home to their nearest school are 11.83 km, 2.10 km, and 1.81 km in the study area, respectively. Only 55.46% of the shortest distances from student home to their nearest school is less than 2.0 km in the study area, which rises a challenge for achieving a fair and efficient educational resources distribution. 3) In the northern region of the study area, the averaged shortest distance from student home to their nearest school is generally small and the spatial accessibility of primary educational resources is uniformly high because there exist many schools. However, the shortest distances are relatively large and the spatial accessibility is low in the south-eastern region because the number of schools in this region is small. 4) At last, the averaged shortest distance from student home to their nearest school was largely reduced and the spatial educational resources accessibility was highly improved in the south-eastern region of the study area in a scenario of installing three new schools. For example, the averaged shortest distance was reduced from 3784 m and 3520 m to 3116 m and 2636 m, and the spatial accessibility was improved from 0.0492 and 0.0982 to 0.0762 and 0.1496 in Longtan and Longmen, respectively.
人口密度格网尺度适宜性评价方法研究: 以宣州区乡村区域为例
[J].
DOI:10.11821/dlxb201712014
[本文引用: 2]
人口密度格网尺度适宜性研究旨在遴选适宜格网,较好表达人口分布位置,揭示人口分布差异,提高人口数据空间化质量。以安徽省宣州区的乡村区域为研究区,设计了人口密度格网尺度适宜性评价方法,通过构建位置表达度、数值信息表达度和空间关系表达度三类评价指标,开展了人口密度格网尺度适宜性评价研究,结合格网尺度—指标数值关系曲线,确定人口密度适宜格网尺度遴选方案,选取适宜格网尺度,评价了人口密度适宜格网的尺度合理性。结果表明:兼顾位置、数值精度、空间关系三方面的表达度,40 m、50 m格网是一个相对适宜的格网尺度,是生产高质量人口空间数据的适宜格网。初步研究表明,针对本研究区的人口密度格网尺度适宜性评价方案是合理的、有效的,是生产高质量人口空间数据遴选适宜格网的有效方法。
Suitability evaluation of gridded population distribution: A case study in rural area of Xuanzhou District, China
DOI:10.11821/dlxb201712014
[本文引用: 2]
Grid cell is the basic unit to express population distribution based on gridded population data. The choice of suitable grid size is very important, as the resolution must be fine enough to capture the desired spatial variation of population within the area of interest. The research on grid size suitability refers to determinate an appropriate grid size for revealing the population distribution difference and the distribution position for human beings in geographical space. It is important to provide improvement in accuracies of gridded population distribution. However, currently little research has been done in this area. Many well-modeled gridded population dataset are basically built at a single grid scale. If the grid cell size is not appropriate, it will result in spatial information loss or data redundancy. Besides, there is scale dependency in the spatial distribution of population. And the characteristics of population distribution patterns are different at varied grid scales. This study designed a scheme on grid size suitability evaluation method. The rural area of Xuanzhou District in Anhui Province was selected as the study area. The research on grid size suitability was carried out by constructing three kinds of expressed levels, which included location expressed level, numeric information expressed level and spatial relationship expressed level. The scheme on choosing suitable grid size was determined in combination of grid size-indicator value curves. Then the suitable grid size was selected and its rationality was evaluated. Results reveal that comsidering three expressions of location, numeric information and spatial relationship, 40 m and 50 m grids are relatively suitable grid size, which can be recommended as the appropriate scale for generating a high-quality gridded population distribution in the study area. Based on the preliminary study, result also indicates that it is reasonable and effective to assess grid size suitability by the evaluation method in three perspectives of expressed level. It is expected that the method on grid size suitability can make contributions to the advancement of accurate gridded population mapping.
基于景观生态学的人口空间数据适宜格网尺度研究: 以山东省为例
[J].
Grid size suitability of population spatial distribution in Shandong Province based on landscape ecology
乡镇级人口统计数据空间化的格网尺度效应分析: 以义乌市为例
[J].格网尺度效应是统计型人口数据空间化研究的基础性问题之一。针对资源环境研究领域和全球变化区域模型对各种尺度的空间型人口数据的需求,人们对人口数据空间化进行了大量研究。综观现有研究成果,缺乏针对具体应用需求的数据源选择方法和对数据产品适宜性的分析。因此,数据在实际应用中,特别是县市、二、三级流域等尺度上的应用中,存在较多的不确定性。本文重点研究人口数据空间化的格网尺度效应分析方法。以浙江省义乌市为例,利用CBERS、IRS-P5卫星影像,提取了研究区土地利用信息;在地理信息系统技术支持下,对乡镇统计人口进行空间化建模,生成20m至1km系列的格网人口数据;通过比较不同格网人口与乡镇统计人口的误差,分析人口数据空间化的格网尺度效应。分析结果表明,采用CBERS数据源进行人口数据空间化,其数据产品即格网人口的适宜尺度是200m,抽样精度为76%;采用P5数据源进行人口数据空间化,其格网人口的适宜尺度是100m,抽样精度为84%。
The grid scale effect analysis on town leveled population statistical data spatialization
DOI:10.3724/SP.J.1047.2010.00040 URL [本文引用: 1]
高斯两步移动搜索法的模型研究: 以上海市绿地可达性为例
[J].
DOI:10.18306/dlkxjz.2016.08.008
[本文引用: 1]
合理的配置公共服务设施对城市的现代化建设至关重要。空间可达性是度量公共服务设施配置是否合理的方法之一。在诸多的研究方法中,高斯两步移动搜索法由于直观且运算简便,因而得到广泛应用。但该方法也有不足之处,本文运用格网GIS方法,以上海市的绿地空间可达性为例,对两步移动搜索法进行模型方法的改进研究,并对高斯两步移动搜索法和格网化的高斯两步移动搜索法进行对比分析,结果表明:后者可降低空间可达性的误差,提高可达性精度,对上海市绿地空间可达性反映更加真实、客观。如果选择合理的数据将其格网化,该方法也可以用于其他公共服务设施的空间可达性研究。
Improved Gaussian based 2-step floating catchment area method: A case study of green space accessibility in Shanghai
DOI:10.18306/dlkxjz.2016.08.008
[本文引用: 1]
In recent years, urban public service facilities have increased rapidly. Spatial accessibility measurement can be applied to assess the soundness of public service facilities distribution. Among various kinds of methods, the Gaussian based 2-step floating catchment area (2SFCA) method is relatively straightforward, and the greatest strength of the method is that it overcomes the restriction of using only pre-defined regional boundaries. Therefore it is most widely used. However, further research is needed to improve its accuracy. Many recent improvements to the 2-step floating catchment area method generally account for distance-decay within a catchment or enable the usage of variable catchment sizes. In order to improve the method, this study conducted a case study of green space accessibility analysis for the city of Shanghai using the census data of 2000 and 2010 and raster GIS analysis. The result was compared to the original 2-step floating catchment area method output. The results show that the raster Gaussian based 2-step floating catchment area method is a more precise method than the Gaussian based 2-step floating catchment area method for measuring the spatial accessibility to green space. A map of spatial accessibility was developed to show the geographic distribution of spatial accessibility to green space in Shanghai. Spatial accessibility is higher in the peri-urban part as compared to the central part of the city. The raster Gaussian based 2-step floating catchment area method can reduce the error of Kriging spatial interpolation. In the Gaussian based 2-step floating catchment area method the result is expressed as values at the center points of streets and these values are discrete. But in the raster Gaussian based 2-step floating catchment area method the green space accessibility of a point in the space is computed for the grid cell. Thus the raster Gaussian based 2-step floating catchment area method is more precise than the Gaussian based 2-step floating catchment area method. Also, the raster Gaussian based 2-step floating catchment area method calculates the exact number of demand within a catchment. The green space accessibility example is used to demonstrate the advantage of the improved method, but it can also be applied in other urban public service facility studies.
基于空间公正的县域义务教育质量均衡评估指标体系构建
[J].
Construction of systems of evaluation indicators for the balance of compulsory educational quality at county level based on spatial justice theory
面向2035义务教育优质均衡发展指标体系构建: 北京的探索
[J].
An exploration on how to construct an indicator system featuring quality and balanced development of compulsory education in 2035: A case study of Beijing
确定权重的主客观综合法
[J].
The synthetic method of selecting weight
西安城市小学通学出行的时空特征与制约分析
[J].
Spatial-temporal characteristics and constraint of primary school commuting in Xi'an City
我国教育资源配置分析及政策选择: 基于教育基尼系数的测算
[J].
An analysis of China's education resources allocation and its policy choice: Measurement of education based on Gini coefficient
基于多出行模式两步移动搜索法的广州多尺度绿地可达性与公平性研究
[J].
Multi-scale accessibility of green spaces and its equity in Guangzhou based on multi-mode two-step floating catchment area method (M2SFCA)
中国基础教育公共服务均等化空间格局及其影响因素
[J].
DOI:10.11821/dlyj020170219
[本文引用: 1]
基于教育POI设施数据,利用ArcGIS比较统计地图(Cartogram)、核密度分析和探索性空间数据分析(ESDA)等方法对基础教育公共服务均等化空间格局进行研究,并采用地理加权回归(GWR)方法对其格局形成的影响因素进行探究。结果表明:东部和中部地区基础教育公共服务资源数量约占65%,基础教育公共服务的高值区域与城市群所在区域较为吻合,低值区域主要分布于胡焕庸线以西,东西部基础教育资源绝对数量差异明显。学前教育服务人均数量的低值区主要分布在西部,中部也存在部分低值塌陷区,相较于中小学,学前教育公共服务的非均等化问题突出。小学和中学教育公共服务人均数量的高高集聚(H-H)和低低集聚(L-L)区域在东中西地区均有分布,综合而言,地区基础教育公共服务人均数量均等化优于绝对数量的均等化状况。常住人口、第三产业比例、建成区面积是基础教育公共服务均等化空间格局分异的主要影响因素。
Spatial pattern and influencing factors of the equalization of basic education public service in China
DOI:10.11821/dlyj020170219
[本文引用: 1]
With the rapid socio-economic development and the progress of urbanization, the demand for basic education public service is increasing both in rural and urban areas. As a result, the issue of regional and urban-rural non-equalization has become increasingly prominent, which significantly affects the development of the harmonious society. Under this background, the paper discussed the equalization of basic education public service. Based on the POI data of basic education facilities, the spatial pattern and the influencing factors of the equalization of basic education public service in China were studied with the method of ArcGIS spatial statistical analysis functions, such as cartogram, kernel density, geographical weighted regression(GWR) and the exploratory sequential data analysis (ESDA). The results show that the basic education public service of eastern and central China accounts for about 65%, and the high-value regions of the basic education public service are observed in urban agglomerations of China, while the low-value regions are mainly located to the west of the "Hu Line". The low-value regions of the preschool education public service per capita are found in the central and western regions of China. Compared with the elementary and secondary education public service, the non-equalization situation of the preschool public service is more obvious. The high-high concentrated regions, the elementary and secondary education public service per capita highly owned regions, and the low-low concentrated regions are distributed all over the country. In general, the equalization of regional basic education public service per capita is superior to the absolute numbers. The spatial heterogeneity is recognized by geographical weighted regression model. The resident population, tertiary industry proportion, and urban built-up area are the major factors influencing the spatial pattern of the equalization of basic education public service. Education fiscal expenditure, GDP per capita and the fixed asset investment are the secondary driving forces of the spatial pattern of the equalization of basic education public service.
重庆市乡村义务教育资源可得性差异及影响因素
[J].
DOI:10.13284/j.cnki.rddl.003524
[本文引用: 1]
以国家统筹城乡教育发展试验区的重庆市乡村地区为例,采用Densi-Graph城乡识别法进行行政区划内部格网尺度的精准识别,在此基础上探究义务教育资源可得性水平的空间差异及影响因素。结果表明:1)基于Densi-Graph城乡识别法的重庆市城乡差异显著,乡村区域面积达79 752 km<sup>2</sup>,占区域总面积的96.82%。城市部分面积为2 616 km<sup>2</sup>,占区域总面积的3.18%。2)重庆市义务教育资源可得性水平具有显著的空间集聚与关联特征,并呈现由中心城区向外递减的格局。3)政府重视程度、社会经济发展水平、交通设施水平、自然地理环境均与义务教育资源可得性水平具有显著相关性。4)交通站点密度与教育投入是影响义务教育资源可得性水平的主导因子,二者与各项因子的交互叠加作用增强效果显著;影响机制上,地形起伏度与坡度是乡村义务教育资源可得性水平的限制条件,社会经济是基础,交通是关键,教育投入是核心。
Availability differences and influencing factors of rural compulsory education resources in Chongqing
DOI:10.13284/j.cnki.rddl.003524
[本文引用: 1]
Education is the first step toward revitalizing the rural. The rational allocation of rural compulsory education resources is an important means of achieving comprehensive social development and urban-rural integration. This study used the Densi-Graph urban and rural identification method method to accurately identify urban and rural areas at the grid scale within the administrative division. Taking the rural area of Chongqing as an example, based on resource coverage, environmental constraints, and accessibility, this study explored the spatial differences in compulsory education resource availability. A spatial regression model and geographical detector were used to determine the main influencing factors. In order to provide data support and decision-making reference for the availability of rural compulsory education resources and spatial optimization of schools. The results show that the following: First, there is a significant difference between urban and rural areas based on the Densi-Graph urban-rural identification method, with the rural area of Chongqing reaching 79,752 km2, accounting for 96.82% of the total area; the urban area is 2,616 km2, accounting for only 3.18% of the total area, and is concentrated in the central city. There are significant circle layer increasing characteristics in the distribution of rural areas. From the central urban area to the periphery, the proportion of urban areas gradually decrease, and the proportion of rural areas gradually increase. The proportion of rural areas in the central urban area is 80.12%; the area of rural areas in the pioneering development areas of the same city, important strategic pivot cities, and bridgehead cities account for 95.81%, 96.32%, and 97.04%, respectively, which are higher in southeast and northeast Chongqing. Second, the availability of compulsory education resources in Chongqing has obvious spatial agglomeration and spatial correlation characteristics. High-level areas are clustered around the central urban area and scattered in the central area of the townships. Low-level areas are concentrated in backward mountainous areas, such as Chengkou, Wushan, and Pengshui. Specifically, high-level resource coverage areas are in a point-like agglomeration state in northeast and southeast Chongqing. The polarization of accessibility is significant. High-level areas only appear around the central urban area, while low-level areas are widely distributed in the west, northeast, and southeast of Chongqing. The degree of environmental constraint varies with terrain, and the spatial differences are small. A small number of low-level regions are concentrated at the junction of Chengkou, Kaixian, and Wuxi, with large terrain fluctuations. Overall, the availability level of compulsory education resources in rural areas of Chongqing shows a spatial difference pattern of decrease from the urban center to the periphery. Third, the degree of government attention, level of social and economic development, level of transportation facilities, and natural geographical environment are all related to the availability of compulsory education resources, but the degree of influence varies. Location dominance, slope, and topographic relief are negative factors, whereas the remaining factors play a positive role. Fourth, regional socioeconomic development affects the distribution of regional compulsory education resource points and investment in compulsory education, which is the basis for affecting the availability of resources. Public transport routes and traffic site density are key indicators affecting the availability of compulsory education resources, and there is significant interaction between social and economic development and education investment. Guaranteeing investment in education, optimizing the distribution of compulsory education points, and strengthening public transportation are equivalent to providing financial support and government attention. These are at the core of guaranteeing improvement in the level of availability of compulsory education resources in rural areas.
