

重力型空间交互模型(gravity-type spatial interaction models,以下简称重力模型)是分析城际联系的经典模型之一[5],出发地与目的地的属性、两者之间的空间交互成本(常以空间距离表征)被视为影响空间交互的主要变量。起初,学者基于牛顿万有引力定律构建起负幂律重力模型[6],随后Wilson[7]基于熵最大化原理拓展了距离衰减函数(distance-decay function),并提出指数型重力模型。幂函数衰减速度相对较慢,适用于长距离空间交互(如城际联系),而指数型函数衰减速度相对较快,适用于短距离空间交互(如城市内部联系)[5]。重力模型因其良好的解释力和预测力,被广泛应用于城市体系分析[8]、城市交通预测[1]与旅游客运预测[9-10]等领域。
重力模型建构的主要挑战之一是参数估计问题,尤其是距离衰减系数的标定。一方面,空间结构效应可能带来估计偏误,即由于难以捕获起止地可达性等空间结构特征而导致的模型误设(misspecification)[5],学者们已尝试引入目的地竞争模型[11-12]、空间计量模型[13]、空间滤波器[14]等多种方法减少模型误差。另一方面,参数本身可能存在时空异质性,如区域差异导致城际联系距离衰减系数[4]的时空变化。现有研究主要是通过在类线性(对数化)回归模型中补充属性变量(如城市公共服务水平、产业结构等)、加入交互变量或分组估计等方式处理上述问题,但线性假设先天地对识别变量的有效作用程度和范围具有局限,近年来逐渐兴起的基于机器学习的非线性模型可为破解这一问题提供新思路。
基于此,本文提出如下研究问题:城际联系距离衰减系数的非线性规律是怎样的;不同时段和不同交通方式连接下,城际联系距离衰减系数是否具有差异?利用2018年全国尺度的腾讯迁徙大数据,本文首先分析城际联系空间格局特征,挖掘近距离与远距离联系的差异;其次构建梯度提升决策树(gradient boosting decision tree, GBDT)模型改进负幂律重力模型算法,以刻画中国城际联系距离衰减系数的非线性规律;最后,进一步讨论春运期间及不同交通方式下距离衰减系数的异质性,以揭示不同情境下参数分异特征。研究有助于加深对国土空间格局的认识,为都市圈和城市群发展布局优化提供技术支撑。
1 研究数据与方法
1.1 研究数据
本文采用的人口流动数据来源于腾讯位置大数据平台(
本文所采用的城市空气质量与空气污染(PM2.5浓度)数据来源于华盛顿大学圣路易斯分校大气构成分析组的网站,城市常住人口数据来自中经网(
表1 变量描述
Tab.1
| 变量名称 | 含义 | 平均值 | 标准差 | 最小值 | 最大值 |
|---|---|---|---|---|---|
| 城际联系 | 全年城际客运交通联系总和(人次) | 379862.6 | 1547213.0 | 32.0 | 55320000.0 |
| 城际距离 | 城际空间距离(km),基准模型中以城市中心直线距离测度,并补充了 基于路网的距离测度 | 979.9 | 654.2 | 17.2 | 3471.9 |
| 省际边界 | 是否跨越省界(跨越为1,否则为0),测度省际边界效应 | 0.8 | 0.4 | 0.0 | 1.0 |
| 胡焕庸线 | 是否跨越胡焕庸线(跨越为1,否则为0),测度综合地理边界效应 | 0.2 | 0.4 | 0.0 | 1.0 |
| 人口(o/d) | 起点或止点城市常住人口(万人),测度人口规模 | 689.4 | 467.1 | 29.7 | 3163.1 |
| GDP(o/d) | 起点或止点城市GDP(亿元),测度经济规模 | 5578.0 | 6680.0 | 210.0 | 31000.0 |
| 财政(o/d) | 起点或止点城市一般公共预算财政支出(亿元),测度公共服务水平 | 922.9 | 1360.0 | 27.7 | 7500.0 |
| 科技(o/d) | 起点或止点城市科技支出(亿元),测度公共服务水平 | 35.6 | 76.9 | 1.0 | 390.0 |
| 教育(o/d) | 起点或止点城市教育支出(亿元),测度公共服务水平 | 140.5 | 175.1 | 4.1 | 960.0 |
| AQI(o/d) | 起点或止点城市全年平均空气质量,测度环境品质 | 70.5 | 18.4 | 33.5 | 114.1 |
| PM2.5(o/d) | 起点或止点城市全年平均PM2.5,测度环境品质 | 39.8 | 12.4 | 14.1 | 72.3 |
| 产业结构(o/d) | 起点或止点城市第二产业比重,测度产业结构 | 41.9 | 11.0 | 4.0 | 71.3 |
注:o/d表示起/止点。
1.2 研究方法
1.2.1 重力模型及其拓展
为刻画(长距离)城际联系的距离衰减特征,一般选用负幂律重力模型[4],具体表达式为:
式中:Flowij为城市i与城市j之间的城际联系,Pi和 Pj为起点和止点的属性(如城市常住人口规模), Distanceij表示城市i和j之间的空间距离,β为距离衰减系数,k、σ和τ为其他参数。
为了减少遗漏变量造成的估计偏误,部分研究根据出行者的选择偏好,添加了其他起点或止点城市特征变量,包括城市经济特征、公共服务水平、环境品质等影响因素。同时,也有研究在距离因素外进一步关注其他造成空间摩擦的因素,如地理边界等。本文考虑了这些变量,同时,为了分析城际联系的非线性作用,借鉴重力模型的理论逻辑,但不预设线性关系,建立模型:
式中:borderij为边界变量,Si、Sj为除规模以外的其他起点、止点城市特征变量,具体如下:
(1) 核心解释变量是城际距离(Distanceij)。本文以两城市几何中心之间的直线距离来测度[13],一般而言,两城市间空间距离越大,克服空间摩擦所需的交通成本越高,故城际联系会越小。为验证模型稳健性,进一步利用高德地图API服务补充了基于路网的城市距离。
1.2.2 梯度提升决策树(GBDT):相对重要性与偏依赖图
在GBDT模型中,相对重要性是衡量某个变量在提升模型预测能力方面重要程度的指标,以决策树节点分裂次数作为测度,并以提升的残差平方作为加权。相对重要性值越大,该变量在模型中提升预测的能力越强。所有变量的相对重要性加总为100%。
为了增加机器学习方法的解释性,Friedman[25]提出通过偏依赖图可视化的方法,以描述在其他变量保持不变的情况下,某个自变量的变化如何影响因变量的变化。偏依赖分析图打开了机器学习算法的黑箱,揭示了自变量的边际作用,解决了只能预测不能分析的难题。同时,偏依赖图也可进一步拓展,用于讨论交互作用的影响。本文相对重要性与偏依赖图的计算在R语言gbm包中实现。
2 城际联系与距离衰减系数
2.1 城际联系的空间特征
图1较为直观地刻画了城际联系的空间分布特征(为便于可视化,仅提取大于50万人次以上的联系)。首先,中国城际联系总体上呈现以京—沪—广(深)—成为顶点的“钻石型”网络结构,并且其北半部强于南半部(广—成、广—沪的联系相对京—成、京—沪较弱),与此前的研究发现一致[27]。其次,近距离的城际联系规模占比较高,其中500 km以内的城际联系条数仅占27%,规模强度占比却超过85%。京津冀、长三角、珠三角、成渝,以及武汉、西安、郑州等城市—区域内部联系呈放射状。最后,胡焕庸线是中国人口密度的分界线,对城际联系也有一定区分度。胡焕庸线以西的城市密度和规模都较小,西部城市内部联系及其与东部城市的联系都相对较低。2018年,胡焕庸线以东的城际联系规模占比约81%,以西占比约7%,跨越胡焕庸线的城市联系规模占比约12%。
图1

图1
2018年中国城际联系格局
注:本图基于自然资源部标准地图服务网站下载的审图号为GS(2020)4630号的标准地图制作,底图无修改。
Fig.1
Intercity connection in China in 2018
2.2 相对重要性与偏依赖图分析
2.2.1 相对重要性分析
图2
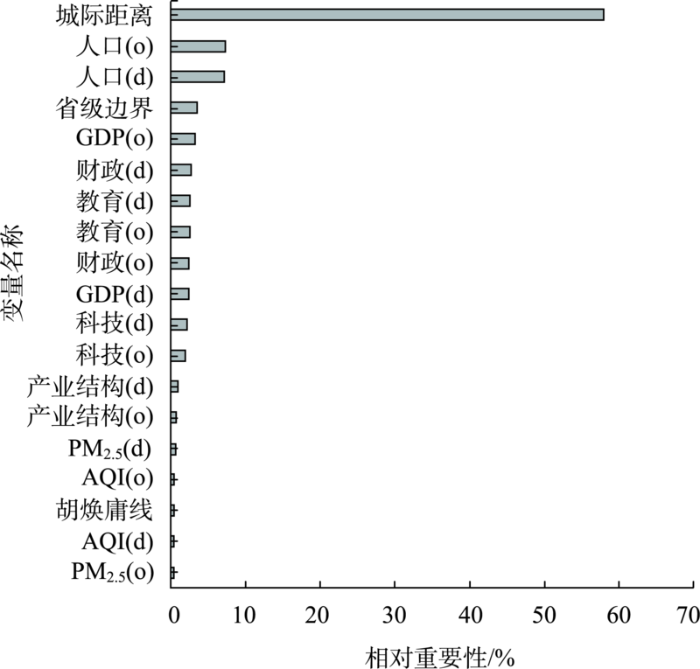
图2
城际联系影响因素的相对重要性分析
Fig.2
Relative importance ranking of intercity connection influencing factors
2.2.2 偏依赖图分析
本文主要关注距离衰减系数的非线性作用,其他变量视作控制变量(限于篇幅,偏依赖图仅给出相对重要性前5位的变量)。为了避免数据缺失可能造成的过度解释,X轴坐标上补充绘制了反映自变量训练集统计分布情况的地毯图。
图3a是距离(对数)与联系强度(对数)的偏依赖图。图中实线和虚线分别基于城际直线和路网距离绘制。直线距离变量在图中存在3个转折点:4.5、6.6、7.4,分别对应于90 km、735 km、1635 km的实际距离。在城际距离小于90 km时,距离增加不带来联系减少(距离衰减系数接近0);城际距离在90~735 km时,距离增加,联系减弱,且基本呈负向的双对数线性关系,距离衰减系数约为2.8;在735~1635 km之间,再次出现距离增减基本不影响联系强弱的情形(距离衰减系数接近0);而在超过1635 km后,距离与联系又呈现负向的对数线性关系,且距离衰减系数与上一阶段基本相同。基于路网的距离变量与直线距离类似,偏依赖图也呈现出2个“平台区”和2个“衰减区”的特征,但是相较于直线距离,曲线发生了右移,这是由于路网距离普遍大于直线距离。
图3
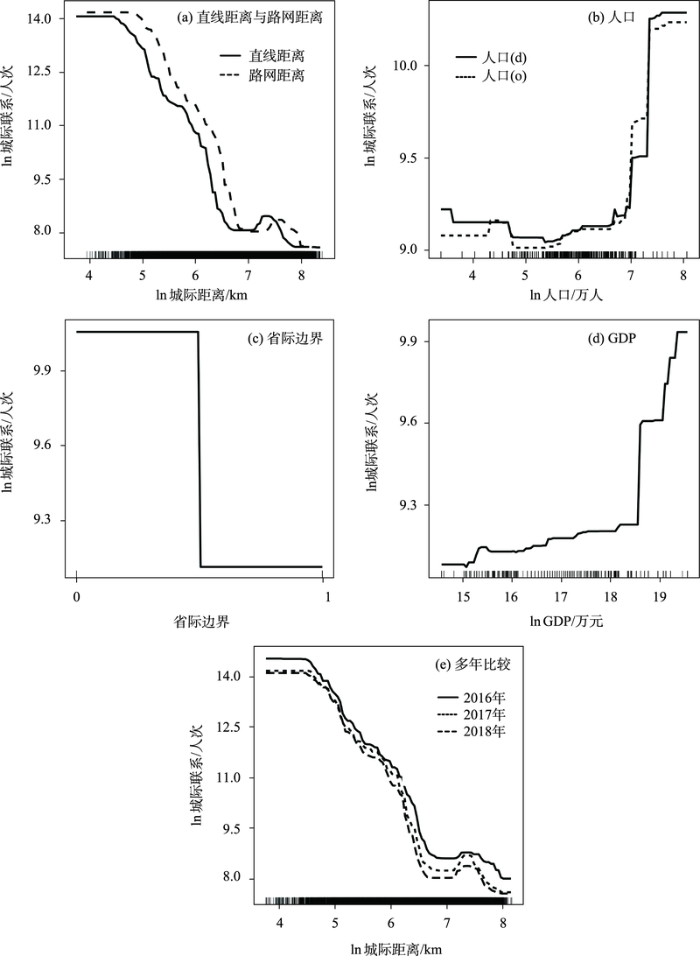
图3
基准模型偏依赖分析图
注:图a、b、d、e的X轴上方为地毯图,反映自变量训练集统计分布情况。下同。
Fig.3
Partial dependence analysis of the benchmark model
为进一步探究结果的稳健性,本文利用2016、2017年数据与2018年基准模型进行比较分析。如图3e,3个年份数据之间差异较小,曲线形状基本一致,主要转折点基本相同,说明距离衰减的非线性特征在2016—2018年间保持稳定。
表2根据图3a中的转折点,提取了不同距离范围内的城市对,发现基本可将90 km、735 km、1635 km等转折点对应于都市圈、省域、跨省(中距离),跨省(长距离)”①( ① 北京到福州的直线距离约为1600 km,到广州约为1900 km。跨省(中距离)与跨省(长距离)尺度大致为以图1钻石结构中的长轴为界。)等不同尺度。都市圈尺度下,广佛、深莞、沪苏等城际联系较为突出,反映了珠三角、长三角地区城市密度大、联系强的特点;省域尺度下,河北(京、津)、广东、浙江等省份城市往来较为密切;跨省(中距离)联系中,京沪、京成、京汉等以北京为端点的联系较为突出;跨省(长距离)联系中,京广、沪成、京深等城市联系是长距离联系的主要代表。
表2 按距离划分的城际联系强度排序(前20位,2018年)
Tab.2
| 排序 | <90 km | 90~735 km | 736~1635 km | >1635 km |
|---|---|---|---|---|
| 1 | 东莞—深圳 | 廊坊—北京 | 北京—成都 | 广州—北京 |
| 2 | 佛山—广州 | 北京—廊坊 | 成都—北京 | 北京—广州 |
| 3 | 广州—佛山 | 保定—北京 | 上海—北京 | 上海—成都 |
| 4 | 深圳—东莞 | 广州—深圳 | 北京—上海 | 深圳—北京 |
| 5 | 苏州—上海 | 深圳—广州 | 北京—武汉 | 北京—深圳 |
| 6 | 上海—苏州 | 北京—保定 | 重庆—上海 | 成都—上海 |
| 7 | 咸阳—西安 | 天津—北京 | 武汉—北京 | 北京—厦门 |
| 8 | 西安—咸阳 | 北京—天津 | 上海—重庆 | 厦门—北京 |
| 9 | 惠州—深圳 | 嘉兴—杭州 | 北京—长沙 | 上海—昆明 |
| 10 | 广州—东莞 | 杭州—嘉兴 | 南京—北京 | 北京—昆明 |
| 11 | 深圳—惠州 | 渭南—西安 | 北京—重庆 | 昆明—上海 |
| 12 | 东莞—广州 | 西安—渭南 | 北京—南京 | 昆明—北京 |
| 13 | 中山—珠海 | 开封—郑州 | 重庆—北京 | 贵阳—北京 |
| 14 | 惠州—东莞 | 杭州—绍兴 | 长沙—北京 | 北京—泉州 |
| 15 | 无锡—苏州 | 绍兴—杭州 | 杭州—北京 | 北京—贵阳 |
| 16 | 苏州—无锡 | 郑州—开封 | 广州—武汉 | 哈尔滨—上海 |
| 17 | 东莞—惠州 | 成都—资阳 | 北京—西安 | 三亚—北京 |
| 18 | 德阳—成都 | 成都—重庆 | 上海—深圳 | 上海—哈尔滨 |
| 19 | 成都—德阳 | 资阳—成都 | 北京—杭州 | 北京—南宁 |
| 20 | 珠海—中山 | 重庆—成都 | 武汉—广州 | 三亚—上海 |
另外,从图3还可以看出其他重要影响因素对城际联系的非线性作用:
(1) 城市人口规模对城际联系的作用呈现阶梯状上升(图3b)。总体而言,控制住其他变量,人口规模越大,城际联系越强,这与重力模型的结果相一致。不同的是,对数化后线性关系不成立,
(3) 经济规模对城际联系的作用呈现阶梯状上升(图3d)。总体而言,经济规模越大,城际联系越强,这是集聚经济效应的表现。第一,远距离、高等级城市间存在基于国家层面的分工合作机制,会产生高强度城际联系,如北京—上海、北京—深圳等。第二,城市经济规模越大,集聚效应越显著,高等级的城市功能可服务更广大的空间范围,也产生享受更远城市服务的需求,故城际联系范围更广,如北京—三亚、北京—贵阳等。第三,中小城市可通过与周边大城市的联系,享受功能外溢效应,如北京—廊坊、成都—德阳、太原—晋中等。
3 距离衰减效应的异质性分析
城际联系的距离衰减系数存在由时间和联系交通方式引发的异质性。例如,赵梓瑜等[4]通过百度迁徙数据分析春节时段逐日数据,发现距离衰减系数在0.7~8.2间波动很大。对距离衰减系数的异质性进行分析,有助于丰富对城际联系动力的认识。本文重点关注:(1) 春节时段距离衰减效应的异质性;(2) 航空、铁路与公路等不同交通方式下城际联系距离衰减效应的异质性。
3.1 春运期间的城际联系
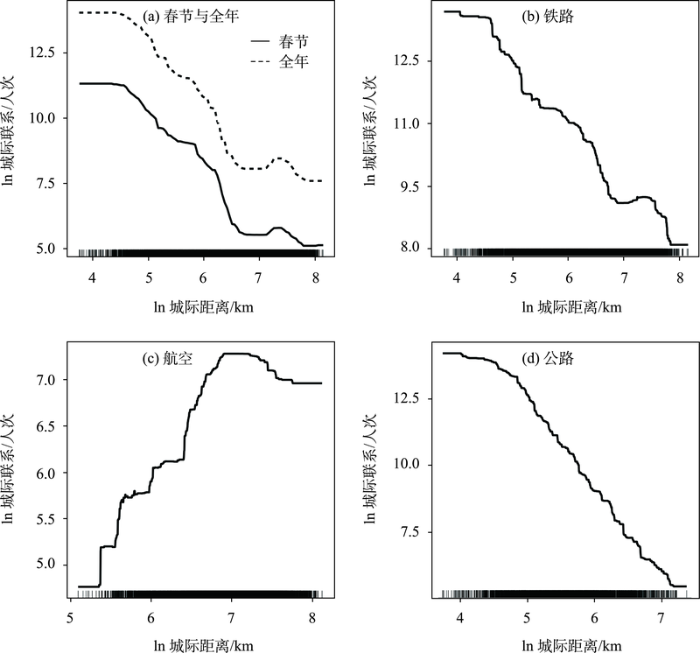
春运期间是中国城乡人口流动较为活跃复杂的时段,既有大量进城务工人员返乡,又因春节长假刺激了旅游活动。本文利用2018年春节前2周的数据(2018年2月1—14日),通过GBDT模型计算偏依赖图,以检验春运时段城际联系的距离衰减效应是否与全年周期存在差异。控制变量与基准模型相同。
图4
3.2 不同交通方式下的城际联系
不同交通方式克服空间摩擦的成本不同,距离衰减系数可能存在差异。尽管已有研究分析了不同交通方式下距离衰减系数的异质性,但是尚缺少对距离衰减系数非线性作用异质性的讨论。本文通过针对航空、铁路、公路交通3种类型分别建立GBDT模型计算偏依赖图,以检验不同交通方式下城际联系距离衰减系数的差异,控制变量与基准模型相同。具体结果在图4b~4d中反映。
(1) 铁路交通(图4b)呈现出与年度基准模型相类似的曲线形状。也呈现出2个“平台区”特征,但是第2个平台转折点在约1100 km和1800 km。在90~1100 km及大于1800 km的范围内,距离衰减系数则约为1.8,小于基准模型(衰减系数为2.8),这说明铁路交通对距离相对不敏感。
(2) 航空交通(图4c)在1100 km距离范围内呈现出与距离衰减律相反的特征,距离增加,城际联系强度增大;但超过1100 km后距离衰减特征不再明显。这表明航空联系的优势在于中长距离,而超长距离联系对空间距离要素的影响不再敏感。
(3) 公路交通(图4d)仅存在1个“平台区”:在90 km以内,距离对城际联系作用接近于0;在超过90 km范围后,城际联系呈幂数型距离衰减,衰减系数约为3.4,大于基准模型(衰减系数为2.8),这表明公路交通对距离更为敏感。
由上可知,3种交通方式下的距离衰减系数存在较为显著的异质性,这与不同交通方式克服空间摩擦的不同边际成本以及相应距离门槛有关。具体而言,航空交通在远距离交通中克服空间摩擦的边际成本最小(距离衰减系数最小),但是距离门槛最大;铁路交通的距离衰减效应介于航空和公路之间,城际铁路联系虽呈现距离衰减规律,但衰减趋势平缓;公路克服空间摩擦的边际成本最大,距离衰减曲线最为陡峭。
4 结论与讨论
4.1 结论
本文基于2018年腾讯迁徙大数据,利用梯度提升决策树模型改进负幂律重力模型,识别城际联系中距离衰减系数的非线性变化规律。主要结论如下:
(1) 城际距离是影响人口城际流动的主要因素之一,其相对重要性远高于人口、GDP、省际边界、公共服务等变量。在全年数据的基准模型中,空间距离对城际联系强度的作用呈现非线性特征,偏依赖图曲线呈现2个“平台区”(距离衰减系数接近于0)和2个“衰减区”(距离衰减系数约为2.8)。在考虑了路网距离和多年数据后,结果保持稳健性。
(2) 航空、铁路及公路交通的距离衰减系数与基准模型相比较存在显著差异。不同交通方式克服空间摩擦的边际成本不同,衰减区的距离衰减系数由高到低分别为公路、铁路与航空。另外,春运期间的距离衰减规律与基准模型基本保持一致,空间距离无论在全年还是春运时段都发挥着类似作用。
4.2 讨论
其二,在政策建议方面,城际联系影响因素分析对于认识都市圈和城市群发展格局具有重要意义。尽管随着技术和经济发展,克服空间摩擦阻力的手段增多,需求增强,但城际距离仍是影响城际联系的重要影响因素之一,且其影响存在明显的非线性特征。因此,在都市圈和城市群发展规划中,需格外重视城际距离及其非线性作用机制,在适当的空间距离范围内科学布局,现有交通技术条件和经济发展水平下,建议都市圈在90 km范围内(直线距离)统筹布局。同时,建议充分考虑都市圈边缘区与中心区的联系距离衰减特征,适度强化区域性交通基础设施投资和建设,尤其可通过铁路建设减少中等距离城际联系的交通阻隔。本文成果有助于丰富城际联系的影响作用特征,为国土空间规划提供技术支撑。
本文存在一定局限性,未来尚需补充完善相关内容。首先,模型中缺少对空间结构效应的讨论,机器学习模型是否需要考虑传统线性模型中由于空间自相关带来的内生性问题,尚需要理论和实证的系统研究。其次,有待开展多维度城际联系(如信息、资本、客运、物流)的对比分析,以推进不同情景下空间交互非线性作用机理的比较研究。最后,城际联系机理研究应与交通等区域性基础设施投资建设的研究相结合[34],以期研究成果得到推广应用。
参考文献
A deep gravity model for mobility flows generation
[J].The movements of individuals within and among cities influence critical aspects of our society, such as well-being, the spreading of epidemics, and the quality of the environment. When information about mobility flows is not available for a particular region of interest, we must rely on mathematical models to generate them. In this work, we propose Deep Gravity, an effective model to generate flow probabilities that exploits many features (e.g., land use, road network, transport, food, health facilities) extracted from voluntary geographic data, and uses deep neural networks to discover non-linear relationships between those features and mobility flows. Our experiments, conducted on mobility flows in England, Italy, and New York State, show that Deep Gravity achieves a significant increase in performance, especially in densely populated regions of interest, with respect to the classic gravity model and models that do not use deep neural networks or geographic data. Deep Gravity has good generalization capability, generating realistic flows also for geographic areas for which there is no data availability for training. Finally, we show how flows generated by Deep Gravity may be explained in terms of the geographic features and highlight crucial differences among the three considered countries interpreting the model's prediction with explainable AI techniques.© 2021. The Author(s).
The effect of human mobility and control measures on the COVID-19 epidemic in China
[J].
DOI:10.1126/science.abb4218
PMID:32213647
[本文引用: 1]

The ongoing coronavirus disease 2019 (COVID-19) outbreak expanded rapidly throughout China. Major behavioral, clinical, and state interventions were undertaken to mitigate the epidemic and prevent the persistence of the virus in human populations in China and worldwide. It remains unclear how these unprecedented interventions, including travel restrictions, affected COVID-19 spread in China. We used real-time mobility data from Wuhan and detailed case data including travel history to elucidate the role of case importation in transmission in cities across China and to ascertain the impact of control measures. Early on, the spatial distribution of COVID-19 cases in China was explained well by human mobility data. After the implementation of control measures, this correlation dropped and growth rates became negative in most locations, although shifts in the demographics of reported cases were still indicative of local chains of transmission outside of Wuhan. This study shows that the drastic control measures implemented in China substantially mitigated the spread of COVID-19.Copyright © 2020 The Authors, some rights reserved; exclusive licensee American Association for the Advancement of Science. No claim to original U.S. Government Works.
Intercity population migration conditioned by city industry structures
[J].DOI:10.1080/24694452.2021.1977110 URL [本文引用: 2]
中国人口省际流动重力模型的参数标定与误差估算
[J].
DOI:10.11821/dlxb201902001
[本文引用: 5]
空间交互模型被广泛应用于地理要素关系强度的模拟,然而目前大量研究或建立在模型参数标定理想化、模式化的假设条件下,或是在暗箱中完成,由此导致模拟结果与实际的偏差却被严重低估。基于2015年中国春运期间人口省际流动的城市间O-D数据,在逐日、分市的研究精度下,实证推算人口流动重力模型变量的回归系数,探究模型代理变量影响效应的空间异质性,并评估重力模型在人口流动模拟上的误差。结果显示:① 重力模型参数标定的复杂性体现在交互对象代理变量影响程度的非对称性,和变量回归系数的空间异质性随研究精度加深显著加剧两个方面,因此模型参数标定的模式化将导致估算结果空间差异的趋势收敛;② 2015年春运期间中国人口省际流动距离衰减系数为1.970,在地级行政单元视角下,人口流出地距离衰减系数值域为0.712(驻马店)~7.699(乌鲁木齐),人口流入地系数值域为0.792(三亚)~8.223(乌鲁木齐);③ 应用重力模型模拟人口流动结果与实测流(百度迁徙数据)存在显著误差。就加权绝对平均误差而言,拟合总误差为85.54%,其中空间相互作用效应造成了86.09%的实测流与模拟流的最大误差,相对流出力、相对吸引力分别造成57.73%、49.34%的模型误差。因此,空间交互效应仍然是当前最难以模式化的因素。
Gravity model coefficient calibration and error estimation: Based on Chinese interprovincial population flow
DOI:10.11821/dlxb201902001
[本文引用: 5]
Simulations based on spatial interaction models have been widely applied to understand the strength of relationships between geographical elements, but many issues remain unclear and deviations between actual and simulated results have often been seriously underestimated. A high-precision Baidu migration process combined with mass relationships is applied in this study and enables the generation of regression coefficients of gravity model based on programmed large-scale regression simulations. A series of accuracy assessments are then developed for 2015 empirical projection daily regression coefficients that can be applied to Chinese spring interprovincial mobile gravity model variables as well as spatiotemporal research that utilizes regression coefficients within a heterogeneity research model. This approach also enables the error within the gravity model to be assessed in terms of floating population simulations. The results of this analysis lead to a number of clear conclusions, including the fact that parameter calibration complexity for the Chinese population mobility gravity model is reflected in the degree of influence asymmetry within spatial object interaction variables, and that the spatial heterogeneity of the variable regression coefficient increases in two distinct fashions. The first of these increases has to do with the overall influence of specific variables, including the fact that differences between proxies tend to be higher than inflow-outflow characteristics. In contrast, the second set of increases is related to economic levels, industrial scales, the proportion of the tertiary industry, and public service facilities. In this latter case, two-way population flow exerts a more profound influence on results and thus the scope of possible explanations for phenomena is more extensive. The regression coefficient for the existence of positive and negative proxy variables therefore relates to differences in spatial heterogeneity, including at the city level, and also assumes that floating population gravity model regression coefficients ignore spatiotemporal changes in the heterogeneity coefficient. This leads to spatial differences in estimated results and thus convergence trends, but further enables the identification of anisotropic interactions in extension space. The second main conclusion of this research is that the national scale population flow distance attenuation coefficient was 1.970 during the spring of 2015, while at the level of prefectural administrative units and given population outflow, the range encapsulated by this coefficient fell between 0.712 (Zhumadian) and 7.699 (Urumqi). Data also reveal a population inflow coefficient of 0.792 for this year that ranged as high as 8.223 in both Sanya and Urumqi. Population flow simulation results using the gravity model and including Baidu migration measured flow data were also subject to significant error. Third, the results of this analysis reveal a total fitting error of 85.54% in weighted absolute mean; the spatial interaction effect within this is responsible for a maximum error of 86.09% in actual and simulated flows, while relative outflow force and attractiveness encompass 57.73% and 49.34% of model error, respectively. These results show that the spatial interaction effect remains most difficult to model in terms of current factors.
The spatial structure debate in spatial interaction modeling: 50 years on
[J].DOI:10.1177/0309132520968134 URL [本文引用: 4]
An historical review of the gravity and potential concepts of human interaction
[J].DOI:10.1080/01944365608979229 URL [本文引用: 1]
A statistical theory of spatial distribution models
[M] //
基于重力模型的中国城市体系空间联系与层域划分
[J].
Study on spatial relations of Chinese urban system: Gravity model approach
DOI:10.11821/yj2008010001
[本文引用: 1]
During the past 50 years, profound changes took place in the field of spatial structure of Chinese urban system. This paper will focus on the spatial relations (including network relations and territorial relations) in the inner urban system, and classify the ranks of spatial combination areas of Chinese urban system with different values of Distance Friction Coefficients b. Concerning Chinese urban system, two major regions (1st grade urban system) and seven sub-regions (2nd grade urban system) have formed, the Southern Major Region centralized with Shanghai and the northern one with Beijing. The Southern Major Region consists of four 2nd grade regional urban systems including the Shanghai System (Shanghai, Jiangsu, Zhejiang, Anhui and Fujian), Wuhan System (Hunan, Hubei and Jiangxi), Guangzhou System (Guangdong, Guangxi and Hainan) and Chongqing System (Chongqing, Sichuan, Yunnan, Guizhou and Tibet). The Northern Major Region consists of three 2nd grade regional urban systems including the Beijing System (Beijing, Tianjin, Hebei, Henan, Shandong, Shanxi, Shaanxi and Mongolia), Shenyang-Harbin System (Liaoning, Jilin and Heilongjiang) and Lanzhou-Urumqi System (Gansu, Ningxia, Qinghai and Xinjiang). Besides, 64 local urban systems (3rd grade) have formed in the Chinese urban system, among which the 3rd Grade Shanghai System covers Wuxi, Ningbo, Hangzhou and Jinhua Systems, and the 3rd Grade Beijing System includes Beijing System and Datong System.
上海迪士尼在建景区客源市场空间结构预测: 旅游引力模型的修正及应用
[J].
DOI:10.11821/dlxb201602010
[本文引用: 1]
客源市场预测是旅游科学决策的关键,由于缺乏历史数据,对尚未开业的旅游景区客源市场预测成为研究的难点.上海迪士尼乐园投资巨大,影响深远,广受关注,开园在即,迫切需要学界从理论层面对其客源市场展开研究.遵循"要素选取--系统分析--模型构建--市场预测--模型验证"的研究思路,对已有旅游引力模型进行修正:① 引入出游意愿,用百度指数进行测度,以明确旅游目的地偏好;② 引入出游率,用旅游人口取代总人口,以界定客源规模基数.而且修正模型中解释变量之间没有显著相关.基于2009-2013年香港迪士尼乐园内地客源市场数据,中国各省市区以及重点城市社会经济数据,运用修正引力模型,预测上海迪士尼乐园国内客源市场空间结构.研究表明:① 迪士尼乐园的强大品牌效应,在一定程度上弱化了空间阻尼的影响,进而导致内地游客对迪士尼乐园的旅游需求整体上缺乏弹性;② 上海迪士尼乐园国内客源市场在空间分布格局上,存在明显的近域指向,东部指向和大中城市指向特征;③ 经过交互验证,用修正引力模型推算的理论值与实际值的吻合程度更高,预测效果更好.
A case study of Shanghai Disneyland on spatial structure forecast for proposed scenic spot market: Modification and its application of gravity model
DOI:10.11821/dlxb201602010
[本文引用: 1]
<p>The market forecast plays a key role in tourism decision-making. However, due to lack of historical data, it remains an unsolved problem for the tourist market forecast of destinations which are not yet open to the public. Shanghai Disneyland has attracted wide attention for its huge investment and profound influence. With its forthcoming development, it is imperative to carry out a theoretical research in this field.</p> <p>The existing tourism gravity model is presented with three main explanatory variables: attractiveness of tourist destination, emissiveness of tourist origin, and spatial damping between the destination and origin. This paper makes modifications on the model as follows: (1) It introduces tourist rate which aims at replacing total population with tourist population to measure the tourist scale and accurately determine its base quota. (2) It introduces the element of tourist willingness, which is measured and estimated by using Baidu Index to clarify the preference for tourism destination. Thus, the scope of applying gravity model is not solely confined within the large and medium-scale tourist destinations (namely, cities, provinces and countries). The modified gravity model can also be applicable to the small-scale tourist destinations (namely, scenic spots). Likewise, it will avoid the interference of intervening opportunity. Furthermore, there is no significant correlation between any two variables in the modified model.</p> <p>Based on statistics of mainland tourists to Hong Kong Disneyland and socioeconomic statistics of China's provinces and municipalities from 2009 to 2013, this paper forecasts the spatial structure of domestic tourist market of Shanghai Disneyland through the modified gravity model. The research shows that: (1) Disneyland's strong brand effect drives tourists to overcome obstacles, so the impact brought about by spatial damping is reduced to some degree; as a whole, tourism demand of mainland tourists for Disneyland is inelastic. (2) The spatial distribution of domestic tourist market of Shanghai Disneyland remains strongly concentrated in neighboring regions accoding to the distance-decay theory. It is also mainly concentrated in eastern region and major cities driven by level of socioeconomic development. Based on the forecast of this paper, the Yangtze River Delta region is expected to account for 71.45% of the domestic market share, and China's eastern region occupies 82.40%, 39 major cities 41.44%. (3) Through verification, the coincident degree between the theoretical value deduced from the modified tourism gravity model and the actual value is better than that between the theoretical value deduced from the existing model and the actual value. Accordingly, the newly modified tourism gravity model proves to be more effective than the existing model.</p>
旅游空间相互作用的引力模型及其应用
[J].
DOI:10.11821/xb201204009
[本文引用: 1]
客源地与目的地之间的旅游空间相互作用是必然而持久地,这深刻地影响着旅游者行为和旅游业进步,需要发展适宜的引力模型对其进行刻画和量度.长期以来,旅游引力模型在对空间阻尼的处理上类比牛顿型的幂函数衰减模式,难以克服一些固有缺陷,因此重新回到威尔逊型的指数函数衰减模式就成为一种可能选择.本文即是基于威尔逊形式,将目的地“吸引力”、客源地“出游力”和两地间的“空间阻尼”作为3 个基本解释变量类型,构建了一个基础的旅游引力模型,并重点在参数估计和模型应用上进行了初步探索.由于难以从整体上对模型的两个核心参数进行回归估计,本文首先从局部对收入弹性系数α进行回归估计,然后通过“口粒子模式法”和“出游量积分法”的引入和交互验证来确定空间阻尼系数β的合理取值.研究表明,就全国平均而言,在21 世纪初收入弹性系数可取0.64,而空间阻尼系数可取0.00322,且在空间阻尼影响下,中国大陆居民国内旅游的理论出游半径均值约为300 km.最后,本文从目的地供给视角计算了中国大陆分省区的旅游吸引力,从客源地需求视角计算了成都市到访游客的分省预期市场份额,这两个案例研究在取得一些有益发现的同时也表明威尔逊型旅游引力模型具有积极的应用潜力,值得进一步探索.
Gravity model for tourism spatial interaction: Basic form, parameter estimation, and applications
DOI:10.11821/xb201204009
[本文引用: 1]
Spatial interaction between tourist origin and destination is a key factor affecting tourist behavior and tourism industry. Usually, such a spatial interaction was described by gravity models. However, tourism gravity models used to adopt power deterrence function to describe the spatial friction effect, which is an analogy with Newton's gravity model, are hard to overcome some inherent defects. Therefore, Wilson's model with exponential deterrence function becomes a possible alternative. Based on Wilson's model, a basic form of tourism gravity model is presented with three main explanatory variables: attractiveness of tourist destination, emissiveness of tourist origin, and spatial damping between the destination and origin.<br> Two coefficients, α (income elasticity) and β (spatial damping) in this model are also need to be evaluated. We used the traditional regression method to estimate the value of α. As to β, two new methods, "population particle pattern method" and "integral method on tourist amount" are used to estimate it. The results show that: 1) α = 0.64 and β = 0.00322 are at the national average level in the 2000s; 2) α becomes larger as the field-pixel becomes smaller. For provincial, municipal, county, and township levels, the values of β are 0.00044, 0.0014, 0.0044 and 0.014, respectively; 3) affected by spatial damping, the average travel radius of domestic residents is about 300 km.<br> By the application of this model, attractiveness of each province of China and provincial tourist market shares of Chengdu city are calculated. The results show that: 1) from 2004 to 2008, the average tourism attraction of Sichuan, Liaoning and Yunnan rank the top three, while Ningxia, Qinghai and Inner Mongolia rank the bottom three; 2) from 1999 to 2008, in terms of tourism attraction at provincial level, Xizang has the biggest increase in the ranking, while Shanghai has the greatest decline in the ranking. 3) The results of theoretical calculation on Chengdu city are in accordance with empirical experiences and sampling data, which demonstrates the applicable potential of the tourism gravity model proposed in this paper.
A new set of spatial-interaction models: The theory of competing destinations
[J].
空间相互作用模型中的目的地竞争效应: 基于中国城市间铁路客流数据的实证研究
[J].
DOI:10.13249/j.cnki.sgs.2017.02.003
[本文引用: 1]
目的地竞争模型是空间相互作用领域的重要进展之一,但其有效性尚未得到一致认可,且缺乏基于中国的实证依据。基于中国2010年城市间铁路客流数据,采用目的地竞争模型进行实证分析,并与传统空间相互作用模型相比较,以检验目的地竞争模型在实际应用中的有效性。结果表明:① 空间结构对中国城市间铁路客流存在显著影响,目的地之间存在较强的竞争效应;② 目的地竞争模型的引入显著地减弱了距离衰减参数的空间自相关程度,较大程度上改善了传统空间相互作用模型的距离衰减参数标定偏误问题;③ 既有研究中在区域尺度下对传统空间相互作用模型(即重力模型)参数的标定及实证分析可能会存在偏误,目的地竞争模型这一改进模型具备应用价值。
Competing effects among destinations in spatial interaction models: An empirical study based on intercity railway passenger data of China
DOI:10.13249/j.cnki.sgs.2017.02.003
[本文引用: 1]
Spatial interaction model is an important research field. Existing studies indicate spatial structure of destinations has a significant impact on spatial flow. Thus, traditional spatial interaction models suffer model misspecification problem because the absence of spatial structure variable. Among the modified models introduced to solve the misspecification problem, the competing destinations model is the most widely-used one.The competing destinations modelassumes that the travelers’ destinations selecting process adopts a hierarchical information processing strategy.Based on this strategy, the spatial decision process is divided into two stages. In the first stage, travelers select a destinations cluster containing a set of destinations; in the second stage, travelers select an individual destination from the cluster selected in the first stage. The competing destinations model has been empirically applied in numerous studies in foreign countries.However, the empirical conclusions with respect to the validity of the competing destinations model are still far from agreement. Moreover, none empirical study of this model has been conductedin China. This study applies the competing destinations model based on intercity railway passenger data in 2010 in China, and test its validity by comparing it with traditional spatial interaction models. The estimations of the competing destinations model as well as the traditional spatial interaction model are conducted by the maximum likelihood method, which is calculated by a new method distinguishing from existing studies, i.e. the Particle Swarm Optimization (PSO) algorithm. The conclusions can be drawn as follows. 1) Spatial structure has a significant impact on intercity railway passenger flow of China, and there exists a significant competing effect among destinations both in the system-wide estimation results and in the origin-specific estimation results. The system-wide distance-decay parameter estimated in the competing destinations model (-1.165) is more negative than in the traditional spatial interaction model (-1.108). In the other hand, 124out of a total number of 177 (the ratio is 70% ) origin-specific distance-decay parameter estimationsare more negative in the competing destinations model than in the traditional spatial interaction model, while 140 out of 177 (79%) origin-specific destinations accessibility indicator estimations are negative in the competing destinations model. These characteristics have not ever been reported in Chinese context in existing studies. 2) The competing destinations model reduces the spatial autocorrelation among distance-decay parameters, thus significantly corrects the misspecification problem of traditional spatial interaction models. These results illustrate that the competing destinations model performs significantly better than the traditional spatial interaction model, and thus the improvements by the competing destinations model are empirically valid in Chinese context. 3) The parameters estimation and empirical analysis of traditional spatial interaction models (i.e. gravity model) in existing literature may be biased, while the competing destinations model is an efficient improvement and can play an important part in empirical analysis.
Modeling spatial autocorrelation in spatial interaction data: An application to patent citation data in the European Union
[J].DOI:10.1111/j.1467-9787.2008.00572.x URL [本文引用: 2]
Error analysis of regional migration modeling
[J].DOI:10.1080/24694452.2016.1197767 URL [本文引用: 3]
Comparing China's urban systems in high-speed railway and airline networks
[J].DOI:10.1016/j.jtrangeo.2018.03.015 URL [本文引用: 2]
Difference of urban development in China from the perspective of passenger transport around Spring Festival
[J].DOI:10.1016/j.apgeog.2017.07.014 URL [本文引用: 2]
Spatial pattern of population mobility among cities in China: Case study of the National Day plus Mid-Autumn Festival based on Tencent migration data
[J].DOI:10.1016/j.cities.2019.05.022 URL [本文引用: 1]
长三角城市群网络特征与省际边界效应: 基于人口流动视角
[J].
DOI:10.11821/dlyj020200563
[本文引用: 1]
构建城市网络化与消除行政边界所导致的阻隔效应是城市群一体化过程中所面临的双重问题。网络视角下,行政边界呈现出何种程度的空间效应是揭示区域演化机制的科学问题。基于人口流动要素构建长三角城市群网络,定量识别城市网络中的省际边界效应问题。研究指出:① 网络密度、平均中心性和平均控制力三项指标一致表明基于人口流动的长三角城市群网络呈现出强联结状态;② 经济规模、政治资源、产业结构、历史基础、就业机会和劳动收益是人口流动网络形成的重要影响因素,而省际边界、跨界频数、时间距离是人口流动网络流向的关键引导因素;③ 基于二次指派程序(QAP)的人口流动影响因素和网络拓扑结构分析共同表明,长三角城市群网络中存在显著的边界效应,且人口流动网络中边界效应表现出明显差异。省际边界在长三角城市群人口流动网络中发挥了融合(沪苏边界上海-苏州段)、过滤(沪浙边界上海-嘉兴段等)、接触(浙皖边界湖州-宣城段等)、阻隔(苏皖边界常州-宣城段等)四种不同的空间效应。论文对于深入理解城市群一体化驱动机制具有理论和现实意义。
Study of network characteristics and inter-provincial boundary effect of the Yangtze River Delta urban agglomeration: From the perspective of population flow
DOI:10.11821/dlyj020200563
[本文引用: 1]
Construction of urban network and the barrier effect (caused by the elimination of administrative borders) are problems in the integration of urban agglomeration. From the perspective of network, the extent of spatial effect indicated by administrative borders reveals the mechanism of regional evolution. This study developed the Yangtze River Delta urban agglomeration network based on the population flow elements, and also quantitatively identified the problems of inter-provincial boundary effects in the urban network. The results showed that: (1) Network density, average centrality, and average control force indicate that the Yangtze River Delta urban agglomeration network shows a strong connection, based on the population flow. (2) Economic situation, political resources, industrial structure, historical basis, employment opportunities, and labor gains are important influencing factors in the formation of a population flow network, while inter-provincial border, cross-border frequency, and temporal distance are key guiding factors of the flow direction of the population flow networks. This conclusion also just proves that the traditional elements group is not able to fully explain the formation and development mechanism of urban network under the background of elements flow efficiently. (3) The analysis of influencing factors of population flow, based on the quadratic assignment procedure (QAP) and network topological structure, showed a significant boundary effect in the Yangtze River Delta urban agglomeration network. Furthermore, the boundary effect of population flow network showed obvious differences. The provincial boundary considers four spatial effects in the Yangtze River Delta urban agglomeration network, including: integration (the Shanghai-Suzhou section on the border between Shanghai and Jiangsu), filtration (e.g. the Shanghai-Jiaxing section on the border between Shanghai and Zhejiang), contact (e.g. the Huzhou-Xuancheng section on the border between Zhejiang and Anhui), and barrier (e.g. the Changzhou-Xuancheng section on the border between Jiangsu and Anhui). This study has theoretical and practical significance for further understanding of the driving mechanisms of urban agglomeration integration.
“流空间”视角下高速公路交通流网络结构特征及其形成机制: 以广东省为例
[J].
DOI:10.11821/dlyj020210050
[本文引用: 1]
交通流是城市经济联系最显性的表现,为更清晰地识别城市网络结构提供了新视角。本研究采用高速公路联网收费数据作为交通流“关系数据”,综合图论、社会网络分析法(SNA)和GIS空间分析,以广东省为研究区域探索高速公路交通流网络空间结构特征,并利用QAP回归法探究影响网络形成的因素。结果表明:① 广东省高速公路已形成典型的网络式空间结构,具有“小世界”网络效应。其节点度值服从幂律无标度分布,交通出入量基本平衡,节点重要性自区域中心向外围递减;网络有向边权值等级差异显著,优势交通流具有“向心指向”特征和距离依赖性。② GDP、常住人口、社会消费品零售总额、县区间行驶距离等已成为影响广东省高速公路交通流网络形成的重要因素。其中人口因素是影响城市间交通流动的主要因素,网络形成受制于距离因素,消费因素逐渐成为刺激城市间交通流动的强大动力。③ 广东省高速公路交通流动模式分为邻近指向型、中心指向型和等级指向型三种,以邻近指向型为典型模式。研究结果对于揭示交通流动规律,丰富城市网络理论,推动道路合理规划和区域协调发展具有重要理论和实践意义。
Spatial structure and formation mechanism of expressway traffic flow network based on space of flows: A case study of Guangdong Province
DOI:10.11821/dlyj020210050
[本文引用: 1]
Traffic flow is the most powerful indicator to map urban economic connections, which provides a new perspective to identify urban network spatial structure clearly. This study uses Guangdong's data to explore the spatial structure of expressway network based on theory of synthesized graph, social network analysis (SNA) and GIS spatial analysis. QAP regression method is used to explore the factors which influence the network characteristics. The results show that: (1) The Guangdong's expressway forms a typical network spatial structure with “small world” network effect. The out-degree and in-degree values of network nodes follow the power law scale-free distribution, traffic volume is basically balanced, and the importance of nodes decreases from regional center to periphery. There are significant differences in the weights of directed edges, and the dominant traffic flows have the characteristics of “centripetal direction” and “distance dependence”. (2) The results of QAP regression show that the character of Guangdong's expressway traffic flow network is significantly affected by GDP, resident population, total retail sales of consumer goods, and the distance. Population is the most powerful factor which affects inter-city traffic flows, the formation of network is restricted by distance, and the consumption factor is gradually becoming a powerful driving force to stimulate the inter-city traffic flows. (3) The traffic flow patterns of expressway in Guangdong are divided into three types, namely, proximity-oriented, central-oriented and hierarchical-oriented. The proximity-oriented traffic flow is typical, which is widely distributed in the province; the central-oriented traffic flow is concentrated in the Pearl River Delta urban agglomeration; and the hierarchical-oriented traffic flow is mainly distributed between Guangzhou and Qingyuan, and between Shenzhen and Shantou. The research results have important theoretical and practical significance for revealing the laws of traffic flow, and enriching urban network theory. Furthermore, it provides theoretical support for scientific road planning and coordinated regional development.
基于腾讯迁徙大数据的中国城市网络研究
[J].
DOI:10.11821/dlxb202104006
[本文引用: 1]
随着经济全球化和区域一体化的快速发展,城市间的交流日益密切,要素的流动性和互赖性促进了城市网络的形成,并成为一种新的区域组织模式和空间结构。本文基于2018年腾讯人口迁徙数据,构建了372×372关系数据矩阵,并从不同交通方式出发,系统刻画了中国城市网络格局。研究表明:① 网络关联度高的城市主要集中在胡焕庸线以东区域,尤其是长三角、珠三角、京津冀、成渝等城市群地区的聚集程度最高,成为中国城市网络格局的主控力量;而西北半壁的城市处于被支配地位。② 依据迁徙量,将中国城市网络划分为国家级、大区级、区域级、地方级和基座级网络。城市网络结构随交通方式而变化,当网络等级下移时,节点城市趋于增多,网络密度加大,但网络范围趋于缩小,网络等级与迁徙路径存在着密切的关联性,国家级网络与空运相关,区域级网络与铁路运输相呼应,地方级网络与汽车运输相关。③ 不同运输方式的经济时空距离决定了网络结构,是引致网络随路径不同而产生分异的基本因素。
China's city network based on Tencent's migration big data
DOI:10.11821/dlxb202104006
[本文引用: 1]
With the rapid development of economic globalization and regional integration, the connection between cities is increasingly close. The mobility and interdependence of elements have promoted the formation of city network and become a new regional organization model and spatial structure. Based on Tencent's migration data, this paper constructs a 372×372 relational data matrix, and systematically depicts the city network pattern in China from different modes of transportation. The results show that cities with high network correlation degree are mainly concentrated in the area east of the Hu Huanyong Line, especially in the Yangtze River Delta, Pearl River Delta, Beijing-Tianjin-Hebei region, Chengdu-Chongqing region and other urban agglomeration areas, which have the highest concentration and become the main control power of China's city network pattern; and the cities in the northwest half are at a disadvantage status. According to the amount of migration, the Chinese city network is divided into national, large regional, regional, local and pedestal networks. The city network structure changes with the mode of transportation. When the network level moves down, the number of node cities tends to increase and the network density increases, but the network range tends to shrink. There is a close correlation between the network level and the migration path. National-level network related to air transportation, regional network related to railway transportation, and local network are relevant to automobile transportation. The economic space-time distance of different transportation modes determines the network structure, which is the basic factor that causes the network to differentiate with different paths.
中国人口流动重力模型回归系数的定量估算及其空间异质性研究
[J].
Quantitative estimation and spatial heterogeneity of the regression coefficient of the population flow gravity model in China
基于GIS的中国2000年人口之分布格局研究: 兼与胡焕庸1935年之研究对比
[J].
A GIS-based study on the population distribution pattern of China in 2000: A comparison with that of Hu Huanyong in 1935
Border effects without borders: What divides Japan's internal trade?
[J].DOI:10.1111/iere.12302 URL [本文引用: 1]
我国城市对科技创新人才的综合吸引力研究: 基于舒适物理论的评价指标体系构建与实证
[J].
Research on the city attraction for science and technology innovation talents: Construction of evaluation indicator system and empirical analysis based on amenities theory
Greedy function approximation: A gradient boosting machine
[J].DOI:10.1214/aos/1013203450 URL [本文引用: 3]
Threshold and moderating effects of land use on metro ridership in Shenzhen: Implications for TOD planning
[J].
“钻石结构”: 试论国家空间战略演进
[J].
The diamond structure: On the evolution of the national spatial strategy
引力模型、边界效应与中国区域间贸易: 基于投入产出数据的实证分析
[J].
Gravity model, border effect and interregional trade in China: Evidence from regional input-output data
中国春运人口省际流动的时空与结构特征
[J].
DOI:10.18306/dlkxjz.2017.08.00
[本文引用: 1]
本文通过构建人口省际流动的关系矩阵,透视2015年中国春节期间人口省际流动的动态过程、网络特征,并对各省人口流入、流出的规模差异进行测度。研究结论如下:①春节前后中国各省每日人口净流入人次存在显著的规律性特征,2月13-17日和2月25日-3月1日为各省节前返乡流和节后返工流期间人口净流入、流出峰值时段,可作为基于春运研究中国人口省际流动的重要依据;②识别了14个人口净流入省、17个人口净流出省,净流入位序前六省和后八省分别吸纳和提供了全国9成人口的集聚与扩散。人口主要流入省的沿海绵延和主要流出省的中部“人口塌陷”共同构成了双纵格局;③各省流出首位流的指向特征显著,南方人口流出省的流出指向存在共性,京津、长三角、珠三角地区的人口集聚路径存在差异。④移动数据为发掘人口流动过程中蕴含的丰富信息提供了平台,基于节后、节前净流入值差值的方法可以有效识别中国人口流动的规模差异、属性特征。通过与以往研究对比,证实了移动数据与基于人口普查数据研究的诸多结论相似性。
Spatiotemporal and structural characteristics of interprovincial population flow during the 2015 Spring Festival travel rush
DOI:10.18306/dlkxjz.2017.08.00
[本文引用: 1]
China is one of the most active areas of the world's population mobility. The social structure of China during the socioeconomic transition period, the country's development phase, and its unique cultural background together form the Spring Festival travel rush, a social behavioral phenomenon with a significant regularity and a high degree of uniformity and unity. By constructing the 2015 Spring Festival interprovincial population flow relation matrix, we examined the dynamics of population flow and its spatial characteristics. The results are as follows: (1) 13-17 February and 25 February-1 March were the peak population flow periods before and after the holiday season. Inflow and outflow of population between provinces during these time periods can be indicative of interprovincial migration of floating population in China. We identified 14 net population inflow provinces and 17 net population outflow provinces. The top six and bottom eight population inflow provinces in the eastern and central regions form the double vertical pattern of immigration and emigration of floating population in China. (2) Provincial population outflow primary directions are clear and flow from the central to the eastern coastal areas is the main direction and path of migration of the floating population. Guangdong and Beijing are the primary migration destinations of the floating population in southern and northern china. These two province/municipality monopolized 2/3 of the interprovincial population flow of the country. (3) The source areas of the floating population in the Beijing and Tianjin area, the Yangtze River Delta, and the Pearl River Delta—the three major population agglomeration areas—are significantly different. Those in the Beijing and Tianjin area and the Pearl River Delta are mainly directly from the floating population emigration provinces, but the Yangtze River Delta has formed a more advanced network structure. (4) Mobility-based study on the temporal and spatial characteristics of China's population flow contains a wealth of information on floating population migration, and the Spring Festival travel rush provides an opportunity for such study. By comparing the result with previous research results, similarity between the new data and many conclusions based on the census data is clear.
重力模型参数空间差异研究: 以中国城市间铁路客流为例
[J].
DOI:10.11820/dlkxjz.2014.12.009
[本文引用: 1]
重力模型是重要的空间相互作用模型,已经在相关研究和实践中得到了广泛应用。在重力模型应用中,结果对参数的敏感性较高,不同的参数设置就可能导致结果体系的巨大差异,故精确的参数是重力模型应用的基础。许多研究关注了重力模型参数的提取,但限于数据等因素,参数在空间上的差异性尚未得到充分的重视。本文采用2010年城市间铁路客运量作为城市间相互作用强度的反映,以城市市辖区居民总可支配收入作为城市的“质量”,刻画城市本身的吸引力,进而通过回归分析考察重力模型的参数结果;并结合地理信息系统的空间插值工具,分析重力模型中各个参数的空间差异并得到可视化结果。相比于既有研究,本文在变量选取中增加了城市间列车交流频次这一变量,与平均运行时间结合共同反映城市之间的“距离”,使模型拟合结果得到较大改进。结果表明,重力模型参数取值在空间上存在显著差异,对不同区域使用统一的重力模型参数可能使结果出现较大偏差,因此将重力模型应用到具体实践中时,不能忽略参数的空间异质性。
Spatial heterogeneity of gravity model parameters: A case study of inter-city railway passenger flow in China
DOI:10.11820/dlkxjz.2014.12.009
[本文引用: 1]
As a useful spatial interaction modeling method, gravity models have been widely applied in geographic research. The results of gravity models are sensitive to model parameters, which may lead to significant variation in modeling results when different sets of parameters are used. Therefore accurate parameters are essential to the application of gravity models. Although there have been various studies on the calibration of gravity model parameters, spatial heterogeneity of model parameters has not been carefully considered due to the lack of necessary data for such analysis. In this study we took the volume of China's railway passengers between city pairs in 2010 as the indicator of the magnitude of spatial interaction between cities. Nodal attraction of cities was depicted by the total disposable income of residents in the city areas, which represents the attraction of a city. Compared to the existing literature, this study modified the basic form of gravity model and introduced frequency of trains as a variable into the model, representing the spatial separation between city pairs along with travel time. This adjustment produced improved goodness-of-fit result. Three parameters in the modified gravity model were tested: nodal attraction, α; travel time, β; and frequency, γ. Spatial heterogeneity of each parameter was analyzed by means of regression analysis and GIS. The results show that β has the largest range, followed by α and γ. The research indicates that remarkable spatial heterogeneity exists and cannot be overlooked. Using a single set of parameters of gravity model for different regions may not be appropriate.
中国交通流的衰减函数模拟及特征
[J].
Function simulation and regularity of distance decay of inter-urban traffic flow in China
DOI:10.11820/dlkxjz.2009.05.006
[本文引用: 1]
<p>Distance is always an important parameter of spatial interaction models in geography and influences the range and depth of many social and economic activities. There is a close and important linkage between traffic flow and distance. So the regularity of distance decay of traffic flow becomes the important research field of transportation geography and economic geography. Based on the review and comment on research progress of distance decay regularity of traffic flow in foreign countries and China, we narrated the studying data and city specimens applied in this paper, and introduced the primary modals of distance decay function, including exponent model, Pareto model, logarithm model, square exponent model and extraction exponent model. Then we simulated the five distance decay model applying inter-urban traffic flow in China, including road passengers flow, railway passengers flow and railway cargo flow, and aviation passengers flow. We discussed the several parameters of their simulating results including distance decay coefficient b, correlation coefficient R and test parameters (namely F and T), especially provided a comparative analysis. According to the analytical result and simulating parameter, we chose the optimal function model of distance decay of traffic flow, namely, Pareto model, and wrote the specific function formulations of the four traffic flow modals. So we further analyzed the parameter difference of four distance decay models and their geographical implication, especially the relation between distance decay coefficient b and the application distance of four traffic flow modals, and their changes about distance decay parameter of temporal inter-urban railway passengers and cargoes flow and their spatial explanation. To provide a further explanation, it is necessary to do so through analyzing the traffic flows and related social-economic index. So we protracted the accumulative ratio curves and distribution ratio curves of four traffic flows, and demonstrated the distance decay model of traffic flow, their parameter and decay regularity which provided an experiential discussion.</p>
建成环境与青少年步行通学的非线性关系: 基于极限梯度提升模型的研究
[J].
DOI:10.18306/dlkxjz.2022.02.006
[本文引用: 1]
步行不仅是一种原始、便捷的交通方式,同时也是体力活动的重要组成部分,对于提升公共健康、改善交通拥堵和减轻污染排放等均有重要的积极意义。然而,包括青少年在内的城市居民步行比例持续下降,体力活动水平日益降低。青少年正处于身心发育的关键时期,体力活动的缺乏将导致肥胖等慢性非传染病,为其将来发展埋下巨大的健康隐患。如何通过对建成环境进行干预,提高青少年步行通学比例,从而提高其体力活动水平,引起了不少学者的关注,取得了较为丰硕的研究成果。然而,既有研究存在以下不足:第一,大部分已有研究以西方城市为案例,很少研究关注中国城市;第二,绝大部分既有研究基于线性或广义线性的假设考察建成环境对步行通学的影响,很少研究关注两者之间的非线性关系。鉴于此,论文以厦门岛为案例,基于极限梯度提升模型,考察青少年家和学校建成环境对其步行通学的影响。研究发现:① 通学距离是影响青少年步行通学最重要的因素,其相对贡献接近4成(39.99%);② 建成环境(以5Ds模型表征)作用显著,家、校建成环境相对贡献合计达36.28%,超过社会经济属性(23.73%),离市中心的距离和道路交叉口密度等变量具有重要作用;③ 全部建成环境变量和主要社会经济属性变量均与青少年步行上学存在非线性关系,且存在明显的阈值效应。研究为城市决策者关于提高青少年步行通学倾向提供了丰富的政策启示。
Non-linear relationships between the built environment and walking to school: Applying extreme gradient boosting method
DOI:10.18306/dlkxjz.2022.02.006
[本文引用: 1]
Walking is not only a primitive and convenient transport mode but also an important integrant of physical activity, which is beneficial for the promotion of public health, alleviation of traffic congestion, and mitigation of transportation-induced pollution. In modern China, cities are expanding rapidly, people are enjoying a dramatic improvement in living standards, and the pace of life is accelerating. As a result, urban people, including adolescents, tend to travel in motorized modes increasingly more and walk less. The prevalence of physical inactivity among adolescents has brought about a series of health issues, such as deterioration of physical fitness, obesity, and some non-communicable diseases (for example, diabetes and hypertension). Travel to school is among the most important routine travels for adolescents. Promoting adolescents' propensity of walking to school can effectively help them integrate physical activity into daily life and thus enhance their overall physical activity level. Hence, scholars from diverse disciplines (for example, geography, urban planning, and public health) have been drawn to examine the relationships between the built environment and walking to school. However, the current research is insufficient in the following two aspects. First, the existing research is mainly based on the Western context, whereas few studies have been conducted in China. Second, the majority of existing studies assumed a linear or generalized linear (for example, log-linear) relationship between the built environment and walking to school, and no studies, to the best of our knowledge, have examined the non-linear relationships between them. Therefore, this study, taking Xiamen, China as the case and employing its large-scale travel behavior survey dataset in 2015, explored the non-linear effects of the built environment on adolescents' propensity of walking to school. We applied a state-of-the-art machine learning method, namely extreme gradient boosting method (XGBoost), to fit the model, and interpreted the model with relative importance and partial dependence plots. The results show that: 1) Distance from home to school is the most important factor influencing walking to school, with the relative importance of 39.99%. 2) The built environment, which is characterized by the 5Ds (density, diversity, design, destination accessibility, and distance to transit) model, is an important contributor, and relative contributions of the built environment variables at home and school collectively contributed 36.28% of the model's explanatory power, only second to distance to school, much higher than that of sociodemographic variables (23.73%). Distance to city center and population density around both home and school contribute a great deal. 3) All the built environment variables at both ends of school trips and the key sociodemographic variables have non-linear effects on adolescents' propensity of walking to school, and there exist obvious threshold effects. This study can inform decision makers with nuanced policy insights for promoting adolescents' behavior of walking to school.
建成环境对居民通勤方式选择的影响: 以武汉市城中村为例
[J].
DOI:10.18306/dlkxjz.2021.12.006
[本文引用: 1]
城中村作为带着农民特色和阶级混杂重塑的空间,为弱势劳动群体融入城市化体系、实现反资本而不反市场的城镇化进程提供了保障。探讨建成环境对居民通勤方式选择的影响机制,开展城中村建成环境改造,对于解决弱势群体通勤和就业困难意义重大。论文基于武汉市2018年LBS(Location Based Services)数据,以公共交通通勤方式选择作为二元分类因变量,采用梯度提升决策树(gradient boosting decision tree,GBDT)分析建成环境与城中村居民通勤方式选择的非线性关系与阈值效应,结果显示:普遍长距离通勤的城中村居民对公共交通系统依赖性强,建成环境的非线性影响和阈值效应明显,弥补了传统线性模型在可解释性上的不足;其中公交站可达性预测贡献度最大(19.89%),阈值分别在300 m和1000 m左右,在城中村改造时应尽量满足直线距离300 m公交站点可达,保证1000 m内存在公交线路,其余变量也有相似的可解释性。研究得到的建成环境影响的优先层次和最有效的空间属性范围将为提升城中村居民就业和通勤公平,实现区域包容、协调的城镇化提供参考。
Impact of the built environment on residents' commuting mode choices: A case study of urban village in Wuhan City
DOI:10.18306/dlkxjz.2021.12.006
[本文引用: 1]
As a space with farmers' characteristics and reshaped by mixed classes, urban villages provide a guarantee for the vulnerable groups to integrate into the urbanization system and realize the anti-capital but not anti-market urbanization process. Exploring the impact mechanism of the built environment on residents' commuting mode choices and carrying out inclusive renovation of the built environment of urban villages will be of great significance for addressing the commuting and employment difficulties of vulnerable groups. Based on the location based services (LBS) data of Wuhan City in 2018 and taking the choice of commuting mode as binary dependent variable, this study used the gradient boosting decision tree to explore the nonlinear relationship between the built environment and commuting mode choices of urban village residents and threshold effect. The results show that the residents of urban villages who commute for a long distance generally depend on the public transport system, and the nonlinear influence and threshold effect of the built environment are obvious, which make up for the insufficient interpretability of the traditional linear model. The contribution of bus station accessibility is the largest (19.89%) in prediction, and the thresholds are about 300 m and 1000 m respectively. In urban village reconstruction, bus station within a Euclidean distance of 300 m should be satisfied as far as possible, there must be bus lines within 1000 m, and other variables have similar interpretability. The impact priority level and the most effective spatial attribute range of the built environment obtained from this study will provide a reference for improving the employment and commuting equity of urban village residents and for realizing regional inclusive and coordinated urbanization.
城市市政基础设施投资与经济发展的空间交互影响
[J].
Spatial mutual effects between municipal infrastructure investment and economic development
