

改革开放以来,中国经济迅速发展,人民生活水平显著提高。但是粗放型经济发展方式致使环境污染问题持续突出,中国经济社会的可持续发展受到严峻挑战。根据《2019年中国生态环境状况公报》,全国超过一半的城市空气污染浓度超标,以PM2.5为首要污染物的天数占严重、重度污染天数的78.8%。中国的空气污染问题,尤其是PM2.5污染问题严峻。据估算,中国每年可归因于PM2.5污染的死亡人数到2017年已增加至97.1万[1]。空气污染导致的健康风险和危害已成为社会关注的公共话题。中国生态文明建设强调“解决损害群众健康突出环境问题”,国家“十四五”规划和2035年远景目标纲要重视建立“公众健康影响评估制度”。因此,揭示空气污染,尤其是PM2.5污染对居民健康的影响,对于评估空气污染的健康风险和促进健康人居环境建设具有现实意义。
近年来,空气污染对健康的影响研究受到医学、环境科学、地理学等领域学者的关注,环境健康风险评估是健康地理学的重要议题[2]。与其他大气颗粒物相比,PM2.5存在更大的健康风险和危害[3],PM2.5粒径小、表面积大,易携带空气中的毒害成分被吸入肺部,引发肺部炎症或参与全身血液循环[4],影响人体呼吸系统和心血管健康。环境流行病学领域对PM2.5暴露—反应关系的研究比较成熟,运用队列研究[5]、时间序列[6-7]和病例交叉[8]等方法,评估PM2.5污染造成的各类疾病负担、对死亡和预期寿命的影响等,其中死亡率是评估居民PM2.5健康风险的重要指标。发达国家和地区从PM2.5的暴露浓度、暴露时间进行研究,发现高浓度PM2.5显著提高地区死亡率[9]和心血管等特定疾病死亡率[5];长期暴露于低浓度PM2.5环境也会显著提高死亡风险[10]。然而中国PM2.5的暴露水平、化学成分和毒性特征与发达国家明显不同,西方发达国家的研究结论不能完全用于评估中国PM2.5污染对健康的影响[11]。流行病学领域的研究成果已经证实PM2.5污染显著提高中国居民的死亡风险[12]。从地理学角度出发,学者们基于省级行政单元[13]、城市[14]、县级[15]等地理尺度研究PM2.5对人口死亡率的影响。健康地理研究表明,PM2.5对中国居民的健康影响存在空间相关性和空间分异性[16]。
既有研究表明,影响中国人口死亡率的因素还包括人口结构、社会文化程度、城镇化水平、经济增长和经济结构、医疗卫生、自然环境等方面。在人口结构方面,健康脆弱群体(如少年儿童、老年人)的比重越高,地区人口死亡率越高[17]。地区居民受教育程度的提高有利于提高健康素养和改善个人生活习惯,进而改善健康状况[18]。在城镇化水平上,一方面,城镇化的快速发展带来的交通拥挤、居民生活压力大等的问题损害居民健康,使得死亡率上升[19];另一方面,城镇化发展使得医疗卫生资源配套更加完善,居民生活水平提高,从而降低人口死亡率[20]。城市经济发展(如人均GDP或居民收入的提高)改善居民生活水平、拓宽健康信息的获取渠道,进而降低人口死亡率[18,21-22]。在经济结构方面,经济结构优化减少了工业污染的排出,改善居民生活环境和健康状况[23]。不利的自然环境(如高温、寒冷)提高心脑血管或呼吸系统等疾病的发病率和死亡率[24],而有利的自然环境(如蓝绿空间)通过减轻环境危害、缓解压力和为社会交往提供场所3种途径促进人体健康,降低人口死亡风险[25]。
基于空气污染和社会因素对健康的共同影响,健康、社会和环境不平等“三重危险”引起学者们的探讨[26]。空气污染暴露的健康影响群体差异和环境公正研究是健康地理学的研究热点[27]。学者们关注环境公正和基于社会经济发展差距造成的产品、服务分配、污染暴露等分布不均引起的健康不平等问题[28⇓⇓-31]。PM2.5与人口死亡风险的关系研究重点关注婴幼儿[32]、孕产妇[33]、老年人[34]等弱势群体。中国PM2.5对人口健康的影响在不同城市类型[35]、城乡之间[36]均存在显著的差异。其他大气污染物和社会经济因素的交互作用对居民健康影响的研究较为成熟,但PM2.5作为对人体健康危害最严重的大气污染物[37],目前关于PM2.5和社会经济因素的交互作用对人口死亡率影响的研究较少。空气污染对社会经济地位较低的弱势群体的健康影响更为严重,低收入水平、低学历人群等更容易暴露在较高空气污染环境,并且具有较差的健康状况[38]。当环境污染与健康、社会经济因素和不平等问题相互影响时,极有可能陷入“环境健康贫困陷阱”,导致污染暴露—健康危害的恶性循环[39]。社会经济因素可以调节空气污染—健康的关系,中国城镇化发展使得医疗卫生资源配套更完善,提供改善居民健康的机会,有效调节空气污染对健康的影响[20,40]。经济结构优化降低居民的空气污染暴露度,减少了归因于PM2.5污染的过早死亡人数[41]。高收入[42]、高学历[43]人群有更高的环境支付意愿和更高效的污染暴露规避措施,显著降低大气污染导致的健康危害。
总结现有研究发现,中国学者基于不同的研究区域、研究尺度、研究角度对中国PM2.5污染与人口死亡的关系进行了大量研究。但是目前中国PM2.5污染与死亡指标的关系主要基于横断面数据进行研究,研究尺度集中于省级行政单元或地市级尺度。在研究区域上,全国范围的研究主要围绕省级尺度进行,地市级、县区、乡镇街道尺度的研究多局限于部分区域,尤其是发达地区。研究方法以环境流行病学的研究范式为主,缺少社会经济因素对PM2.5暴露—人口死亡关系的影响探讨。同时,PM2.5污染并不是局部环境问题,可通过大气环流等扩散至邻近地区[44],具有较强的空间传递性[45],当前大部分研究缺少考虑PM2.5的空间溢出效应[46]。基于此,本文使用探索性空间数据分析方法刻画中国城市人口死亡率的时空变化特征,并运用空间回归方法揭示城市PM2.5浓度对人口死亡率的影响及其空间溢出效应,以及社会经济因素对PM2.5—人口死亡率关联的调节效应,以期为环境污染风险评估和健康人居环境建设提供科学依据。
1 研究区域、数据与方法
1.1 研究区域
本文的研究区域包括全国31个省(自治区、直辖市)范围内的346个地级及以上行政单元(包括4个直辖市、地级及以上城市、自治州、盟以及部分省直辖行政区域),不包括香港、澳门和台湾地区。由于2000—2015年部分城市行政区划发生调整变动,本文将2000、2005、2010年的行政区划按照2015年标准进行归并统一,确保4个年份节点研究单元的行政边界一致。
1.2 数据说明
由于2020年中国城市人口普查资料和收录2020年中国城市社会经济发展情况的统计资料尚未公开发布,本文研究年份选择2000、2005、2010和2015年。区域居民的健康水平通常使用人群健康水平的相对指标或平均指标进行度量[13]。本文的被解释变量为人口死亡率,用以表征城市居民健康水平,即地区一段时间内死亡人数与该时期总人数的比率。模型的核心解释变量为当年PM2.5浓度,基于PM2.5的健康影响存在时间滞后效应,本文在稳健性分析部分以3年PM2.5均值替代当年PM2.5浓度进行模型验证;中国《环境空气质量标准》(GB3095—2012)规定中国PM2.5准则值年均值为35 μg/m3,本文的稳健性分析部分将当年PM2.5浓度处理为二分类变量,将当年PM2.5浓度≥35 μg/m3的数值定义为1,否则为0,模型中该变量以pm_35表示。控制变量主要从人口结构、社会文化程度、城镇化水平、经济增长与经济结构、医疗卫生和自然环境等6个方面影响人口死亡率的因素中进行选择,选择60岁及以上老年人口比重和0~14岁少儿人口比重反映地区脆弱群体占比;大专及以上学历人口比重反映地区社会文化发展水平;城镇化水平以城镇化率表示;人均GDP表征地区经济发展水平,模型中将人均GDP进行对数变换;第二、三产业比重表征地区经济结构;每万人拥有医生数表征地区医疗卫生资源配置情况;年平均温度、年相对湿度和NDVI平均值反映自然环境因素对人口死亡率的影响。
变量的数据来源如下:① 人口死亡率等人口统计指标主要来源于2000年和2010年人口普查资料、各省级行政单元2005年和2015年1%人口抽样调查资料。由于内蒙古自治区、湖北省、湖南省、吉林省尚未发布2005年《1%人口抽样调查资料》,内蒙古自治区、安徽省、山东省、四川省、西藏自治区尚未发布2015年《1%人口抽样调查资料》,缺失数据的城市通过《国民经济和社会发展统计公报》或省级数据表征城市的平均水平进行数据补齐。② PM2.5数据来源于分辨率为1 km的全球年度PM2.5浓度网格数据集[47]。在该数据集的基础上,计算处理得到城市当年PM2.5浓度,1998—2000、2003—2005、2008—2010、2013—2015年各3年PM2.5浓度均值。将PM2.5浓度(μg/m3)代入模型后,估计系数至少需要读取至小数点后第三位,难以直观比较PM2.5对人口死亡率的影响及其空间溢出效应,故本文对模型当年PM2.5浓度和3年PM2.5均值指标调整量纲,将PM2.5数据同时乘以100代入模型。③ 人均GDP、第二、三产业比重数据来源于《中国城市统计年鉴》和各城市统计年鉴;温度、相对湿度数据来源于中国气象数据网(
各变量的描述性统计结果如表1所示。
表1 变量描述性统计
Tab.1
| 变量名 | 符号 | 2000年 平均值(标准差) | 2005年 平均值(标准差) | 2010年 平均值(标准差) | 2015年 平均值(标准差) |
|---|---|---|---|---|---|
| 人口死亡率/‰ | mortality | 5.83 (1.13) | 5.96 (1.46) | 5.56 (1.31) | 5.04 (1.28) |
| 当年PM2.5/(μg/m3) | pm | 20.78 (11.95) | 33.17 (17.07) | 33.59 (18.15) | 33.23 (19.21) |
| 3年PM2.5均值/(μg/m3) | pm3 | 20.96 (10.60) | 30.56 (15.68) | 33.65 (17.76) | 33.39 (18.24) |
| 老年人口比重/% | older | 9.92 (1.90) | 12.23 (2.68) | 12.89 (2.81) | 15.61 (3.93) |
| 少儿人口比重/% | child | 23.73 (4.97) | 20.33 (4.87) | 17.31 (4.68) | 17.67 (6.10) |
| 大专及以上学历人口比重/% | edu | 3.34 (2.59) | 4.89 (3.58) | 7.76 (4.72) | 10.49 (6.17) |
| 城镇化率/% | urban | 36.94 (18.80) | 43.31 (18.24) | 47.58 (17.23) | 52.86 (14.91) |
| 人口密度/(人/km2) | pop | 343.12 (329.44) | 356.93 (333.02) | 369.66 (331.49) | 385.15 (357.95) |
| 人均GDP/元 | pgdp | 7742.18 (6598.64) | 14529.42 (11736.97) | 30832.91 (21342.19) | 48702.67 (28559.05) |
| 第二产业比重/% | secindust | 40.60 (12.99) | 44.27 (13.23) | 49.35 (11.90) | 45.40 (10.39) |
| 第三产业比重/% | terindust | 35.56 (7.48) | 37.04 (8.90) | 36.01 (9.11) | 41.46 (8.76) |
| 每万人医生数/(位/万人) | doctor | 15.21 (10.32) | 15.55 (7.26) | 18.30 (9.44) | 21.40 (10.67) |
| 年平均相对湿度/% | rh | 69.27 (10.37) | 66.08 (9.73) | 67.02 (10.03) | 68.56 (11.36) |
| 年平均温度/℃ | temp | 13.23 (5.62) | 13.30 (5.59) | 13.35 (5.64) | 13.88 (5.44) |
| NDVI | ndvi | 0.41(0.14) | 0.40 (0.13) | 0.41 (0.14) | 0.44 (0.15) |
1.3 研究方法
1.3.1 探索性空间分析方法
(1) 全局空间自相关
全局空间自相关用于度量数据的整体空间关联程度,本文采用全局Moran's I衡量地区人口死亡率的空间相关性,计算公式为:
式中:
(2) 局部空间自相关
局部空间自相关度量具体空间单元数据与其邻近空间单元数据之间的关联程度[50],计算公式为:
式中:${{S}^{2}}=\frac{1}{n-1}{{\sum\nolimits_{j=1}^{n}{({{y}_{j}}-\bar{y})}}^{2}}$。
1.3.2 空间回归分析
拉格朗日乘数检验、LM-Error和LM-Lag的检验结果均显著,表明本文应考虑空间因素,选用空间面板回归模型探讨PM2.5对城市人口死亡率的影响。空间面板回归模型主要包括空间滞后模型(spatial lag model, SLM)和空间误差模型(spatial error model, SEM),空间杜宾模型(spatial Durbin model, SDM)是空间滞后模型和空间误差模型的结合。基于检验结果和Log Likelihood值,应选用SLM模型和SEM模型,其中SLM模型的拟合度更优。SLM模型用于研究地区人口死亡率与相邻地区人口死亡率的空间交互关系,将自变量对因变量的影响分解为直接效应、间接效应和总效应[51]。其中,直接效应反映自变量变化对本地区因变量的平均影响;间接效应反映本地区自变量的变化对邻近地区因变量的平均影响,即空间溢出效应;而总效应衡量自变量对本地区和邻近地区因变量的平均影响[52]。空间滞后模型公式如下:
式中:
运用调节效应分析技术,引入当年PM2.5浓度与社会经济变量的交互项,识别不同社会经济阶层的空气污染暴露风险差异,揭示2000—2015年中国346个城市的“环境健康贫困”问题。调节效应计算公式如下:
式中:
2 中国城市人口死亡率的空间格局及时间变化
2.1 人口死亡率的空间分布特征及变化
为直观反映人口死亡率的时空分布特征,本文采用分位数法将每年人口死亡率从小到大排列分为5个等级,分别为低死亡率地区(当年死亡率排名前20%)、较低死亡率地区(当年死亡率排名前20%~40%)、中等死亡率地区(当年死亡率排名前40%~60%)、较高死亡率地区(当年死亡率排名前60%~80%)和高死亡率地区(当年死亡率排名80%~100%),绘制2000—2015年中国人口死亡率的空间分布图,以总结中国城市人口死亡率空间差异的变化趋势(图1)。
图1
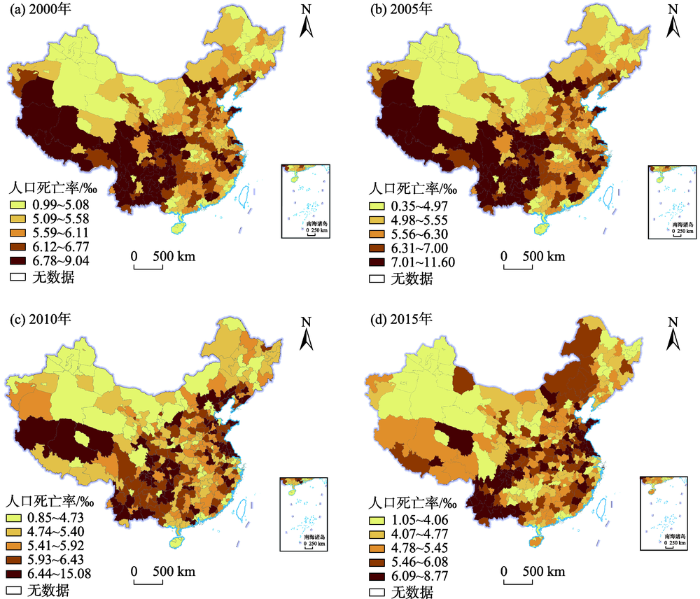
图1
2000—2015年中国人口总死亡率空间分布
注:本图基于自然资源部标准地图服务网站下载的审图号为GS(2020)4632号的标准地图制作,底图无修改,下同。
Fig.1
Spatial distribution of mortality rates in China during 2000-2015
2000—2015年,低死亡率和较低死亡率地区长期集中分布于西北地区、东北地区、长三角地区、珠三角地区和京津两市,高死亡率和较高死亡率地区由连片分布于西南地区逐渐向东扩展分布。人口死亡率的主要时空分布特征变化为:2000年,中国人口死亡率整体呈现北低南高的空间分布格局,高死亡率和较高死亡率地区连片分布于西南地区,零星分布于华北地区、华东地区;2005年,高死亡率和较高死亡率地区向东扩展,连片分布于西南地区和华中地区,零星分布于东部沿海地区;至2010年,人口死亡率分布格局发生较大变化,呈现零散分布的格局,分布于西南地区的高死亡率地区数量明显减少,高死亡率和较高死亡率地区在华北、华东地区的集聚趋势明显;2015年,高死亡率和较高死亡率地区集中分布在西南地区、华东地区和华中地区,低死亡率和较低死亡率地区趋向零散分布。
2.2 人口死亡率的空间集聚特征及变化
2000—2015年人口死亡率的全局Moran's I指数分别为0.25、0.21、0.19、0.26,均显著拒绝原假设,表明中国人口死亡率分布存在显著的空间依赖性。LISA散点图(图2)直观反映出中国城市人口死亡率的局部空间分布特征。2000—2015年,低—高类型地区数量增多且呈现零星分布特征;高—低类型地区呈现零散分布特征,粤东北—赣南地区以及粤西地区持续为人口死亡率高—低类型地区;低—低类型地区长期分布于北疆、内蒙古西部、粤西和珠三角地区;2000—2015年,人口死亡率高—高类型地区数量显著增加,2000—2005年高—高类型地区集中于西南地区,2010—2015年连片分布于西南地区和华东地区。总体而言,2000—2015年人口死亡率高—高类型地区早期集中在西南地区,而后向华东地区的山东半岛、苏北地区、苏鲁豫皖交界地区延伸,低—低类型地区长期集中在北疆、内蒙古西部和广东省及周边地区。
图2
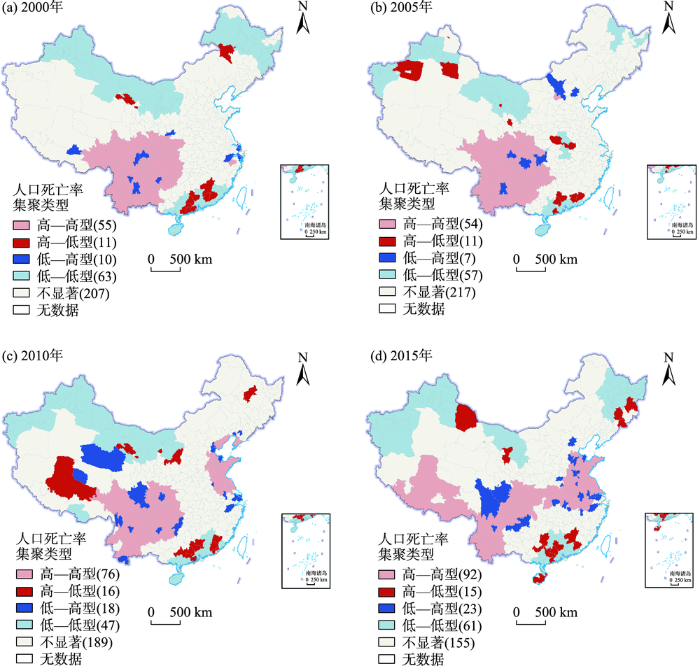
图2
2000—2015年中国人口死亡率的LISA地图
注:图例括号中数字为该类型城市数。
Fig.2
LISA map of mortality rates in China during 2000-2015
3 结果与分析
3.1 PM2.5污染对人口死亡率的影响分析
以当年PM2.5浓度为核心解释变量,运用空间滞后模型进行统计建模,识别PM2.5对人口死亡率的影响。如表2所示,空间滞后系数
表2 空间滞后回归模型估计结果
Tab.2
| 变量 | 模型1: SLM 估计系数(标准差) | 直接效应 估计系数(标准差) | 间接效应 估计系数(标准差) | 总效应 估计系数(标准差) |
|---|---|---|---|---|
| pm | 0.906** (0.379) | 0.937** (0.396) | 0.364** (0.161) | 1.301** (0.547) |
| older | 0.060*** (0.014) | 0.061*** (0.014) | 0.024*** (0.007) | 0.084*** (0.020) |
| child | 0.006 (0.005) | 0.006 (0.005) | 0.002 (0.002) | 0.009 (0.007) |
| edu | -0.044*** (0.009) | -0.044*** (0.009) | -0.017*** (0.005) | -0.062*** (0.013) |
| urban | -0.004 (0.004) | -0.004 (0.004) | -0.002 (0.001) | -0.005 (0.005) |
| ln pop | -0.088 (0.060) | -0.086 (0.061) | -0.034 (0.025) | -0.120 (0.085) |
| ln pgdp | -0.137** (0.069) | -0.137** (0.069) | -0.053* (0.028) | -0.189** (0.095) |
| secindust | -0.003 (0.005) | -0.003 (0.004) | -0.001 (0.002) | -0.004 (0.006) |
| terindust | -0.011** (0.006) | -0.012** (0.005) | -0.005** (0.002) | -0.016** (0.008) |
| doctor | 0.003 (0.003) | 0.003 (0.003) | 0.001 (0.001) | 0.004 (0.005) |
| rh | -0.012 (0.010) | -0.013 (0.010) | -0.005 (0.004) | -0.018 (0.014) |
| temp | -0.397*** (0.074) | -0.402*** (0.077) | -0.156*** (0.035) | -0.558*** (0.104) |
| ndvi | -0.532 (1.134) | -0.618 (1.125) | -0.244 (0.455) | -0.861 (1.574) |
| 0.291*** (0.036) | ||||
| Log likelihood | -1400.340 | |||
| N | 1384 |
注:***、**、*分别代表通过1%、5%和10%显著性水平检验,下同。
控制变量对人口死亡率的影响表现为:60岁及以上老年人口比重对人口死亡率具有显著的正向预测作用。大专及以上学历人口比重越高的地区,人口死亡率越低,这是因为高学历人群的环境污染防范意识更高、健康素养更高。经济发展和经济结构方面,人均GDP越高,地区人口死亡率越低,因为高收入人群更加具有规避空气污染的意识和能力;第三产业比重对人口死亡率具有显著的负向影响;自然环境因素方面,年平均温度越低,死亡率越高,因为低温影响人体心血管功能等正常运作,影响人体健康。
3.2 社会经济因素对PM2.5—人口死亡率关系的调节效应
本文运用调节效应分析技术,揭示社会经济因素对PM2.5—死亡率关联的调节作用。如表3所示,引入交互项后,当年PM2.5浓度与大专及以上学历人口比重的交互项在5%的显著性水平下显著为负,与城镇化率的交互项在10%的显著性水平下显著为负;当年PM2.5与对数人均GDP、第三产业比重的交互项系数不显著。研究发现了PM2.5—人口死亡率的关系受高学历群体比重差异的调节,证实了涂正革等[42]、Yang等[54]的研究发现:高素质人群健康意识更强,具有规避环境污染风险的意识和防护能力,能有效缓解PM2.5污染对人体健康的影响;同时,学历与职业分化密切相关,受教育程度低的人群往往从事基础性和有污染性的工作,容易暴露于更高污染浓度的空气之中。其次,发现PM2.5—人口死亡率的关系受到城镇化发展水平差异的调节,证实了Li等[20]、Liang[55]等的研究发现:随着城镇化发展水平的提高,居民健康素养提高[56],规避环境污染风险的意识和防护能力增强,减少暴露于PM2.5污染环境;高城镇化水平地区的医疗卫生资源等社会保障体系配套更完善[40,57],居民生活水平提高,有效调节居民健康脆弱性。同时,还发现了人均GDP、第三产业比重对当年PM2.5—人口死亡率的关系没有显著的调节作用,这与Geng等[41]、孙猛等[43]的研究发现不一致,原因可能为:一是本文的研究对象为中国346个城市,研究对象不一致;二是关注PM2.5—人口死亡率的关系,Geng等[41]的研究关注PM2.5—死亡人数的关系,而孙猛等[43]的研究关注主观感知的空气污染暴露与自评健康的关系,因变量或核心解释变量的不同可能导致最终结果差异。
表3 社会经济因素的调节效应分析
Tab.3
| 变量 | 模型2: SLM模型 估计系数(标准差) | 模型3: SLM模型 估计系数(标准差) | 模型4: SLM模型 估计系数(标准差) | 模型5: SLM模型 估计系数(标准差) |
|---|---|---|---|---|
| pm | 1.512*** (0.477) | 2.091*** (0.714) | 2.383 (1.681) | 1.425* (0.864) |
| older | 0.061*** (0.014) | 0.061*** (0.014) | 0.061*** (0.014) | 0.061*** (0.014) |
| child | 0.007 (0.005) | 0.006 (0.005) | 0.006 (0.005) | 0.006 (0.005) |
| edu | -0.021 (0.014) | -0.040*** (0.010) | -0.042*** (0.009) | -0.043*** (0.009) |
| urban | -0.004 (0.004) | 0.002 (0.005) | -0.004 (0.004) | -0.004 (0.004) |
| ln pop | -0.092 (0.060) | -0.095 (0.060) | -0.091 (0.060) | -0.089 (0.060) |
| ln pgdp | -0.158** (0.070) | -0.148** (0.069) | -0.111 (0.074) | -0.143** (0.069) |
| secindust | -0.004 (0.005) | -0.004 (0.005) | -0.003 (0.005) | -0.003 (0.005) |
| terindust | -0.012** (0.006) | -0.012** (0.006) | -0.012** (0.006) | -0.009 (0.007) |
| doctor | 0.004 (0.003) | 0.004 (0.003) | 0.003 (0.003) | 0.003 (0.003) |
| rh | -0.009 (0.010) | -0.010 (0.010) | -0.011 (0.010) | -0.011 (0.010) |
| temp | -0.414*** (0.075) | -0.410*** (0.074) | -0.408*** (0.075) | -0.396*** (0.074) |
| ndvi | -0.384 (1.135) | -0.373 (1.136) | -0.337 (1.154) | -0.508 (1.135) |
| pm×edu | -0.061** (0.029) | |||
| pm×urban | -0.022* (0.011) | |||
| pm×ln pgdp | -0.140 (0.155) | |||
| pm×terindust | -0.013 (0.019) | |||
| 0.287*** (0.036) | 0.287*** (0.036) | 0.290*** (0.036) | 0.291*** (0.036) | |
| 0.434*** (0.017) | 0.434*** (0.017) | 0.435*** (0.017) | 0.435*** (0.017) | |
| Log likelihood | -1398.1478 | -1398.4257 | -1399.9333 | -1400.1161 |
| N | 1384 | 1384 | 1384 | 1384 |
3.3 稳健性分析
为考察实证研究结果的稳健性,本文基于模型和数据掌握情况,运用空间误差模型(模型6)、替换当年PM2.5浓度变量为3年PM2.5均值浓度(模型7)和重新定义核心解释变量(模型8)的方法进行稳健性检验。模型结果如表4所示,3种稳健性分析方法获得的核心解释变量的系数显著性和方向均没有变化。上述结果表明,PM2.5影响地区人口死亡率,PM2.5浓度越高人口死亡率越高的结论是稳健的。
表4 稳健性检验结果
Tab.4
| 变量 | 模型6: SEM 估计系数(标准差) | 模型7: SLM 估计系数(标准差) | 模型8: SLM 估计系数(标准差) |
|---|---|---|---|
| pm | 1.164** (0.477) | ||
| pm3 | 0.846* (0.477) | ||
| pm_35 | 0.224*** (0.074) | ||
| older | 0.069*** (0.016) | 0.067*** (0.013) | 0.063*** (0.013) |
| child | 0.005 (0.006) | 0.006 (0.005) | 0.006 (0.005) |
| edu | -0.050*** (0.010) | -0.043*** (0.009) | -0.043*** (0.009) |
| urban | -0.004 (0.004) | -0.004 (0.004) | -0.004 (0.004) |
| ln pop | -0.080 (0.066) | -0.087 (0.060) | -0.087 (0.060) |
| ln pgdp | -0.223*** (0.075) | -0.145** (0.071) | -0.115* (0.068) |
| secindust | -0.004 (0.005) | -0.002 (0.005) | -0.003 (0.005) |
| terindust | -0.011* (0.006) | -0.011** (0.006) | -0.011** (0.006) |
| doctor | 0.003 (0.003) | 0.003 (0.003) | 0.003 (0.003) |
| rh | -0.020 (0.013) | -0.014 (0.010) | -0.015 (0.009) |
| temp | -0.511*** (0.093) | -0.385*** (0.078) | -0.403*** (0.073) |
| ndvi | -0.896 (1.385) | -1.113 (1.096) | -0.554 (1.115) |
| 0.296*** (0.038) | |||
| 0.298*** (0.036) | 0.297*** (0.036) | ||
| N | 1384 | 1384 | 1384 |
| Log likelihood | -1401.978 | -1401.626 | -1398.653 |
4 结论与讨论
本文采用2000、2010年中国人口普查资料,各省级行政单元2005年和2015年1%人口抽样调查资料,以及《中国城市统计年鉴》和《中国城市建设统计年鉴》等资料,使用探索性空间分析方法刻画中国城市人口死亡率的空间分布格局及其变化,运用空间滞后模型揭示PM2.5浓度对人口死亡率的影响及其空间溢出效应,以及识别社会经济因素对PM2.5—人口死亡率关联的调节效应。主要结论如下:
(1) 中国城市人口死亡率分布呈现显著的空间分异性。2000—2005年,人口死亡率呈现北低南高的空间分布格局;2010—2015年人口死亡率分布格局发生较大变化,呈现由相对集聚到零散分布态势。高死亡率地区早期集聚分布于西南地区,2005年后在西南地区、华北地区、华东地区和华中地区呈现逐渐集聚分布态势;低死亡率地区长期集中分布于西北地区、东北地区、长三角地区、珠三角地区和京津两市。
(2) 人口死亡率分布呈现显著的正向空间关联性。2000—2015年,人口死亡率高—高类型地区数量增加,高—低类型和低—高类型地区数量较少且呈现零散分布的特征。人口死亡率高—高类型地区早期集中分布于西南地区,2010—2015年向华东地区的山东半岛、苏北地区、苏鲁豫皖交界地区和华中地区的湖北省延伸;低—低类型地区长期集中在北疆、内蒙古西部和广东省及周边地区。
(3) PM2.5污染显著影响人口死亡率且存在空间溢出效应。PM2.5浓度越高,人口死亡率越高。区域内PM2.5对人口死亡率的影响显著高于相邻地区的PM2.5“越境污染”影响。人口死亡率除了受PM2.5影响外,还受到地区老龄化程度、人口受教育水平和人均GDP、第三产业比重等的影响。PM2.5污染对死亡率的影响存在学历差异和城镇化发展程度差异,地区高学历人群集聚可降低PM2.5的健康风险,城镇化发展进程缓慢则会加重PM2.5的健康风险。社会文化水平较低或城镇化水平较低的地区,居民的健康脆弱性更高。
本文结果对改善PM2.5暴露导致的健康风险具有一定的现实启示:城镇化水平低而空气污染严重的地区,应加大对公众的环境污染防范应急教育和健康素养教育;城镇化水平高且空气污染严重地区,如上海、南京、武汉等城市,可以探索城市绿色发展路径,实施区域空气污染防治协作,提高公众的环境污染防范意识和规避能力;城镇化水平高而空气污染较轻的地区,如厦门、福州、贵阳、昆明等城市避免走先污染后治理的老路,探索绿色发展路径,加快产业转型升级。
本文的创新点体现在:首先,基于2000—2015年的面板数据进行研究,面板数据具有控制个体异质性、降低与解释变量相关的遗漏变量影响等优点;其次,基于PM2.5的空间扩散自然属性,采用空间回归模型揭示PM2.5的空间溢出效应,探讨PM2.5暴露的健康影响群体差异。但存在以下几点不足:第一,本文由于以地区群体水平为研究单位,未能控制地区个体的人口学特征,可能存在无法控制的混杂因素;第二,本文因变量为粗死亡率,空气污染对人口健康的影响存在性别、年龄等差异,由于数据受限没有消除人口年龄、性别等的影响;第三,以城市为研究对象的空间尺度较大,无法讨论城市内部的异质性表现。基于以上不足,未来的研究可从多维地理尺度对PM2.5—人口健康的影响进行讨论,细化健康水平指标,对较高、较低死亡率地区或人口死亡率高—高、低—低类型集聚的区域进行针对性研究,以深入探讨空气污染对人口健康的影响。
参考文献
Stronger policy required to substantially reduce deaths from PM2.5 pollution in China
[J].
PM2.5对人群健康影响的流行病学研究进展
[J].
Progress on epidemiological study of PM2.5 effect to human health
Long term exposure to air pollution and mortality in an elderly cohort in Hong Kong
[J].DOI:10.1016/j.envint.2018.04.034 URL [本文引用: 2]
Ambient air quality and the effects of air pollutants on otolaryngology in Beijing
[J].
Mortality burden of ambient fine particulate air pollution in six Chinese cities: Results from the Pearl River Delta study
[J].DOI:10.1016/j.envint.2016.09.007 URL [本文引用: 1]
Association of short-term exposure to air pollution with mortality in older adults
[J].DOI:10.1001/jama.2017.17923 URL [本文引用: 1]
Historic air pollution exposure and long-term mortality risks in England and Wales: Prospective longitudinal cohort study
[J].
DOI:10.1136/thoraxjnl-2015-207111
PMID:26856365
[本文引用: 1]

Long-term air pollution exposure contributes to mortality but there are few studies examining effects of very long-term (>25 years) exposures.This study investigated modelled air pollution concentrations at residence for 1971, 1981, 1991 (black smoke (BS) and SO2) and 2001 (PM10) in relation to mortality up to 2009 in 367,658 members of the longitudinal survey, a 1% sample of the English Census. Outcomes were all-cause (excluding accidents), cardiovascular (CV) and respiratory mortality.BS and SO2 exposures remained associated with mortality decades after exposure-BS exposure in 1971 was significantly associated with all-cause (OR 1.02 (95% CI 1.01 to 1.04)) and respiratory (OR 1.05 (95% CI 1.01 to 1.09)) mortality in 2002-2009 (ORs expressed per 10 μg/m(3)). Largest effect sizes were seen for more recent exposures and for respiratory disease. PM10 exposure in 2001 was associated with all outcomes in 2002-2009 with stronger associations for respiratory (OR 1.22 (95% CI 1.04 to 1.44)) than CV mortality (OR 1.12 (95% CI 1.01 to 1.25)). Adjusting PM10 for past BS and SO2 exposures in 1971, 1981 and 1991 reduced the all-cause OR to 1.16 (95% CI 1.07 to 1.26) while CV and respiratory associations lost significance, suggesting confounding by past air pollution exposure, but there was no evidence for effect modification. Limitations include limited information on confounding by smoking and exposure misclassification of historic exposures.This large national study suggests that air pollution exposure has long-term effects on mortality that persist decades after exposure, and that historic air pollution exposures influence current estimates of associations between air pollution and mortality.Published by the BMJ Publishing Group Limited. For permission to use (where not already granted under a licence) please go to http://www.bmj.com/company/products-services/rights-and-licensing/
Low-concentration PM2.5 and mortality: Estimating acute and chronic effects in a population-based study
[J].DOI:10.1289/ehp.1409111 URL [本文引用: 1]
Systematic review and meta-analysis of the adverse health effects of ambient PM2.5 and PM10 pollution in the Chinese population
[J].DOI:10.1016/j.envres.2014.06.029 URL [本文引用: 1]
Changes in life expectancy of respiratory diseases from attaining daily PM2.5 standard in China: A nationwide observational study
[J].
空气污染与公共健康: 基于省际面板数据的实证研究
[J].
Air pollution and public health: An empirical study based on provincial panel data
Evidence on the impact of sustained exposure to air pollution on life expectancy from China's Huai River policy
[J].DOI:10.1073/pnas.1300018110 URL [本文引用: 1]
Change in the number of PM2.5-attributed deaths in China from 2000 to 2010: Comparison between estimations from census-based epidemiology and pre-established exposure-response functions
[J].DOI:10.1016/j.envint.2019.05.067 URL [本文引用: 1]
基于空间网格尺度的中国PM2.5污染健康效应空间分布
[J].
Health effects' spatial distribution analysis of PM2.5 pollution in China based on spatial grid scale
中国环境污染的健康压力时空差异特征
[J].
DOI:10.13249/j.cnki.sgs.2017.03.003
[本文引用: 1]
构建基于环境污染的人口健康压力指数模型,引入空间集聚和收敛性检验方法,对中国各省区2005~2014年的污染健康压力的时空差异特征进行研究,结果表明:① 2005~2014年各省区的污染健康压力指数发生明显下降,省际差异程度有所降低,但“东高、西低、中部居中”的基本格局没有变化。② 各省区健康压力指数的空间分布在宏观上呈现出一定的空间集聚性,集聚趋势随时间有所弱化。③ 在控制城市化率、人均GDP、人口死亡率、森林覆盖率等变量的条件下,考察时段内各省区健康压力指数变化存在微弱的收敛性,各省区的健康压力预期将逐步趋同于某一较低水平。
Spatio-temporal difference characteristic of pollution's health stress of China
DOI:10.13249/j.cnki.sgs.2017.03.003
[本文引用: 1]
Health is the basic right of human beings, and is also one of the important goals of the construction of well-off society in China. Nowadays, the rapid urbanization and industrialization have resulted in serious environmental pollution, which did harm to human health. To harmonize the relationships between economic development, environmental conservation and population health, it is necessary to measure the health pressure caused by environmental pollution at macro level to explore the spatial distribution pattern and changing rules of pollution’s health pressure. This paper established the population health pressure model based on environmental pollution, and used the spatial agglomeration and convergence test model to study the temporal and spatial differences characteristics of health pressure caused by pollution in China in the recent decade. At first, this paper built the index system of pollution health pressure. And then, the analytic hierarchy process based on expert knowledge was employed to determine the weight of index. And the findings showed that: 1) The pollution health pressure of each province decreased from 2005 to 2014, as well as the provincial differences, while the spatial pattern of “high in the east, middle in the central and low in the west” still existed; 2) The spatial agglomeration was one of the main characteristics of health pressure distribution, which could describe the spatial relations of geographic position and pressure index. This paper used the spatial autocorrelation and the global exponential of Moran’s I to study the spatial agglomeration. The spatial distribution of provincial pollution health pressure was not completely random. But instead it present the trend of spatial agglomeration, which meant that the high (low) pressure provinces were tend to adjacent high(low) level provinces. And compared with 2005, the space agglomeration in 2014 of pollution health pressure decreased; 3) Studying the convergence of temporal and spatial changes of health pressure helped learning the changing trends of health pressure, which could provide references for the formulation of relevant optimization policy. And the statistical test shown that the provincial pollution health pressure in 2005-2014 present the weak convergence trend while controlling the variables (urbanization rate, per capita GDP, population mortality and the forest coverage rate). And it meant that the provincial health pressure would be tend to the low-level convergence, in accordance with the continual decrease of health pressure difference and the weaker tendency of spatial agglomeration. Obviously, this article aimed at exploring the temporal and spatial differences characteristics of health pressure caused by environmental pollution in China, and the findings could provide references for government to optimize and coordinate the complicated relationships between environment and health.
中国地区间健康差异的因素分解
[J].
Analysis of regional differences in health in China
中国人口健康分布的时空变化与影响因素
[J].
Spatio-temporal variations of population health distribution in China and its influencing factors
A spatial-temporal analysis of health care and mortality inequalities in China
[J].DOI:10.2747/1539-7216.51.6.767 URL [本文引用: 3]
中国居民健康水平的区域差异分析
[J].
The regional difference of the resident's health level in China
中国居民健康水平的区域差异: 2003—2013
[J].
DOI:10.11821/dlxb201704010
[本文引用: 1]
健康不公平作为影响人类发展的核心问题,已引起世界各国的广泛关注。基于变异系数、泰勒指数、空间自相关分析和空间面板计量模型,本文探讨了2003年以来中国居民健康水平的区域差异、时空变化及其关键影响因素,旨在为政府制定全民健康政策提供科学依据。结果发现:① 2003-2013年,中国居民健康水平提高26.98%,西部增幅高于东、中部,但始终保持着“东—中—西”阶梯式递减态势;② 中国居民健康水平的区域差异总体呈扩大趋势,其中地带间差异趋于缩小,地带内差异趋于扩大,西部地带内差异扩大尤为显著;③ 居民健康水平的空间分布转为明显的“T”字型格局,并呈“东—中—西”阶梯式及“北—中—南”对称式递减;④ 居民健康水平的空间集聚程度趋于减小,热点区与冷点区均呈收缩态势,且西部形成规模显著的稳定性冷点,东部沿海形成规模显著的稳定性热点;⑤ 人均GDP、人均公共医疗卫生支出、城市化水平及环境质量等因素对居民健康水平时空变化具有显著影响,随着人均GDP与人均公共医疗卫生支出的增加、城市化水平的提高及环境质量的改善,居民健康水平随之提高。未来,还需对居民健康水平的多时域、多尺度及多影响机制等问题开展深入研究。
Regional inequalities of residents' health level in China: 2003-2013
DOI:10.11821/dlxb201704010
[本文引用: 1]
As one of the core problems clsoely related with human development, health inequality has aroused an increasing concern in the world. Through an integration of the coefficient of variation, Theil index, exploratory spatial data analysis (ESDA) and spatial panel econometric model, we examine the regional inequality, spatial-temporal dynamic patterns and the key factors of the residents' health level (RHL) in China from 2003 to 2013. The aim is to provide scientific basis for policy making on regional health inequality reduction in China. The results are shown as follows: (1) China's RHL index decreased from 0.404 to 0.295 in 2003-2013, with an annual rate of 2.698%. Specifically speaking, the growing rate in the western region was higher than that in the eastern and central regions, but the there is no change in RHL in terms of the basic pattern which decreases from the east to central part then to the west. (2) The regional inequality of RHL presented an extending trend in 2003-2013. Among this, the RHL inequality between regions presented a reducing trend, but that within a region presented an expanding trend. And the growing rate of inequalities of RHL in the western region was higher than that of the eastern and central regions. (3) The spatial distribution of RHL has tended into the letter "T" shape, and the RHL presented a stepped decrease from the east to the central part then to the west and a symmetric decrease from the north to the central part then to the south. (4) By observing the change of Moran's I in 2003, 2008 and 2013, we found that the spatial agglomeration range of RHL presented a narrowing trend. All the hot spots and cold spots presented a shrinking tendency, the RHL in the west formed a stable cold spot, including Xinjiang, Qinghai and Xizang, but that in the east coastal area formed a stable hot spot, including Shandong, Henan, Qinghai, Hubei, Anhui, Jiangsu and Shanghai. (5) The selected explanatory variables, such as per capita GDP, per capita spending on health, urbanization level and environment quality, have significant direct impacts on the RHL in China. With the increase of per capita GDP, per capita spending on health and urbanization level and the improvement of environment quality, the RHL will be raised. Finally, this paper points out the attention should be focused on the research of the regional inequality of RHL, such as the problems of the residents' multi-time-domain, multi-scale and multi-influencing mechanism.
经济、环境与人口健康的相互影响: 基于我国省区面板数据的实证分析
[J].
Interrelationship between growth, environment and population health: An empirical analysis based on China's provincial data
地理学视角下城市高温热浪脆弱性评估研究进展
[J].
DOI:10.18306/dlkxjz.2020.04.015
[本文引用: 1]
全球气候变化及快速城市化增加了极端天气事件的发生频率,高温热浪作为其中的典型效应,增加了与热相关的健康风险,越来越受到气象学、医学与地理学学者的关注。论文系统梳理了高温热浪的定义,从地理学视角,以空间评估作为切入点,总结分析了高温热浪脆弱性评估中的空间指标、空间制图方法与空间对策等方面的研究进展,指明该领域已从单一视角逐步深入到气象学、医学、地理学等复合学科的交叉研究,地理学作为桥梁将气象学与医学有机结合,为脆弱性评估提供空间指标参数、为制图提供思路与方法,并提供空间对策连接规划和风险预警等实践工作。未来的研究展望包括:空间指标综合各学科研究需要、集成各学科优势进行构建,空间制图在社区小尺度到区域大尺度的耦合机理分析基础上探讨跨区域研究表达方式,空间对策针对不同风险人群采取差异化研究,为城市适应气候变化提供科学依据。
Research progress on urban heat wave vulnerability assessment: A geographical perspective
DOI:10.18306/dlkxjz.2020.04.015
[本文引用: 1]
With global climate change and rapid urbanization, extreme weather events have become much more frequent. As one of the most typical extreme weather events caused by climate change, heat wave has been enhancing the heat-related health risks, and continuously attracting widespread attention from meteorologists, medical professionals and geographers. As a bridging actor integrating meteorological and medical fields, geography provides spatial indicators for heat wave vulnerability assessment, ideas and methods for mapping, spatial solutions for practical work such as planning and early warning. This article systematically reviews the progress of spatial assessment of heat wave vulnerability based on the perspective of geography. The contents include the definition of heat wave, spatial indicators and mapping methods. The literature reviews indicate that heat wave vulnerability assessment has gradually deepened from single perspective to the interdisciplinary study of meteorology, medicine, geography and other disciplines. In the future, more detailed exploration will be carried out, such as the construction of spatial indicators to integrate the advantages and research demands of various disciplines; the exploration about small-scale community to regional large-scale links and cross-regional research expression by mapping. Spatial approaches require differentiated research among different groups, which provide a scientific basis for climate change adaptation of cities.
Residential greenness and birth outcomes: A systematic review and meta-analysis of observational studies
[J].
Environmental justice and health: The implications of the socio-spatial distribution of multiple environmental deprivation for health inequalities in the United Kingdom
[J].DOI:10.1111/j.1475-5661.2010.00399.x URL [本文引用: 1]
地理环境暴露与公众健康研究进展
[J].
Progress and prospect of the research on geographical environment exposure and public health
医学地理和环境健康研究的主要领域与进展
[J].
Progress of medical geography and environmental health studies
城市居民出行的空气污染暴露测度及其影响机制: 北京市郊区社区的案例分析
[J].
Measurement of residents' daily travel air pollution exposure and its mechanism: A case study of suburban communities in Beijing
居民时空行为与环境污染暴露对健康影响的研究进展
[J].
DOI:10.18306/dlkxjz.2017.10.008
[本文引用: 1]
环境污染是全球共同面对的重大问题之一,严重危害居民的健康状况。已有关于环境污染与健康研究主要包括宏观区域层面的环境污染与健康指标的相关关系研究;基于居民日常交通出行的空气污染暴露与健康效应的研究;以及关注社会经济属性,重点探讨黑人、儿童、低收入者等弱势群体所承受的环境负面影响,即环境公正和健康不平等研究。本文对上述研究进行较为系统的梳理与评价,基于时空行为、环境公正等学科前沿议题,为研究环境污染与健康之间的复杂性提供多样化的理论视角以及较为完整的分析框架。同时提出,需要将个体时空行为、环境污染与健康相关联,从微观层面深入研究基于居民时空行为轨迹的环境污染暴露与健康影响机理,挖掘不同社会、空间背景下的环境公正与健康不平等的内在关系,为发展更为公平、有效的城市与交通规划措施以及环境健康政策等提供科学依据。
Progress of research on the health impact of people's space-time behavior and environmental pollution exposure
DOI:10.18306/dlkxjz.2017.10.008
[本文引用: 1]
Environmental pollution is a major problem worldwide, subjecting people to serious health risks. Numerous studies on environmental pollution and health impact have been conducted, focusing on various aspects such as the associations between environmental pollution and health at the aggregate level, air pollution exposure and health effects based on daily travel behavior of residents, and environmental justice and health inequality. The environmental justice and health inequality research focuses on the adverse environmental impacts on the disadvantaged groups, such as the minority, children, people with low-level income, and migrants. This article aims to provide a comprehensive review on environmental pollution and health studies from various perspectives, and presents a diversified research framework to investigate the complexity between environmental pollution and health. Moreover, we propose that future research needs to link individual space-time behavior with environmental pollution and health, to explore the microscale or personal-level real-time air pollution exposure and its health effects based on the residents' space-time behavior trajectory. More research needs to be conducted to investigate the complex relationship between environmental justice and health inequality at microscale under different social and spatial contexts, in order to develop more just, effective urban/transportation planning measures and environmental health policies.
大城市居民自评健康与环境危害感知的空间差异及影响因素: 基于郑州市区的实证研究
[J].
DOI:10.18306/dlkxjz.2018.12.013
[本文引用: 1]
环境污染与健康的研究一直受到世界各国的广泛关注。基于2016年郑州市区的大规模问卷调查,运用GIS空间分析技术、多元线性回归模型以及logistic回归模型等方法,研究微观尺度下居民健康与环境危害感知的空间分布,并探讨影响居民健康的关键因素。研究表明:①郑州市居民对自身健康状况的感知总体上处于中等水平,多数居民认为空气污染最严重,其次是噪声污染,垃圾污染与水污染相对较轻,但这4种环境污染均对居民健康状况具有显著影响。②居民健康感知的空间差异显著,呈现出明显的“中间低—外围高”的分布特征,即市中心的居民健康水平较低,而处于外围地区的居民健康水平较高。③不同社会经济属性个体对自身健康状况感知差异明显,随着年龄的增长对健康状况的感知越来越差,尤其是60岁以上的人群感知最差;高学历与高收入者认为自己健康状况很好或者非常好的比例远大于低学历与低收入者;性别与婚姻状况对健康感知的影响并不明显。④居住地到工作单位的距离越远,健康状况感知很好或者非常好的人数比例越低,街道区位也是影响居民感知自身健康状况的显著因素。研究结果可为郑州市制定更加公平、有效的环境健康政策提供科学依据。
Spatial differentiation and influencing factors of residents' self-rated health and environmental hazard perception: A case study of Zhengzhou City
DOI:10.18306/dlkxjz.2018.12.013
[本文引用: 1]
Environmental pollution and health issues have aroused increasing concerns in the world. Based on a large-scale questionnaire survey in Zhengzhou City, Henan Province in 2016, this study examined the spatial differentiation and key influencing factors of self-rated health and perceived environmental hazards in the city on the micro-scale by using GIS spatial analysis technique, multiple linear regression model, and logistic regression model. The following conclusions can be drawn: (1) The perception of residents on own health was generally at a moderate level. The majority of the surveyed residents believed that air pollution was the most serious problem in Zhengzhou, followed by noise pollution and landfill and water pollution, but all four kinds of environmental pollution had a significant impact on the health of the residents. (2) The spatial differentiation of residents’ health perception was evident, which showed a clear pattern of low values in the core area and high values in the periphery, namely, the health levels in the central city regions were lower, while the suburban regions showed higher health levels. (3) Individuals with different socioeconomic status showed significant differences in their own health perception. Perception of health was getting worse for older people. In particular, the people over 60 years old had the worst perception of health conditions. The proportion of highly-educated and high-income people who considered their health as excellent or good was far greater than the proportion for poorly educated and low-income residents. The effects of gender and marital status on health perception were not obvious. The longer the distance between residence and workplace, the lower proportion of people who felt excellent or good with their health. Meanwhile, location of subdistricts had a remarkable effect on residents’ health perception. The aim of the study was to provide a scientific basis for more equal and effective policies on resident health in Zhengzhou City.
Spatial variations and macroeconomic determinants of life expectancy and mortality rate in China: A county-level study based on spatial analysis models
[J].DOI:10.1007/s00038-019-01251-y URL [本文引用: 1]
孕期大气细颗粒物PM2.5暴露及对早产的影响研究
[J].
Ambient PM2.5 during pregnancy and risk on preterm birth
DOI:10.3760/cma.j.issn.0254-6450.2016.04.027
PMID:27087229
[本文引用: 1]
To investigate the association between ambient fine particulate matter with aerodynamic diameter less than 2.5 μm (PM2.5) and the risk on preterm birth.A total of 1 882 pregnant women with local residency of Taiyuan city and underwent delivery at the First Hospital of Shanxi Medical University with the dates of conception between January 1 and December 31, 2013, were enrolled in the study. Information on general demographics, home address and history on pregnancy, lifestyle and related environmental factors were collected through in-person interview. Birth outcomes and maternal complications were abstracted from medical records. Data on the amount of daily average PM2.5 from 8 monitor points in Taiyuan city, between March 1, 2012 and December 31, 2013 were also collected. Individual exposure during pregnancy were calculated using the inverse-distance weighting method, based on home address. Multivariate unconditional logistic regression model was used to examine the associations among PM2.5 exposure, risk of preterm birth and related clinical subtypes.The overall incidence of preterm birth was 8.21% (151/1 839)in 1 839 pregnant women. Exposure to ambient PM2.5 during the second week prior to delivery was associated with an increased risk of preterm birth (OR=1.087, 95% CI: 1.001-1.182 per 10 μg/m(3) increase) and mild preterm birth (OR=1.099, 95% CI: 1.007-1.200 per 10 μg/m(3)). Compared to data from the China Environmental Air Quality Standard, higher level of exposure (≥75 μg/m(3)) of PM2.5 during the second week before delivery was associated with an increased risk of preterm birth (OR=1.008, 95%CI: 1.000-1.017) but the association was mainly seen for mild preterm birth (OR=1.010, 95%CI: 1.001-1.018).RESULTS from our study showed that exposure to high level of PM2.5 during late pregnancy would increase the risk of preterm birth. Future large studies are needed to examine the association by preterm clinical subtypes and to elucidate potential underlying mechanisms.
Air pollution, economic development of communities, and health status among the elderly in urban China
[J].DOI:10.1093/aje/kwn260 URL [本文引用: 1]
不同类型城市的PM2.5健康风险及影响因素差异
[J].
Differences of PM2.5 health risks and influencing factors in different types of cities
汾渭平原典型城乡PM2.5中多环芳烃特征与健康风险
[J].
DOI:10.11821/dlxb202103017
[本文引用: 2]
为查明汾渭平原典型城乡地区重度污染天气PM<sub>2.5</sub>中多环芳烃(PAHs)污染特征及其人群健康效应,本文于2018—2019年冬季分别选取西安和陇县作为城乡对比参照点,采集了重度污染天气PM<sub>2.5</sub>颗粒态气溶胶样品。利用气相色谱—质谱联用仪(GC-MS)检测样品中具有“三致效应”的15种PAHs含量及组分特征,使用特征比值法及主成分法进行PAHs源解析,并分析了气象因素对PAHs质量浓度的可能影响,通过对苯并芘(BaP)等效毒性浓度和终生超额致癌风险度(ILCR)的计算,对人群健康风险进行评估。结果表明:西安与陇县在重度污染天气条件下PM<sub>2.5</sub>中15种PAHs总平均质量浓度分别为243.78 ng/m<sup>3</sup>、609.39 ng/m<sup>3</sup>,其中4~6环PAHs占比最高;且PAHs浓度与气温、气压及风速呈显著负相关,与相对湿度则无明显相关性。西安PAHs污染主要来自燃烧源与交通排放源,而煤炭及生物质燃烧是造成陇县PAHs质量浓度偏高的主要原因。健康风险评估结果显示,重污染天气下陇县人群通过呼吸引发的致癌风险要高于西安,女性致癌风险高于男性,成人致癌风险高于儿童,且两地区成人ILCR值均超过风险阈值,存在潜在致癌风险,儿童则无明显致癌风险。
Characteristics and health risk of polycyclic aromatic hydrocarbons in PM2.5 in the typical urban and rural areas of the Fenwei Plain
DOI:10.11821/dlxb202103017
[本文引用: 2]
In order to investigate the pollution characteristics and human health risk of polycyclic aromatic hydrocarbons (PAHs) in heavy polluted weather in the typical urban and rural areas of the Fenwei Plain, PM2.5 samples were collected from Xi'an and Longxian in the winter of 2018-2019. The mass concentrations of 15 PAHs characterized by carcinogenicity, mutagenicity and teratogenicity in the samples were determined using gas chromatograph-mass spectrometer (GC-MS). The source of PAHs was analyzed by the diagnostic ratio and principal component method and the possible relation between PAHs mass concentrations and meteorological parameters was elaborated. In addition, human health risk caused by PAHs in PM2.5 was assessed through the equivalent carcinogenic concentration of benzo(a)pyrene (BaP) and incremental lifetime cancer risk (ILCR). The results showed that the average mass concentrations of PAHs in PM2.5 in heavy polluted weather in Xi'an and Longxian were 243.78 μg/m3 and 609.39 μg/m3, respectively, and 4-6 rings of PAHs had the highest proportion of the total. Moreover, PAHs concentrations had a significant negative correlation with atmospheric temperature, atmospheric pressure and wind speed, but irrelevant with relative humidity. Combustion source and automobile exhaust emissions were the main factors contributing to the high concentration of PAHs in Xi'an, while coal and biomass burning were the main factors contributing most to PAHs of Longxian. Health risk assessment results revealed that the carcinogenic risk caused by breathing during heavy polluted weather was higher in Longxian than that in Xi'an and the cancer risk for females was higher than that for males, and the cancer risk for adults was higher than that for children. In addition, the ILCR value of adults in both urban and rural areas exceeded the risk threshold recommended by EPA and had potential carcinogenic risks, while there was no obvious carcinogenic risk for children.
大气颗粒物PM2.5及其危害
[J].
Air particulate matter PM2.5 in Beijing and its harm
环境公正视角下空气污染和死亡人数的空间分析及关系研究: 以河北省为例
[J].
Spatial analysis and modelling of air pollution and death rates in Hebei province, China
污染、健康与不平等: 跨越“环境健康贫困”陷阱
[J].
Pollution, health and inequality: Crossing the trap of 'environmental health poverty'
Urbanisation and health in China
[J].DOI:10.1016/S0140-6736(11)61878-3 URL [本文引用: 2]
Drivers of PM2.5 air pollution deaths in China 2002-2017
[J].DOI:10.1038/s41561-021-00792-3 URL [本文引用: 3]
收入增长、大气污染与公众健康: 基于CHNS的微观证据
[J].
Income growth, air pollution and public health: Based on the evidence from CHNS
空气污染社会经济地位与居民健康不平等: 基于CGSS的微观证据
[J].
Air pollution, SES and residents' health inequality: Micro evidence based on CGSS
中国雾霾污染治理的经济政策选择: 基于空间溢出效应的视角
[J].
China's economic policy choices for governing smog pollution based on spatial spillover effects
PM2.5污染与健康支出: 时间滞后效应与空间溢出效应
[J].
PM2.5pollution and health spending: Temporal lag effects and spatial spillover effects
京津冀城市群大气污染的时空特征与影响因素解析
[J].
DOI:10.11821/dlxb201801015
[本文引用: 1]
京津冀城市群是中国雾霾最严重的区域,在京津冀协同发展背景下,探究该地区大气污染的时空分布和影响因素具有重要意义。运用空间自相关分析和三种空间计量模型,分析了京津冀202个区县PM<sub>2.5</sub>的时空分异特征,创新性地对自然与人文影响因素贡献及其空间溢出效应进行系统地甄别和量化。结果表明:2000-2014年来京津冀城市群PM<sub>2.5</sub>浓度整体呈上升趋势,季节上呈秋冬高、春夏低,空间上呈东南高、西北低的特点,且城市建成区PM<sub>2.5</sub>浓度比周围郊区和农村平均高10~20 μg/m<sup>3</sup>;2014年仅有13.9%的区县空气质量达标,PM<sub>2.5</sub>浓度存在显著的空间集聚性与扩散性,城市间交互影响距离平均为200 km,邻近地区的PM<sub>2.5</sub>每升高1%,将导致本地PM<sub>2.5</sub>至少升高0.5%;社会经济内因对PM<sub>2.5</sub>主要是正向影响,自然外因主要是负向影响;影响因素中对本地大气污染的直接效应贡献强度依次是:年均风速>年均气温>人口密度>地形起伏度>第二产业占比>能源消费>植被覆盖度,人均GDP、年降水量和相对湿度对本地PM<sub>2.5</sub>没有显著影响;对邻近地区大气污染具有显著空间溢出效应的因素排序是:植被覆盖度>地形起伏度>能源消费>人口密度;对于自然和人文影响因素应分别采取针对性的适应策略和调控策略,加强区域间联防联控与合作治理,在城市群规划中注重环保规划与立法。
The spatial-temporal characteristics and influencing factors of air pollution in Beijing-Tianjin-Hebei urban agglomeration
DOI:10.11821/dlxb201801015
[本文引用: 1]
Air pollution is now the most serious environmental problem in China, especially for Beijing-Tianjin-Hebei (Jing-Jin-Ji) urban agglomeration. Under the background of Jing-Jin-Ji integrated development, it is of great importance to study the spatio-temporal distribution and its influencing factors. This paper firstly analyzed the spatio-temporal characteristics of PM2.5 concentration in 202 counties of Jing-Jin-Ji urban agglomeration using spatial analysis and visualization. Then we quantified the effect degree of different natural and human factors and the spatial spillover effect of these factors using Spatial Durbin Model (SDM). The results are as follows: (1) The PM2.5 concentration was on the rise as a whole from 2000-2014, and it was high in autumn and winter, while low in spring and summer. Seen from spatial distribution, the PM2.5 concentration was high in the southeast, while low in the northwest of the study area, and the concentration in urban built-up area was 10-20 μg/m3 higher than that of its surrounding suburban and rural areas. (2) The counties, whose PM2.5 concentration was below 35 μg/m3, only accounted for 13.9% in 2014. There were significant spatial agglomeration and diffusivity of PM2.5, and the mean distance interacting among the cities was 200 km. The PM2.5 of a city increased by more than 0.5% for every 1% increase in the average PM2.5 of neighboring cities. (3) Socio-economic factors have positive impact on PM2.5, and most of natural factors have negative impact. (4) Among the influencing factors, contributions to local atmospheric pollution with direct effect are: mean wind speed > annual mean temperature > population density > relief amplitude > the secondary industry share of GDP > energy consumption > vegetation coverage; however, per capita GDP, annual precipitation, and relative humidity have no significant effect on local pollution. (5) Contributions to neighborhood atmospheric pollution with spatial spillover effect are: vegetation coverage > relief amplitude > population density. The findings suggest that we should adopt the adaptation strategies for natural factors and control strategies for human factors. A coordinated and strengthened cooperation between local governments should be established for air pollution control, and environmental planning and legislation should be strengthened in a new round of urban agglomeration planning in China.
Annual PM2.5 concentrations for countries and urban areas, 1998—2016
[DB/OL].
中国人口空间分布公里网格数据集
[DB/OL].
1 km grid population spatial distribution dataset of China
MOD13Q1 MODIS/Terra Vegetation Indices 16-Day L3 Global 250m SIN Grid V006
[DB/OL].
Local indicators of spatial association: LISA
[J].DOI:10.1111/j.1538-4632.1995.tb00338.x URL [本文引用: 1]
Spatial growth regressions: Model specification, estimation and interpretation
[J].DOI:10.1080/17421770802353758 URL [本文引用: 1]
城镇化、空间溢出与区域经济增长: 基于空间回归模型偏微分方法及中国的实证
[J].
Urbanization, spatial spillover and regional economic growth based on partial differential method for spatial regression model and the empirical analysis of China
Interaction effects: Centering, variance inflation factor, and interpretation issues
[J].
The construction and examination of social vulnerability and its effects on PM2.5 globally: Combining spatial econometric modeling and geographically weighted regression
[J].DOI:10.1007/s11356-021-12508-6 URL [本文引用: 1]
Urbanization, ambient air pollution, and prevalence of chronic kidney disease: A nationwide cross-sectional study
[J].
我国城乡居民健康素养现状及对策
[J].
The current status of health literacy in China
