曹小曙 , 廖望
, 廖望
中山大学地理科学与规划学院,广州 510275
CAO Xiaoshu, LIAO Wang
收稿日期: 2017-10-16
修回日期: 2018-05-3
网络出版日期: 2018-11-28
版权声明: 2018 地理科学进展 《地理科学进展》杂志 版权所有
基金资助:
作者简介:
作者简介:曹小曙(1970-),男,甘肃灵台人,教授,博士生导师,主要从事地理与规划研究,E-mail: caoxsh@mail.sysu.edu.cn。
展开
摘要
基于2016年的全球官方航空指南(Official Aviation Guide, 简称OAG)计划航班数据,本文重点分析了全球多机场区域的空间格局和主要类型。研究发现:除美国和欧洲的英、法、德、意等国外,中国、日本、泰国和巴西等国的多机场区域数量占有绝对优势。南欧、澳大利亚和新西兰、西亚等地的多机场区域内的机场等级呈现两端极化,缺少中间层级的辅助机场。以车程时间作为衡量,英、美两国多机场区域内机场布局更为紧凑,特别是英国其他主要机场或辅助机场到达核心机场的时间相对中国减少了约0.5~1 h。根据各多机场区域赫芬达尔—赫希曼指数(HHI指数)和可售座位数对比结果,多机场区域可分为9个类型,对照多机场区域不同的演化阶段,目前共有22个多机场区域发展较成熟。未来在保证多机场区域整体发展的前提下,中国应注重其他重要机场向中间层级的辅助机场的转化进程,提高区域内地面交通水平,以减少机场间的到达时间,引导区域内机场维持高水平竞争。
关键词:
Abstract
This article employs the OAG (Official Airline Guide) flight schedule data of 2016 to analyze the spatial pattern and classification of multi-airport regions. The results indicate that: besides European countries and the United States, China, Japan, Thailand, and Brazil occupies important positions in the construction of multi-airport regions in the world. Multi-airport regions in Southern Europe, Australia, New Zealand, and West Asia are polarized and lack of secondary airports. The layout of airports in the multi-airport regions of the UK and the United States are more compacted, and people can spend 0.5~1 hour less when driving from the British other primary or secondary airports to the core airport compared with China. Multi-airport regions can be divided into nine categories according to available seats and the Herfindahl-Hirschman indexes (HHI), corresponding to different evolution stages of multi-airport regions. Globally, 22 multi-airport regions have developed into a relatively mature stage. In the future, under the premise of ensuring the overall development of multi-airport regions, China should pay attention to the transformation process of other important airports to secondary airports, improve the ground traffic level in the regions to reduce the access time between airports, and guide a high level competition between airports.
Keywords:
自2015年中国发布了“推动共建丝绸之路经济带和21世纪海上丝绸之路(简称‘一带一路’)的愿景与行动”以来,中国社会经济全球化步入了新格局,由此所带来的区域间客货流动尤其是航空运输需求的增长使得全球城市区域和多机场区域(Multi-Airport Area, MAR)的联动式发展成为中国“一带一路”对外开放时代下的显著特征(朱英明, 2003; Fuellhart et al, 2013; 蒋永雷等, 2013; Brueckner et al, 2014; 王姣娥等, 2015)。方便快捷的航空运输可以加速打破区域间的内部隔阂,让中国各大城市更全面、更深入地融入全球产业分工,同时城市区域的发展必然会增加该区域的交通运输需求,所带来的机场设施建设或规模扩张也使得相邻机场间的相互依赖性和制约性越来越强。因此,研究全球多机场区域的空间格局对促进中国多机场区域和全球城市区域的建设和发展,支撑中国“一带一路”愿景的实施具有重要意义。
目前对多机场区域的研究主要集中在两方面:一方面探讨多机场区域内不同因素对旅客选择机场的影响,并衍生出对机场客源范围、市场份额等主题的研究。如Vowles(2001)以价格对多机场区域航空服务的影响为基础,研究发现低成本航空入驻多机场区域会降低整个区域中的机场价格并吸引更大规模的客流。Pels等(2001, 2003)和Hess等(2005, 2006a, 2006b)结合同一区域内机场之间和航空企业之间的竞争,具体分析机场特征、航班特征等因素对多机场区域内旅客机场选择行为的影响。另一方面,随着民航运输网络结构日益复杂,学者们通过对航线网络结构的分析来探讨多机场区域对航线网络的影响。如Bonnefoy等(2008)研究发现,相比于单一机场为节点所形成的航空网络,以多机场区域为节点的航班加权网络整体遵循单幂律分布,说明多机场区域是航空运输系统能够在容量受限节点上扩展的关键。O'Connor等(2016)在总结Matisziw(2010)、Redondi等(2013)研究的基础上,发现单一枢纽机场并不等同于其所在的多机场区域的航空市场发展,而多机场区域会大幅度强化所在大都市区的航空市场,甚至对城镇等级体系和全球航空客流分布产生影响(Derudder et al, 2010; Takebayashi, 2012)。
相较而言,国内有关多机场区域的研究仍旧处于发展初期。主要通过案例研究总结国外多机场区域建设的先进经验和发展模式,并在此基础上对国内多机场区域的发展提出需优化机场资源、区域地面交通网络,建立协调机制等相关建议(张宁, 2007; 张越等, 2007; 陈团生, 2008; 陈兆鹏, 2012; 赵民合, 2013; 屈云茜, 2014; 张莉等, 2015)。另有交通工程类学者采用数量分析方法,以多机场区域内的居民航空出行选择为切入点研究航空客流需求分布、多机场区域内部市场竞争和机场选址等问题,或通过仿真模拟优化多机场区域内部航线及航班时刻资源,意在降低多机场区域的航班延误,提高多机场区域容量(曹学明等, 2010; 胡一竑等, 2011; 周慧艳, 2011; 夏洪山, 2012; 赵闯, 2012)。
尽管学者们在多机场区域形成和发展的理论基础建设中已取得一定成就,已发现多机场区域的发展过程中存在机场分工的问题,且在其发展过程中需对各机场的功能定位进行协调,但均停留在以定性分析为基础的层面上,缺乏对多机场区域总体发展特征的系统定量化研究。本文在对多机场区域空间识别的基础上,从全球各地区多机场区域的数量、机场等级、区域内机场分布距离等方面进行分析,揭示全球多机场区域空间格局。同时通过对多机场区域规模和内部机场竞争强度的测算,划分不同类型的多机场区域。
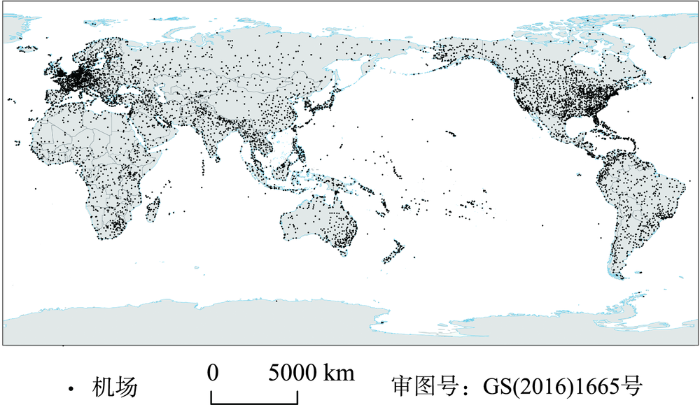
本文的研究范围为全球5大洲(除南极洲),包括北非、撒哈拉以南非洲、拉丁美洲和加勒比、北美、中亚、东亚、东南亚等全球17个次区域,248个国家和地区(图1)。航空数据来源于OAG(Official Aviation Guide),包括近900家全球主要航空公司、4103个民用机场的2016年计划航班数据。
本文通过合理服务半径和可售座位数占比分别划定多机场区域范围,筛选和划分内部机场,并通过对区域内各机场赫芬达尔-赫希曼指数(Herfindahl-Hirschman Indexes,简称HHI)的测算具体识别多机场区域类型。
(1) 多机场区域空间范围划定
从多机场区域形成和发展来看,单一机场可视为多机场区域的特殊形态(Bonnefoy et al, 2008),对多机场区域空间范围的划定可转化为核心机场航空运输有效服务区的界定。而对机场航空运输服务范围的界定中,不同地区的机场服务范围划定标准不一。在中国,机场周边1.5 h出行时间所覆盖的面积被民用航空局认定为可享有有效航空运输服务的范围(徐涛等, 2008)。欧盟委员会认为距离机场100 km或1 h车程时间为其最小服务范围,美国联邦航空管理局将80~120 km作为航空服务有效覆盖范围,而英国民航总局研究认为英国机场有效覆盖范围应超过2 h车程时间(Humphreys et al, 2002; Delaware Valley Regional Planning Commission, 2007; European Commission, 2013)。虽然2 h是一个合理的限制,但无论是在交通基础设施较差的偏远地区,还是在不断发展和扩大的全球城市区域,旅客受到航空基础设施条件的限制或低价格、低延误、高质量的登机服务等因素吸引,选择距离较远的机场出行的情况时常发生,机场服务范围实际上远超过2 h车程时间,对应机场市场份额满足距离衰减定律,但大型机场在2~3 h时间圈中的市场份额占比仍旧明显(Dresner et al, 1996; Lieshout et al, 2016; Sun et al, 2017)。因此,为更精确地对多机场区域进行识别,同时考虑航空自由化引导下航空服务范围的扩大化,本文以3 h车程时间来识别多机场区域的空间范围。
选取2016年OAG的计划航班信息中年可售座位数大于60万的机场作为全球航空市场提供民用航空服务的重要机场(O'Connor et al, 2016)。在此基础上,按机场可售座位数大小降序排列所有机场,依次将排名靠前的机场作为O点,同时将排在此机场之后的所有剩余机场作为D点,依次进行循环计算。例如,首次计算中将年可售座位数量最大的机场作为O点,位列其后且可售座位数量大于60万的剩余899个机场均作为D点,在第二次计算中将年可售座位数量位列第二的机场作为O点,剩余898个机场则作为D点。通过Python2.7.13编程,并调用OpenStreet API查询OD机场之间的车程时间,一旦识别到两个机场之间的车程时间低于3 h,则将这两个机场纳入为同一个多机场区域。在此序列中,所有机场均仅归并一次,不再重复分配。
(2) 机场等级体系识别
为具体划分各多机场区域内部机场等级,构建科学的等级体系,本文分别计算区域内各机场可售座位数的占比,并以此作为识别主要机场(primary airports)、辅助机场(secondary airports)的依据。
式中:
(3) 多机场区域类型划分
为具体分析各多机场区域内的机场竞争,区分多机场区域的不同类型,本文引入产业经济学中赫芬达尔-赫希曼指数(HHI),用它来反映多机场区域内客运市场集中度和机场间竞争强度:
式中:
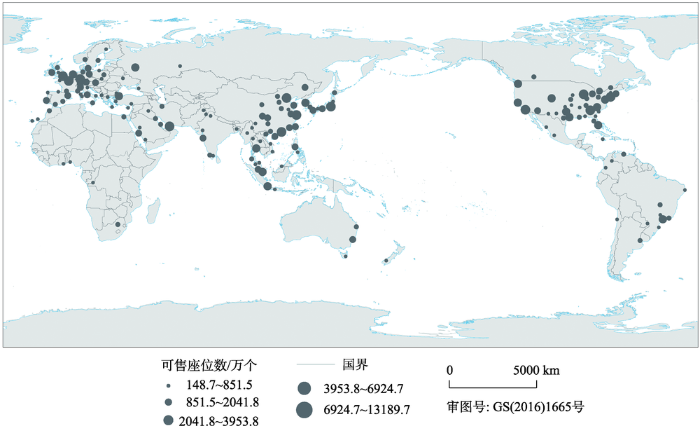
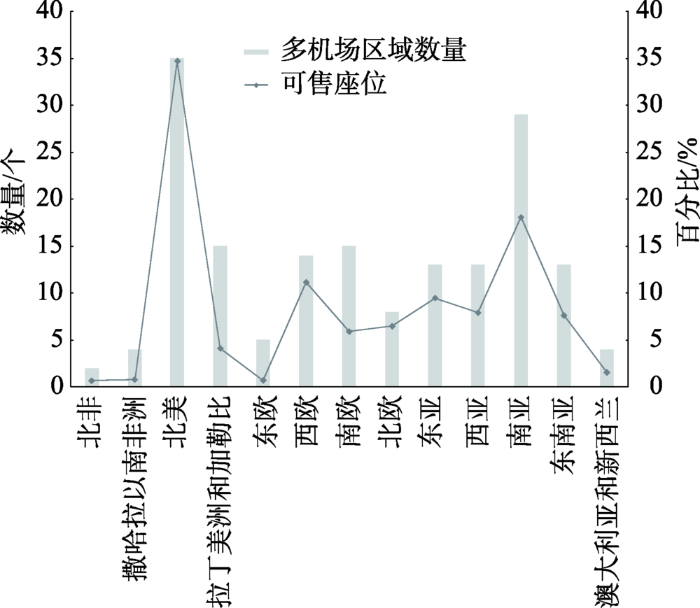
全球共有170个多机场区域,涉及479个重要机场,提供全球约70%的可售座位。从数量上来看,除北美、南亚分别拥有35个和29个多机场区域外,拉丁美洲和加勒比、西欧、南欧、东亚、西亚、东南亚均有超过10个以上多机场区域(图2、图3)。但从多机场区域整体航空运输来看,客运市场重心仍旧集中在北美、西欧、南亚等3个次区域,2016年对应提供12亿个、3.8亿个和6.2亿个可售座位,三者占比分别为34.7%、11.2%和18.1%。
图2 2016年全球多机场区域空间分布图
Fig.2 Spatial distribution of multi-airport regions (MARs) in 2016 based on 3-hours drive distance
图3 2016年多机场区域数量和可售座位比重
Fig.3 The number of multi-airport regions (MARs) in the world and available seats percentages, 2016
从各国多机场区域的发展建设来看,除美、英、法、德、意等传统意义上的民航大国之外,亚洲的中国、日本、泰国和非洲的巴西等国均在多机场区域航空运输市场中占有重要的地位,其中位列前茅的美国和中国的首位优势明显(表1)。从多机场区域和可售座位数量来看,美国和中国分别拥有多机场区域32个和20个,对应年可提供年可售座位数量11.2亿个和6.13亿,分别占全球多机场区域可售座位数量的29.74%和16.28%,全球半数以上的多机场区域形成于这两个国家。尽管如此,从各国多机场区域内平均机场数量来看,中美两国多机场区域平均由3个机场构成,但英国、德国等欧洲国家的多机场区域平均机场数量分别为6个、4个。同时,相比于英国、德国和阿拉伯联合酋长国,中美两国多机场区域平均可售座位数量均位居其后,这也在一定程度上说明虽然中美在基于国土、人口和经济等方面建立了整体的多机场区域发展优势,但各多机场区域间不均衡发展明显,处于起步阶段的小规模多机场区域较多。这类小规模多机场区域整体客运市场水平较低,核心机场所产生的客流“阴影”效应明显,内部机场之间缺乏有效竞争,特别是在年均可售座位量仅为0.14亿个的29个跨界多机场区域中。但不容忽视的是,20世纪70年代后全球航空自由化的推行下,例如美国-加拿大天空开发合约、欧洲国家间的《申根合约》、圣地亚哥-蒂华纳双边机场客运大楼(Cross Border Xpress)等领空开发协议和机场快速通关口岸的出现缩减了旅客通过陆路通关时长,同时受到航班班次、价格、直飞航线、飞行时间等因素的影响,进一步提高了同一服务范围内的旅客选择其他国家机场出行的可能性,不仅成为这种小规模多机场区域发展契机,也从航空旅客的角度展示了“真实”的跨境一体化(Elwakil et al, 2013; Paliska et al, 2016)。
表1 2016年多机场区域可售座位数排名前10的国家
Tab.1 Top 10 countries of multi-airport regions (MARs)' available seats, 2016
| 按可售 座位数排序 | 国家 | 可售座位数 /万个 | 多机场区域 数量/个 | 机场 数量/个 | 区域内平均机场 数量/个 | 多机场区域平均 可售座位数/万个 |
|---|---|---|---|---|---|---|
| 1 | 美国 | 111959 | 32 | 101 | 3 | 3499 |
| 2 | 中国 | 61282 | 20 | 60 | 3 | 3064 |
| 3 | 英国 | 15981 | 3 | 19 | 6 | 5327 |
| 4 | 日本 | 15967 | 6 | 23 | 4 | 2661 |
| 5 | 德国 | 14750 | 4 | 17 | 4 | 3688 |
| 6 | 法国 | 9733 | 4 | 14 | 4 | 2433 |
| 7 | 意大利 | 9354 | 6 | 19 | 3 | 1559 |
| 8 | 巴西 | 8941 | 7 | 15 | 2 | 1277 |
| 9 | 泰国 | 8370 | 4 | 9 | 2 | 2093 |
| 10 | 阿拉伯联合酋长国 | 8336 | 1 | 4 | 4 | 8336 |
| 合计 | 264674 | 87 | 281 | 3 | 3042 | |
| 占多机场区域比重/% | 70.3 | 51.2 | 56.5 | — | — | |
| 占全球航空运输比重/% | 47.4 | — | 6.8 | — | — | |
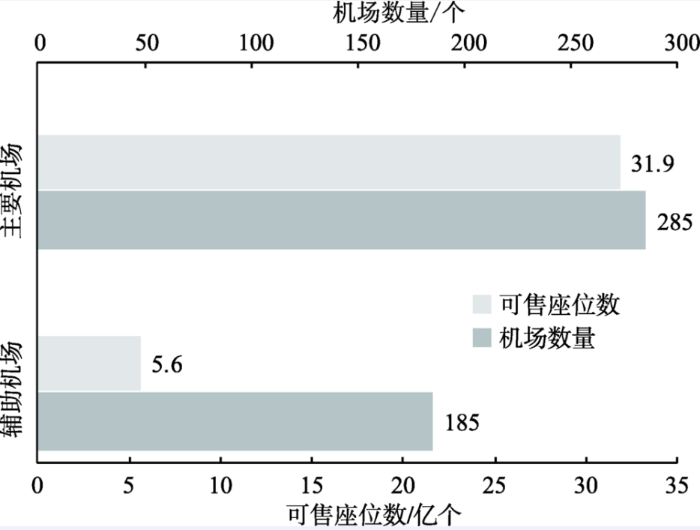
对比多机场区域内各等级机场发展,主要机场平均规模远大于辅助机场。全球170个多机场区域中共有285个主要机场,185个辅助机场。其中,主要机场、辅助机场分别提供了31.9亿个和5.6亿个可售座位数,对应占全球多机场区域可售座位总数的84.9%、14.9%(图4)。除西欧的主要机场和辅助机场可售座位比值最小,仅为1.3之外,北非、撒哈拉以南非洲、南欧、西亚、东南亚、澳大利亚和新西兰等6个次区域中的主要机场和辅助机场可售座位比值均大于10(图5)。
图4 2016年各次区域主要机场和辅助机场指标
Fig.4 Indices of primary and secondary airports in different regions of the world, 2016
图5 各次区域主要机场和辅助机场的指标数值比
Fig.5 Ratios of the indices of primary and secondary airports in different regions of the world
各次区域之间的主要机场和辅助机场数量比差异较大,南欧、澳大利亚和新西兰、西亚等次区域均缺少中间层级的辅助机场。全球多机场区域主要机场和辅助机场的数量比为1:1.5,其中南欧、西亚、澳大利亚和新西兰等6个次区域的主、辅机场间数量比值较大(≥3),东欧、拉丁美洲和加勒比次之(1.5~3),北美、北欧、西欧、东亚、南亚主要机场和辅助机场数量比值低于平均比值(<1.5)。
对比各多机场区域内机场数量及其等级体系,根据主要机场与非主要机场之间相互作用的主要方式,将多机场区域发展模式分为枢纽式和集群式两种,进一步细分为“一主多辅”“一主两辅”“一主一辅”和“双核”“多核”等5种模式(王姣娥等, 2008; 屈云茜, 2014)。在2016年多机场区域可售座位数排名前10的国家中,除德国外,其他各国集群式多机场区域数量占比均不低于50%,其中以2个主要机场协同多个辅助机场的“双核”发展模式最为突出(表2)。在枢纽式多机场区域中,英国以伦敦希思罗机场为核心,伦敦卢顿机场、伯明翰机场、曼彻斯特国际机场等8大机场为辅助,形成了最为复杂的伦敦多机场区域。虽然伦敦多机场区域的非主要机场数量是主要机场数的10倍,但其所提供的可售座位数不到伦敦希思罗机场2倍,主要机场的首位优势明显。在集群式多机场区域中,除德国、法国外,各国主要机场不仅仅在数量上与非主要机场达到均衡,对应可售座位数占比超过90%。
表2 可售座位数量排名前10的国家多机场区域发展模式一览表
Tab.2 Multi-airport regions (MARs)' development models of top 10 countries of available seats
| 指标 | 美国 | 中国 | 英国 | 日本 | 德国 | 法国 | 意大利 | 巴西 | 泰国 | 阿拉伯联合酋长国 | |
|---|---|---|---|---|---|---|---|---|---|---|---|
| 枢纽式多机场区域数量/个 | 12 | 10 | 1 | 2 | 3 | 0 | 3 | 2 | 1 | 0 | |
| 其中: | 一主多辅 | 5 | 1 | 1 | 1 | 1 | 0 | 2 | 0 | 0 | 0 |
| 一主两辅 | 3 | 4 | 0 | 0 | 1 | 0 | 0 | 1 | 0 | 0 | |
| 一主一辅 | 4 | 5 | 0 | 1 | 1 | 0 | 1 | 1 | 1 | 0 | |
| 非主要机场数量:主要机场数量 | 29:12 | 17:10 | 10:1 | 7:2 | 12:3 | — | 10:3 | 3:2 | 1:1 | — | |
| 主要机场可售座位数所占比重/% | 77.2 | 84.5 | 39.2 | 70.6 | 65.6 | — | 58.8 | 80.2 | 82.8 | — | |
| 集群式多机场区域数量/个 | 20 | 10 | 2 | 4 | 1 | 4 | 3 | 5 | 3 | 1 | |
| 其中: | 双核 | 16 | 8 | 1 | 3 | 1 | 4 | 3 | 5 | 2 | 1 |
| 多核 | 4 | 2 | 1 | 1 | 0 | 0 | 0 | 0 | 1 | 0 | |
| 非主要机场数量:主要机场数量 | 16:44 | 11:22 | 1:5 | 5:9 | 4:2 | 6:8 | 1:6 | 1:10 | 0:7 | 2:2 | |
| 主要机场可售座位数所占比重/% | 90.6 | 91.6 | 91.5 | 95.0 | 74.7 | 77.3 | 90.7 | 90.5 | 100 | 92.2 | |
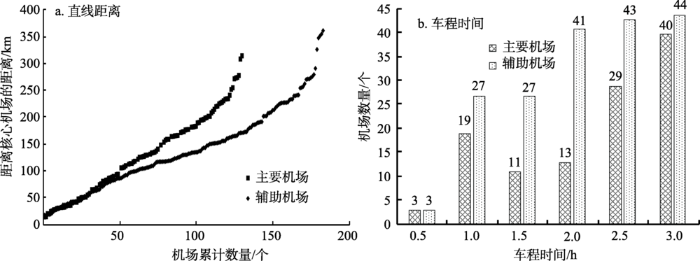
对比各多机场区域内机场间距离,全球多机场区域中的其他主要机场、辅助机场距离核心机场的直线距离分别以150 km和200 km为最大极限,对应平均车程时间均为2 h左右。以0.5 h等时圈分析主要机场、辅助机场的数量可知(图6),仅22个其他主要机场布局在邻近核心机场1 h车程内,占比19.1%,另有超过3倍的其他主要机场布局在距离核心机场2~3 h的车程范围。同时,近70%的辅助机场整体倾向于布局在距离核心机场1.5~3 h车程范围。由此说明除了在空港基础设施较为完备的欧美,全球大部分多机场区域内其他重要机场距离核心机场的车程大于1.5 h。同时,若以核心机场的辐射半径来划定多机场区域,综合全球各地区地面交通水平,核心机场的辐射半径设定为200 km左右较为合理。
图6 多机场区域其他主要机场(辅助机场)与核心机场的距离分析
Fig.6 Distance between other primary (secondary) airports and core airports in multi-airport regions (MARs)
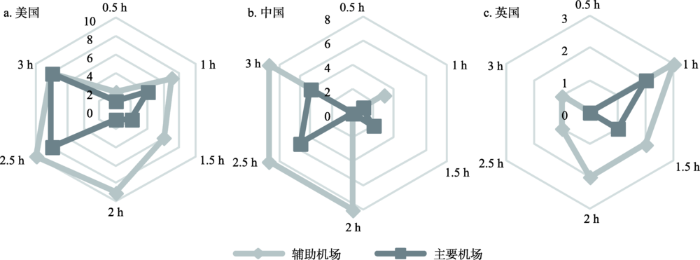
从国家尺度看,中国多机场区域布局模式与美国更为相似。中国多机场区域中其他主要机场、辅助机场距离核心机场的平均车程时间为2.1 h,美国对应的平均车程时间分别为1.9 h、1.8 h,而英国对应的平均车程时间仅为1.1 h、1.6 h(图7)。究其原因,可能得益于战后保留的机场设施和道路交通网络的建设,英美两国多机场区域内机场布局相对紧凑,特别是英国多机场区域内其他主要机场、辅助机场到达核心机场的时间相比中国减少约0.5~1 h。
图7 美国(a)、中国(b)和英国(c)多机场区域其他主要机场(辅助机场)与核心机场的车程时间
Fig.7 Temporal distance between other primary (secondary) airports and core airports in the United States (a), China (b), and the UK (c)
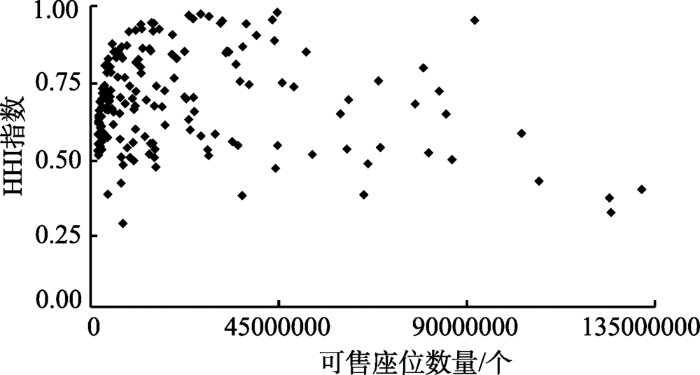
对比各多机场区域指数与可售座位数,分别 基于HHI指数、可售座位数的1/3阈值,可将整个 多机场区域划分为9个类型(表3)(Hansen et al, 1995)。
表3 基于可售座位数和HHI指数的多机场区域类型划分方案
Tab.3 Classification scheme for multi-airport regions (MARs) based on available seats and Herfindahl-Hirschman index (HHI)
| 可售座位数 <4500万 | 可售座位数为 4500万~9000万 | 可售座位数 ≥9000万 | |
|---|---|---|---|
| HHI<0.33 | 低—低 | 中—低 | 高—低 |
| 0.33≤HHI<0.67 | 低—中 | 中—中 | 高—中 |
| HHI≥0.67 | 低—高 | 中—高 | 高—高 |
如图8显示大部分多机场区域集中在“低—中”、“低—高”两个类型,占多机场区域数量的85.3%,这些多机场区域表现为小型客运规模下的中低水平竞争。整个多机场区域的客运市场仍旧表现为由单一核心机场或1~2个主要机场占据绝对优势,对应于多机场区域的5个演化阶段中的Ⅱ或Ⅲ阶段(Bonnefoy et al, 2008)。说明部分区域内虽然已经出现辅助机场或其他重要机场,但这些机场并没有成长为可与核心机场相抗衡的主要机场。因此,整个多机场区域的航空市场服务仍旧呈现出核心—边缘的状态,这也是受到当地较低的航空需求水平的影响。同样,随着地区对外航空 联系和航空需求水平的提高,借助于已有的空港 设施条件,这些中低水平的多机场区域能得到快速发展。
图8 多机场区域HHI指数与可售座位数对比分析
Fig.8 Herfindahl-Hirschman index (HHI) and the number of available seats of multi-airport regions (MARs)
表4列出了全球170个多机场区域的划分结果,可售座位数量级别在中级以上的“中—低”、“中—中”、“中—高”、“高—低”、“高—中”、“高—高”6个类型中,除亚特兰大(Atlanta)多机场区域外,剩余的22个多机场区域中达拉斯-沃思堡(Dallas-Fort Worth)多机场区域、夏洛特-罗利-达勒姆(Charlotte-Raleigh-Durham)多机场区域、雅加达(Jakarta)多机场区域、北京(Beijing)多机场区域等4个多机场区域的HHI指数均不超过0.75,其余的均低于0.6。说明这些多机场区域不仅仅客运市场规模达到较高水平,区域内的非核心机场也在一定程度上能和核心机场进行竞争,可将其视为发展较成熟的多机场区域。这也从侧面证明随着全球各地区航空需求的增加,原有的单一机场航空服务模式将逐渐转化为由多个机场所组成的区域型航空服务模式,这也是推动全球航空服务可持续发展的着力点,而已经形成的多机场区域内部终将通过竞争与协调达到较高水平的动态均衡(Fasone et al, 2012)。
表4 基于可售座位数和HHI指数的不同类别的多机场区域名单
Tab.4 Multi-airport regions (MARs) of different categories based on available seats and Herfindahl-Hirschman index(HHI)
| 类别 | 多机场区域个数 | 多机场区域名单 |
|---|---|---|
| 高—低 | 4 | 香港-广州-深圳(Hong Kong-Guangzhou-Shenzhen)、上海-杭州(Shanghai-Hangzhou)、伦敦(London)、纽约-纽瓦克-费城(New York-Newark-Philadelphia) |
| 高—中 | 1 | 洛杉矶(Los Angeles) |
| 高—高 | 1 | 亚特兰大(Atlanta) |
| 中—低 | 2 | 法兰克福(Frankfurt)、巴尔的摩-华盛顿(Baltimore-Washington) |
| 中—中 | 14 | 西雅图-温哥华-波特兰(Seattle-Vancouver-Portland)、北京(Beijing)、巴黎(Paris)、东京(Tokyo)、首尔(Seoul)、曼谷(Bangkok)、伊斯坦布尔(Istanbul)、迪拜-阿布扎比(Dubai-Abu Dhabi)、芝加哥(Chicago)、达拉斯-沃思堡(Dallas-Fort Worth)、旧金山(San Francisco)、夏洛特-罗利-达勒姆(Charlotte-Raleigh-Durham)、迈阿密-劳德尔堡(Miami-Fort Lauderdale)、休斯敦-奥斯丁(Houston-Austin) |
| 中—高 | 1 | 雅加达(Jakarta) |
| 低—低 | 2 | 米兰(Milano)、广岛-松山(Hiroshima-Matsuyama) |
| 低—中 | 97 | 地拉那-普里什蒂纳(Tirana-Pristina)、布宜诺斯艾利斯(Buenos Aires)、伊瓜苏(Foz Do Iguacu)、布里斯班-戈尔德科斯特(Brisbane-Coolangatta)、霍巴特-朗斯斯顿(Hobart-Launceston)、维也纳-布达佩斯(Vienna-Budapest)、巴林-达曼(Bahrain-Dammam)、圣保罗(Sao Paulo)、里约热内卢(Rio De Janeiro)、累西腓(Recife)、弗卢里亚诺波利斯-纳韦甘蒂斯(Florianopolis-Navegantes)、里贝朗普雷图-乌贝蓝迪亚(Ribeirao Preto-Uberlandia)、米里-斯里巴加湾市(Miri-Bandar Seri Begawan)、布加斯-瓦尔纳(Bourgas-Varna)、曼德勒-良乌(Mandalay-Bagan)、蒙特利尔-渥太华(Montreal-Ottawa)、卡尔加里-艾德蒙顿(Calgary-Edmonton)、安托法加斯塔-卡拉马(Antofagasta-Calama)、厦门-福州(Xiamen-Fuzhou)、青岛(Qingdao)、南京-合肥(Nanjing-Hefei)、海口-三亚(Haikou-Sanya)、哈尔滨-长春(Harbin-Changchun)、兰州-西宁(Lanzhou-Xining)、太原-石家庄(Taiyuan-Shijiazhuang)、呼和浩特(Hohhot)、徐州-盐城(Xuzhou-Yancheng)、芒市-腾冲(Mangshi-Tengchong)、加拉加斯-卡塔赫纳(Caracas-Cartagena)、布卡拉曼加-库库塔(Bucaramanga-Cucuta)、布拉柴维尔-金萨沙(Brazzaville-Kinshasa)、拉纳卡-埃阿坎(Larnaca-Nicosia)、尼斯-马赛(Nice-Marseille)、图卢兹-波尔多(Toulouse-Bordeaux)、阿雅克肖-巴斯蒂亚(Ajaccio-Bastia)、柏林(Berlin)、阿克拉-洛美(Accra-Lome)、塞萨洛尼基-斯科普里(Thessaloniki-Skopje)、赫拉克利翁-干尼亚(Heraklion-Chania)、泽西-格恩西(Jersey-Guernsey)、库奇(Kochi)、拉合尔-查漠(Lahore-Jammu)、昌迪加尔-台拉登(Chandigarh-Dehra Dun)、马杜赖-蒂鲁吉拉伯利(Madurai-Tiruchirappalli)、日惹-三宝垄(Yogyakarta-Semarang)、德黑兰(Teheran)、巴格达-纳贾夫(Baghdad-Najaf)、都伯林(Dublin)、罗马(Rome)、卡塔尼亚-巴勒莫(Catania-Palermo)、巴里-布林迪西(Bari-Brindisi)、奥尔比亚-阿尔盖罗(Olbia-Alghero)、蒙特哥贝-金斯敦(Montego Bay-Kingston)、大阪(Osaka)、福冈(Fukuoka)、仙台-秋田-新泻(Sendai-Akita-Niigata)、乌隆-万象-孔敬(Udon Thani-Vientiane-Khon Kaen)、槟城-合艾(Penang-Hat Yai)、哥达巴鲁-瓜拉丁加奴(Kota Bahru-Kuala Terengganu)、库利阿坎-马萨特蓝(Culiacan-Mazatlan)、卡萨布兰卡-马拉喀什(Casablanca-Marrakech)、皇后镇-达尼丁(Queenstown International-Dunedin)、卡利博-伊洛伊洛(Kalibo-Iloilo)、华沙(Warsaw)、克拉科夫-弗罗茨瓦夫(Krakow-Wroclaw)、格旦斯克-加里宁格勒(Gdansk-Kaliningrad)、里斯本-波尔图(Lisbon-Porto)、莫斯科(Moscow)、克拉斯诺达尔-阿那帕(Krasnodar-Anapa)、艾卜哈-基赞(Abha-Gizan)、马拉加-塞维利亚(Malaga-Sevilla)、阿利坎特-巴伦西亚(Alicante-Valencia)、特内里费(Tenerife)、兰萨罗特-富埃特文图拉岛(Arrecife-Fuerteventura)、毕尔巴鄂-奥威多(Bilbao-Aviles)、圣地亚哥-拉科鲁尼亚(Santiago-La Coruna)、吕勒奥-于默真(Lulea-Umea)、苏黎世-日内瓦(Zurich-Geneva)、伊兹米尔-博德鲁姆(Izmir-Bodrum)、阿达那-加齐安特普(Adana-Gaziantep)、爱丁堡-格拉斯哥(Edinburgh-Glasgow)、利物浦-利兹-曼彻斯特(Liverpool-Leeds-Manchester)、底特律(Detroit)、纳什维尔(Nashville)、堪萨斯城-奥马哈(Kansas City-Omaha)、印地安那波利斯-辛辛那提(Indianapolis-Cincinnati)、匹兹堡-哥伦布(Pittsburgh-Columbus)、杰克逊维尔-好望角(Jacksonville-Savannah)、俄克拉荷马城-塔尔萨(Oklahoma City-Tulsa)、孟菲斯-小石城(Memphis-Little Rock)、查尔斯顿-默特尔比奇(Charleston-Myrtle Beach)、奥尔巴尼-锡拉库扎(Albany-Syracuse)、得梅因-锡特拉皮兹(Des Moines-Cedar Rapids)、彭萨科拉-巴拿马城(Pensacola-Panama City)、米德兰-拉伯克(Midland-Lubbock)、本顿维尔-斯普林菲尔德(Bentonville-Springfield)、芽庄-达拉(Nha Trang-Dalat) |
| 低—高 | 48 | 悉尼(Sydney)、达卡(Dhaka)、巴西利亚(Brasilia)、多伦多(Toronto)、成都(Chengdu)、重庆(Chongqing)、郑州(Zhengzhou)、贵阳(Guiyang)、南宁(Nanning)、丽江(Lijiang)、卡利(Cali)、哥本哈根(Copenhagen)、开罗(Cairo)、慕尼黑(Munich)、汉堡(Hamburg)、孟买(Mumbai)、艾哈迈达巴德(Ahmedabad)、威尼斯(Venice)、扎幌(Sapporo)、科威特(Kuwait)、吉隆坡(Kuala Lumpur)、瓜达拉哈拉(Guadalajara)、阿姆斯特丹(Amsterdam)、拉各斯(Lagos)、奥斯陆(Oslo)、伊斯兰堡-沙瓦(Islamabad-Peshawar)、马尼拉(Manila)、叶卡特琳堡(Yekaterinburg)、吉达(Jeddah)、麦迪纳(Madinah)、新加坡(Singapore)、约翰内斯堡(Johannesburg)、釜山(Busan)、巴塞罗那(Barcelona)、斯德哥尔摩(Stockholm)、台北(Taipei)、普吉-喀比(Phuket-Krabi)、清迈(Chiang Mai)、基辅(Kiev)、丹佛(Denver)、菲尼克斯(Phoenix)、波士顿(Boston)、坦帕(Tampa)、新奥尔良(New Orleans)、圣安托万(San Antonio)、埃尔帕索(El Paso)、河内(Hanoi)、岘港(Da Nang) |
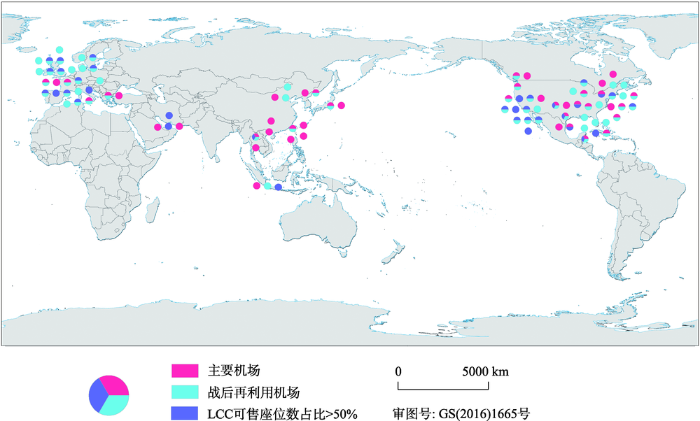
这种较高水平动态平衡的形成离不开非核心机场的发展,特别是辅助机场竞争力的提升(Lancaster et al, 2004; Zietsman et al, 2014)。而航空运输市场需求则是决定非核心机场发展的主要因素,与社会经济诸要素有着密切的联系。对比IAIA(International Air Transport Association)中国际大都市区(Metropolitan Area)名单,22个发展较为成熟的多机场区域均拥有至少一个国际大都市区作为腹地,在这些国际大都市区足够的人口和国民经济收入下能够保证除核心机场外其他非核心机场旅客客流的生成。如图9所示,这些多机场区域所包含的82个非核心机场中约有80%的机场原属军用机场,其中61个建于二战结束前,战后遗留的机场设施为多机场区域形成提供了基础,节约了机场设施建设的成本。在环境、资金、土地等各方面因素的制约下,建设成本的减少为非核心机场的快速发展提供了便利。其次,从航空运输主体来看,这些非核心机场中近半数机场的低成本航空公司所提供的可售座位数量所占比重超过50%。航空公司作为航空运输系统的主体,决定了各机场航空运输服务的提供。低成本航空公司入驻所带来的价格优势提高了非核心机场对选择核心机场出行的旅客吸引力,特别是以休闲旅游为出行目的的中低收入旅客,进一步挖掘了客运服务市场的潜在需求,为其他非核心机场的发展提供了动力。虽然各多机场区域内部机场的对外通航市场仍旧以其所属区域为主,但相比于非核心机场,特别是其他重要机场的高比重的单一次区域航空运输服务,核心机场倾向于低比重的多区域服务。核心机场扩大化的航空服务市场,会为其他非核心机场的差异化、专一化市场服务提供空间,使得区内机场之间合理分工和优势互补成为可能。
图9 全球22个发展较成熟的多机场区域基本情况
Fig.9 General information of 22 mature multi-airport regions (MARs) in the world
本文采用2016年OAG的计划航班数据,重点分析了全球多机场区域的空间格局,并根据HHI指数和可售座位数对多机场区域进行类型划分,由此总结归纳发展较为成熟的多机场区域的内在特征,探讨如何促进非核心机场的快速成长,进而达到区域内机场间的高水平竞争。研究结果表明:
(1) 基于3 h车程时间识别下,全球共有170个多机场区域,涉及479个重要机场,主要分布在北美、南亚。除民航超级大国美国及传统意义上民航较为发达的欧洲国家如英、法、德、意等之外,亚洲的中国、日本、泰国、南美洲的巴西等国均占有重要的地位。中美两国分别拥有多机场区域20个和32个,对应提供年可售座位量11.2亿个和6.13亿个,远超位居世界第3位的英国。
(2) 从机场等级体系来看,各次区域之间的主要机场和辅助机场数量比差异较大,主要机场平均规模远大于辅助机场。全球170个多机场区域中共有285个主要机场,185个辅助机场,对应占全球多机场区域可售座位总数的84.9%、14.9%。从主要机场和辅助机场的数量比来看,全球多机场区域两者的平均比例为1:1.5,南欧、澳大利亚和新西兰、西亚等次区域主要机场和辅助机场数量比值最大(≥3),缺少中间层级的辅助机场。
(3) 得益于战后保留的机场设施和道路交通的快速发展,英美两国多机场区域内机场布局相对紧凑,特别是英国多机场区域内其他主要机场、辅助机场到达核心机场的时间相对中国减少了约0.5~1 h。
(4) 在根据HHI指数和可售座位数对比结果所划分的9个类型中,全球多机场区域集中表现为“低—中”、“低—高”、“中—中”、“高—低”4个类型。同时,对比Bonnefoy等(2008)所提出的多机场区域演化阶段,目前共有22个多机场区域发展较成熟。这些成熟化的多机场区域均离不开非核心机场的发展,而庞大的客源市场、可利用的机场基础设施、低成本航空公司的入驻和核心机场扩大化的航空服务市场是催化非核心机场快速发展的重要因素。
与以de Neufville(1984, 1995)、Bonnefoy等(2008)和O'Connor等(2016)为代表的学者对全球多机场区域识别的研究成果相比,本文在对多机场区域空间范围界定过程中综合考虑了不同国家或地区的社会经济发展和交通基础设施水平,更具普遍性。同时通过对发展较成熟的多机场区域分析,对非核心机场发展的影响因素进行了探讨,然而由于难以获取多机场区域每个发展阶段的数据,本文未能对多机场区域出现、形成和发展的影响因素进行系统研究,虽然基于HHI指数对各多机场区域内的机场竞争强度进行了初步分析,尚不能表现多机场区域内各机场间的竞争和合作关系。未来研究中可从航空市场重叠、各机场间的价格影响等方面来深入探讨多机场区域间或区域内各机场间的关系和相互影响。与此同时,跟踪多机场区域内外发展变化,深入探讨不同经济地理要素对多机场区域各阶段发展过程所产生的影响。
The authors have declared that no competing interests exist.
| [16] |
On coordinated development of China' s regional multi-airport compound system [J].https://doi.org/10.3969/j.issn.1671-2129.2011.02.011 URL [本文引用: 1] 摘要
我国区域多机场复合系统发展存在区域内总航空运输需求不足,新机场航空运输量不足,非主要机场运输量不稳定,区域多机场分配运量难等现状。大都市区在确定是否发展多机场系统以及在规划发展多机场复合系统时,要从始发旅客需要达到一定的阀值、大力发展低成本航空公司、多机场系统分工协作等方面考虑发展策略。
|
| [17] |
中国城市密集区航空运输联系研究 [J].The study of air transportation links among urban compact district of Huninghang [J]. |
| [18] |
Scalability of the air transportation system and development of multi-airport systems: A worldwide perspective[R]. Massachusetts Institute of |
| [19] |
City-pairs versus airport-pairs: A market-definition methodology for the airline industry [J].https://doi.org/10.1007/s11151-012-9371-7 URL [本文引用: 1] 摘要
This paper provides a methodology for deciding which airports warrant grouping in multi-airport metropolitan areas. The methodology is based on the comparability of incremental competition effects from nearby airports on average fares at a metropolitan area’s primary airport. Results from a quarterly panel data set for the period 2003–2009 provide strong evidence that city-pairs, rather than airport-pairs, are the appropriate market definition for analyses of passenger air transportation involving many (but not all) large metropolitan areas. Based on the proposed method, we offer a recommended list of airports that should be grouped when creating city-pairs for the analysis of competition in the US domestic airline industry.
|
| [20] |
Planning for multiple airports in a metropolitan region [J]. |
| [21] |
Management of multi-airport systems: A development strategy [J].https://doi.org/10.1016/0969-6997(95)00035-6 URL [本文引用: 1] |
| [22] |
FAA regional air service demand study. Task B: Forecast of passengers, operations and other activities[R] . |
| [23] |
The impact of low-cost carriers on airport and route competition [J]. |
| [24] |
Transborder demand leakage and the US-Canadian air passenger market [J].https://doi.org/10.1016/j.tre.2013.01.005 URL [本文引用: 1] 摘要
The US–Canadian air traffic market is one of the largest international markets in the world – estimated at 23million passengers in 2008. The market is currently regulated by an “Open Skies” agreement, which eliminated all restrictions on the frequency of flights, the aircraft flown, and the fares charged on transborder routes. Although there is evidence that consumers have benefited from the Open Skies agreement, there is also evidence that many passengers have chosen to avoid transborder services, and instead fly from airports in US border cities and cross the border by surface transportation. This paper uses a passenger demand model to determine the scope of this “leakage” from transborder routes. In addition, transborder airfares are compared to US domestic airfares to determine whether transborder fares are “excessive”, a potential cause of the leakage. Results show a substantial amount of leakage estimated at over 4.7million passengers for 2008. Furthermore, after controlling for the impact of route-specific variables, such as market concentration, average fares are 28.2% higher in the transborder market. Finally, policy implications and the future of the transborder air passenger market are discussed.
|
| [25] |
Case No COMP/M.6663-Ryanair/Aer Lingus III [R/OL]. |
| [26] |
Route-level passenger variation within three multi-airport regions in the USA [J].https://doi.org/10.1016/j.jtrangeo.2013.06.012 URL [本文引用: 1] 摘要
Many large conurbations have more than one airport that serves the air transport needs of their region. This paper models the relative route level within three multiple-airport regions (MARs) in the United States: Boston, Washington, and San Francisco. Although passenger-level surveys provide the researcher with the most detailed information on how travelers choose between airports and airlines, as well as geographic information about both the start and end of a journey, such data are often difficult or expensive to obtain. Here, we use freely available aggregate data from the U.S. Department of Transportation and linear models to assess whether passenger levels on routes involving airports within the three cities vary in relation to known correlates of airport choice. The results show that they do, and that variables such as the outhwest effect, fare, and market size, among others, help explain the complexity of air-travel patterns within MARs. Importantly, the results point to the difficulty in easily classifying cities or airport pairs into simple groups. We conclude that aggregate data can be used to establish initial evidence of the strength of a functional multi-airport region and, as such, may prove useful in informing individual traveler-based research and as inputs to policy decisions.
|
| [27] |
Multiple airport systems in the United States: Current status and future prospects [ |
| [28] |
Mixed logit modelling of airport choice in multi-airport regions [J].https://doi.org/10.1016/j.jairtraman.2004.09.001 URL [本文引用: 1] 摘要
This paper presents an analysis of the choice of airport by air travellers departing from the San Francisco Bay (SF-B) area. The analysis uses the mixed multinomial logit model, which allows for a random distribution of tastes across decision makers. To our knowledge, this is the first application using this model form in the analysis of airport choice. The results indicate that there is significant heterogeneity in tastes, especially with respect to the sensitivity to access time, characterised by deterministic variations between groups of travellers (business/leisure, residents/visitors) as well as random variations within groups of travellers. The analysis reinforces earlier findings showing that business travellers are far less sensitive to fare increases than leisure travellers, and are willing to pay a higher price for decreases in access time (and generally also increases in frequency) than is the case for leisure travellers. Finally, the results show that the random variation between business travellers in terms of sensitivity to access time is more pronounced than that between leisure travellers, as is the case for visitors when compared to residents.
|
| [29] |
Airport airline and access mode choice in the San Francisco Bay area [J].https://doi.org/10.1111/j.1435-5957.2006.00097.x URL [本文引用: 1] 摘要
Abstract. In this article, we present an analysis of air travel choice behaviour in the San Francisco Bay area. The analysis extends existing work by considering the simultaneous choice by passengers of a departure airport, an airline, and an access mode. The analysis shows that several factors, most notably flight frequency and in-vehicle access time, have a significant overall impact on the attractiveness of an airport, airline and access mode combination, while factors such as fare and aircraft size have a significant effect only in some of the population subgroups. The analysis highlights the need to use separate models for resident and non-resident travellers, and to segment the population by journey purpose. The analysis also shows that important gains can be made through the inclusion of airport-inertia variables, and through using a nonlinear specification for the marginal returns of increases in flight frequency. In terms of model structure, the results suggest that the use of the different possible two-level nested logit models leads to modest, yet significant gains in model fit over the corresponding multinomial logit models, which already exhibit very high levels of prediction performance.
|
| [30] |
Exploring the potential for cross-nesting structures in airport-choice analysis: A case study of the Greater London area [J].https://doi.org/10.1016/j.tre.2005.09.001 URL [本文引用: 1] 摘要
The analysis of air-passengers choices of departure airport in multi-airport regions is a crucial component of transportation planning in many large metropolitan areas, and has been the topic of an increasing number of studies over recent years. In this paper, we advance the state of the art of modelling in this area of research by making use of a Cross-Nested Logit (CNL) structure that allows for the joint representation of inter-alternative correlation along the three choice dimensions of airport, airline and access-mode. The analysis uses data collected in the Greater London area, which arguably has the highest levels of inter-airport competition of any multi-airport region; the authors of this paper are not aware of any previous effort to jointly analyse the choice of airport, airline and access-mode in this area. The results of the analysis reveal significant influences on passenger behaviour by access-time, access-cost, flight-frequency and flight-time. A structural comparison of the different models shows that the cross-nested structure offers significant improvements over simple Nested Logit (NL) models, which in turn outperform the Multinomial Logit (MNL) model used as the base model.
|
| [31] |
Emergence and impact of secondary airports in the United States [J].https://doi.org/10.2514/6.2004-6497 URL PMID: 15202111 [本文引用: 1] 摘要
As major airports in the United States have reached their maximum capacity and became congested, available capacity at surrounding airports has been utilized by the emergence of secondary airports. Given the expectation of a larger number of operations inthe National Airspace System (NAS) in the upcoming years, this trend of secondary airports emergence is likely to strengthen. In order to understand the dynamics of the regional airport systems, a study of the factors that led to the emergence of secondary airports was performed. The distribution of population at the regional level, the existence and the proximity of a secondary basin of population close to secondary airports were identified asmajor factors. Ground access and airport infrastructure were also enabling factors. The nature of the regional airport system, in terms of “Hub” versus “non-Hub” was alsoidentified as a contributing factor. The entry of a low cost carrier was determined to be the essential stimulus in the emergence phenomenon. These entries modify the airport dynamics resulting in the stimulation of both local and peripheral markets. Following the entry of a low cost carrier several other carriers, both legacy and low cost, enter and consolidate the growth of the emerging airport. As a consequence of the emergence of secondary airports and their integration into a region wide multi-airport system, they induce impacts on the NAS structure. Recent consolidations of TRACONs (Terminal Area Control) were identified as primary impacts. As there will be increasing pressure of demand on core airports in the upcoming years, the development of additional secondary airports will be required. Thetransition from a single core airport to region wide multi-airport systems and the emergence of new secondary airports in existing multi-airport systems, impose new constraints that need to be taken into account in the NAS improvements.
|
| [32] |
The competitive landscape of air transport in Europe [J].https://doi.org/10.1016/j.jtrangeo.2015.06.001 URL [本文引用: 1] 摘要
Competition between airlines and airports increased significantly since the deregulation of the intra-European air transport market in 1997. The passenger has a wider choice in terms of routings and departure airports than twenty-five years ago and pays a lower price. In this paper we investigate in which parts of Europe airline and airport competition are most intense and how the competitive landscape has changed since the liberalisation of the intra-European market. Competition levels are modelled for all air transport markets available to consumers in each western-European municipality using a Multinomial Logit (MNL) model. This allows us to determine how competitive the air transport product available to consumers in each of those municipalities truly is and how competition levels have changed. As opposed to most other competition studies we take all viable direct and indirect flight alternatives into account, as well as competing alternatives from nearby (adjacent) airports. This makes it the most extensive analysis of competition in the European aviation industry performed to date. As expected the results show that airline competition, allowing for grouping of the airlines belonging to the same alliance together, has in general increased since the liberalisation of the intra-European market. This can mainly be ascribed to the rise of the low cost business model. The spatial analysis however shows an uneven outcome. Changes in airline competition are most pronounced in areas that were previously not well served, such as the more remote regions in the United Kingdom, Spain and Italy. In Germany airline competition is lagging behind due to the strong dominance of the STAR alliance. In large parts of Scandinavia, but also in parts of France and Spain, airline competition is considerably less. These areas are often served only by a handful of airports and/or airlines, limiting airline choice and therefore competition.
|
| [33] |
Evaluating locational accessibility to the US air transportation system [J].https://doi.org/10.1016/j.tra.2010.07.004 URL [本文引用: 1] 摘要
Although there are hundreds of airports that support commercial air passenger traffic in the United States (US), not all areas are equivalently served by the commercial air transportation system. Locations in the US differ with respect to their level of access to the commercial air network and their overall accessibility within the system. Given the complexity of the domestic commercial air passenger network and supporting infrastructure, past research has only been able to provide a limited assessment of locational accessibility within the United States. To address these complexities, this paper proposes a new metric that incorporates measures of access to air transport as well as accessibility within air transportation networks. Using a comprehensive dataset on scheduled airline service, the developed approach is then applied to the US domestic commercial passenger air transportation network to explore geographic differentials in accessibility. Results suggest marked differences between core-based statistical areas throughout the US.
|
| [34] |
The organisation of multiple airports in a metropolitan area [J].https://doi.org/10.1680/tran.2012.165.2.151 URL PMID: 8886655 摘要
This study deals with the allocation of international and domestic flights (allocation of services) among multiple airports in a metropolitan area. We examine three types of airport operation: 1. separate operation by two private firms (PP); 2. integrated operation by a single private firm (M); and 3. integrated operation by the government (G). By means of numerical simulations, we obtain the following results: (a) the allocation of services varies with the location of airports and types of operation; (b) the welfare gain of the service choice regulation is quantitatively small compared with the airport charge regulation.
|
| [1] |
区域多机场系统机场选址模型研究 [J].Bi-level programming model for airport location in the Multi-Airport region [J]. |
| [35] |
Airports and regional air transport markets: A new perspective [J].https://doi.org/10.1016/j.jtrangeo.2015.10.010 URL [本文引用: 3] 摘要
61New perspective on air transport at cities across the globe61Major global cities are highest ranked in air transport hierarchy.61Change in rankings reflects growth in Asia.
|
| [36] |
Passengers' airport choice and airports' catchment area analysis in cross-border Upper Adriatic multi-airport region [J].https://doi.org/10.1016/j.jairtraman.2016.07.011 URL [本文引用: 1] 摘要
Although much research has been performed on passengers' origin airport choice, there is little research on airports' catchment area size and even less on airports' catchment areas in cross-border regions. This paper addresses passengers' airport choice and analyzes airports' catchment area size and its homogeneity in the Upper Adriatic region. Using the results of passengers' survey at three regional airports (Ljubljana Jo e Pu nik Airport (LJU), Venice Marco Polo Airport (VCE) and Trieste Pietro Savorgnan di Brazza Airport (TRS)) we have estimated the airports' catchment areas and airports market shares therein using multinomial logit (MNL) model structure. To additionally explore the passengers' airport choice behavior considering the different sensitivity across travellers to regional, demographic and airports attributes and account for preference heterogeneity in airport choice a mixed logit model was used. The results indicated that the three airports have relatively small core catchment areas and that the market share rapidly decreases with the increasing access time to airport. Partially, the results reinforced earlier findings showing that access time to airport is the most important determinant in airport choice for all segments (business/leisure and cross-border/domestic), however the sensitivity to access time is more pronounced in business and domestic group. Additionally, the results indicated pronounced loyalty to domestic airports and generally low importance of ticket prices, and show that in market conditions where all airports in the region have a low-cost carrier (LCC) the effect of LCC on airport choice is limited. Finally, the results indicated that the borders might have an influence on airport choice and that overall, in the cross-border regions the passengers airport choice process is even more complex than in non cross-border regions.
|
| [2] |
多机场系统运营特征及发展策略分析 [J].
正随着社会和经济的发展,机场作为航空运输和城市的重要基础设施,发挥着越来越重要的作用。随着人口的增长以及城市化进程的加快,目前世界主要都市区机场资源日趋紧张。为了缓解航空运输需求与机场资源受限之间的矛盾,越来越多的都市区开始发展多机场系统,"一市两场"、"一市多场"已广泛存在于世界各大都市。然而,由于缺乏
Analysis of multi-airport operation characteristics and development strategies [J].
正随着社会和经济的发展,机场作为航空运输和城市的重要基础设施,发挥着越来越重要的作用。随着人口的增长以及城市化进程的加快,目前世界主要都市区机场资源日趋紧张。为了缓解航空运输需求与机场资源受限之间的矛盾,越来越多的都市区开始发展多机场系统,"一市两场"、"一市多场"已广泛存在于世界各大都市。然而,由于缺乏
|
| [37] |
Airport and airline choice in a multiple airport region: An empirical analysis for the San Francisco Bay Area [J].https://doi.org/10.1080/00343400120025637 URL [本文引用: 1] 摘要
PELS E., NI JKAMP P. and RIETVELD P. (2001) Airport and airline choice in a multiple airport region: an empirical analysis for the San Francisco Bay area, Reg. Studies 35, 1–9. In this paper a nested logit model is used to describe passenger preferences concerning airports and airlines. A statistical model for the passengers' sequential choice of airport and airline is calibrated. It appears the nested multinomial logit model, with airports as the common elements in the nests, is statistically preferable to the 'standard' multinomial logit model. Frequency and access time to the airport are all significant. Separate models are estimated for business and leisure travellers, but there appear to be only small diVerences. PELS E.,NI JKAMP P. etRIETVELD P. (2001) Le choix d'aéroport et de compagnie aérienne dans une région à aéroports multiples: une analyse empirique du golfe de San Francisco, Reg. Studies 35, 1–9. A partir dA'un modéle embo06té logit, cet article cherche à présenter les préférences des passagers pour aéroports et les compagnies aériennes. Un modèle statistique relatif aux choix séquentiels des passagers est calibreé. Donné que les aéroports constituent les éléments communs des embo06tements, le modèle embo06té multinomial logit sA'avère statistiquement préférable au modèle normal multi‐nomial logit. La fréquence et l'accessibilityé sont, toutes les den deux, importantes. On évalue d'autres modèles pour ceux qui voyagent en classe affaires ou en touristes. Toujours est'il que les différences s'avèrent minimes. PELS E., NI JKAMP P. und RIETVELD P. (2001) Flughafen und Fluglinienwahl in einer Region mit mehreren Flughafeneine empirische Analyse fur das Gebiet der Bucht von San Francisco, Reg. Studies 35, 1–9. In diesem Aufsatz wird ein satzartig angelegtes Logitmodel dazu benutzt, die Bevorleszugung von Flughafen und Fluglinien seitens der Passagiere zu beschreiben. Ein statistisches Modell fur Reihenfolge der Flughafen'und Fluglinienwahl der Fluggaste wird geeicht. Er weist sich, da08 ein satzartig angelegtes multinominelles Logitmodell mit Flugh01fen als gemeinsamen Elementen in den Nestern statistisch dem 'Standard' multi‐nominellen Logitmodell vorzuziehen ist. Frequenz und Anfahrtszeit zum Flughafen sind wichtig. Es werden getrennte Modelle für Gesch01ftsreisende und Vergnügungsreisende erstellt, doch die Unterschiede scheinen nur gering zu sein.
|
| [38] |
Access to and competition between airports: A case study for the San Francisco Bay area [J].https://doi.org/10.1016/S0965-8564(02)00007-1 URL [本文引用: 1] 摘要
In this paper (nested) logit models that describe the combined access mode-airport-choice are estimated. A three level nested logit model is rejected. A two level nested logit model with the airport choice at the top level and the access mode choice at the lower level is preferred. From the estimation results, it is concluded that business travelers have a higher value of time than leisure travelers. In the (conditional) access mode choice, leisure travelers have a higher access cost elasticity (in absolute value), while business travelers have a higher access time elasticity (in absolute value). In general, access time is of large importance in the competition between airports in a region.
|
| [3] |
我国区域多机场发展的现状及对策分析 [J].
进入本世纪初,随着中国经济的市场化程度和对外开放的不断深入,中国民航运输业的改革也在不断地进行着,三大航空公司重组以及机场属地化改革,我国的民航运输业处在管理结构和经营模式的转型过程当中,逐渐开始从规模管理向效率管理转变。
Multi-airport development status in China's regions and the countermeasures [J].
进入本世纪初,随着中国经济的市场化程度和对外开放的不断深入,中国民航运输业的改革也在不断地进行着,三大航空公司重组以及机场属地化改革,我国的民航运输业处在管理结构和经营模式的转型过程当中,逐渐开始从规模管理向效率管理转变。
|
| [39] |
European connectivity: The role played by small airports [J].https://doi.org/10.1016/j.jtrangeo.2013.01.010 URL [本文引用: 1] 摘要
The objective of this work is to evaluate the role played by small airports in European connectivity. In particular, we aim to estimate the connectivity loss for the population caused by the closure of airports with traffic of less than 1 and 2million passengers per year, which represent two thirds and three quarters, respectively, of all operating European airports. Taken together these account for 8% of European passenger traffic. We apply a methodology that involves computing the quickest travel time necessary to connect each origin municipality to any destination in Europe and to major intercontinental destinations. The travel time includes three components: (i) travel time by road and high-speed train to access the departure airport, (ii) travel time by flight from the departure airport to the destination airport, including waiting times in intermediate airports when no direct flight is available, and (iii) travel time by road and high-speed train from the destination airport to the final destination municipality. For each of the over 75,000 municipalities in Europe, we calculate the average travel time needed to reach any other municipality in two cases: (i) including all airports operating in Europe, and (ii) considering only airports offering more than 1 and 2million seats per year. The results show that, with the exception of the Scandinavian countries, the average loss of connectivity is small on a country level. However, the connectivity loss is unevenly distributed: several regions in France, Spain, and Italy experience very significant increases in average travel times, in some cases of up to 40%.
|
| [40] |
Multiple airport regions based on inter-airport temporal distances [J].https://doi.org/10.1016/j.tre.2017.03.002 URL [本文引用: 1] 摘要
We formulate and implement a new metric for identifying multiple airport regions (MARs) around the world, based on the temporal distance between airports. This metric, opposed to existing studies based on spatial distance, takes into account the real travel time between airports of latent passengers and their journeys via ground transportation. We investigate a variety of properties of the newly built MARs network at the global scale for the year 2015, including the importance of MARs in global air transportation, similarity clustering, destination overlap, and airport roles inside a MAR. Commonalities and differences to the simplified spatial distance are identified.
|
| [4] |
基于复杂网络和乘客选择理论的长三角机场群研究 [J].https://doi.org/10.3969/j.issn.1005-9679.2011.03.023 URL [本文引用: 1] 摘要
中国航空运输业正在致力于形成合理的枢纽机场和支线航空的空间布局。本文研究航空机场布局和旅客流量分布的空间不平衡性,以长江三角洲机场密集但整体效率不佳的情况为例,从复杂网络和乘客出行路径选择理论出发,建立出行路径选择优化模型,分析乘客的航空出行路线选择,利用复杂网络中的介数概念说明枢纽机场的中转服务对周边机场的抑制作用。我们采用实际的航空数据进行了计算和模拟,得到了目前长三角地区各机场的介数和带权介数,并举南京为例做了具体分析,最后对今后机场发展和空间布局建设提出了建议。
Study on airport cluster in Yangtze River Delta based on complex networks theory and customer choice theory [J].https://doi.org/10.3969/j.issn.1005-9679.2011.03.023 URL [本文引用: 1] 摘要
中国航空运输业正在致力于形成合理的枢纽机场和支线航空的空间布局。本文研究航空机场布局和旅客流量分布的空间不平衡性,以长江三角洲机场密集但整体效率不佳的情况为例,从复杂网络和乘客出行路径选择理论出发,建立出行路径选择优化模型,分析乘客的航空出行路线选择,利用复杂网络中的介数概念说明枢纽机场的中转服务对周边机场的抑制作用。我们采用实际的航空数据进行了计算和模拟,得到了目前长三角地区各机场的介数和带权介数,并举南京为例做了具体分析,最后对今后机场发展和空间布局建设提出了建议。
|
| [41] |
Managing the multiple airport system by coordinating short/long-haul flights [J].https://doi.org/10.1016/j.jairtraman.2012.01.004 URL [本文引用: 1] 摘要
This paper considers the effectiveness of the perimeter rule for managing a multiple airport system by focusing on airline’s network design behavior as well as air passenger’s route choice behavior. We apply a bi-level air transport market model that deals with behavior of two participants: airlines as leaders and passengers as followers. The results of numerical computations suggest that the equilibrium solution under the perimeter rule is the best for both airlines and air passengers; essentially airlines face a prisoner’s dilemma without the perimeter rule.
|
| [42] |
The "Southwest Effect" in multi-airport regions [J].https://doi.org/10.1016/S0969-6997(01)00013-8 URL [本文引用: 1] 摘要
The “Southwest Effect” is a well-known phenomenon within the airline industry where markets that Southwest Airlines enter see an increase in traffic and a decrease in average airfares. This paper examines the role of Southwest Airlines in altering fares and passenger traffic and the Southwest Effect at airports in multi-airport regions. A comparison between Southwest-served routes and non-Southwest-served competing routes shows that the elements of the Southwest Effect are present even in those markets not served by Southwest. Southwest-served multi-airport regions studied include Chicago, Washington, DC/Baltimore, Houston, and south Florida.
|
| [5] |
区域机场同质化发展特征分析: 以长三角地区机场群为例 [J].
通过构建测量区域机场同质化发展的改进相似系数,运用综合赋权评价法,对长三角地区机场发展的同质化水平进行测算,并以综合相似系数构建机场同质化网络,采用复杂网络结构方法对机场同质化网络进行分析。结果表明:长三角经济核心圈机场存在明显的同质化水平;枢纽型机场由于机场辐射能力强且分布密集而同质化水平最为明显;核心边缘的地区型机场由于城市经济规模小且距离较近,机场为了进一步发展而产生趋同化;其他地区型机场则由于长三角地区内城市经济结构的相似,邻近机场间的服务呈现趋同化。最后,针对长三角地区机场同质化发展特征提出区域机场一体化和差异化发展的政策建议。
Homogenization analysis of airports in China Yangtze River Delta region [J].
通过构建测量区域机场同质化发展的改进相似系数,运用综合赋权评价法,对长三角地区机场发展的同质化水平进行测算,并以综合相似系数构建机场同质化网络,采用复杂网络结构方法对机场同质化网络进行分析。结果表明:长三角经济核心圈机场存在明显的同质化水平;枢纽型机场由于机场辐射能力强且分布密集而同质化水平最为明显;核心边缘的地区型机场由于城市经济规模小且距离较近,机场为了进一步发展而产生趋同化;其他地区型机场则由于长三角地区内城市经济结构的相似,邻近机场间的服务呈现趋同化。最后,针对长三角地区机场同质化发展特征提出区域机场一体化和差异化发展的政策建议。
|
| [6] |
我国多机场系统的内涵、分类与特性 [J].Connotation, classification and characteristics of multi-airport systems in China [J]. |
| [7] |
世界机场空间格局及对中国的启示 [J].https://doi.org/10.3969/j.issn.1004-9479.2008.03.002 URL [本文引用: 1] 摘要
机场是航空运输的重要载体,其空间格局深刻影响着航空市场和航空网络的演化。近年来,迅速增长的中国航空运输成为世界航空运输最为突出的事情之一。基于世界民航发展概况,本文系统分析了世界机场分布格局,研究表明:美国和欧盟将形成全球两大民航“发展极”,亚太地区则是世界未来航空增长最具潜力的区域。在重点分析美欧机场发展的基础上,深入探讨了世界多机场地区的机场分布特征,以期对中国城市群(或城市密集地区)、大都市区以及支线机场布局提供决策参考。
Spatial pattern of the worldwide airports and its enlightenment [J].https://doi.org/10.3969/j.issn.1004-9479.2008.03.002 URL [本文引用: 1] 摘要
机场是航空运输的重要载体,其空间格局深刻影响着航空市场和航空网络的演化。近年来,迅速增长的中国航空运输成为世界航空运输最为突出的事情之一。基于世界民航发展概况,本文系统分析了世界机场分布格局,研究表明:美国和欧盟将形成全球两大民航“发展极”,亚太地区则是世界未来航空增长最具潜力的区域。在重点分析美欧机场发展的基础上,深入探讨了世界多机场地区的机场分布特征,以期对中国城市群(或城市密集地区)、大都市区以及支线机场布局提供决策参考。
|
| [8] |
“一带一路”与中国对外航空运输联系 [J].https://doi.org/10.11820/dlkxjz.2015.05.003 URL [本文引用: 1] 摘要
基础设施互联互通是降低贸易成本、增强国际联系、构建"一带一路"的基本条件。建设国际航空网络与陆路运输通道、海上航运通道,共同组成"一带一路"交通基础设施互联互通的基础。基于2014年的OAG计划数据,本文重点分析了中国与"一带一路"沿线国家的国际航空运输联系空间格局,并运用枢纽度模型识别国际航空枢纽。研究表明:1中国与"一带一路"沿线国家的航空客运联系广度和强度均高于货运,其中国际客运联系集中在泰国、俄罗斯和新加坡等国,而国际货运联系则主要集中在俄罗斯;2中国对外航空网络格局总体上表现为"轴—辐"与"点—点"模式并存;3上海、北京和广州为中国面向"一带一路"沿线国家的国际航空客运枢纽机场,上海同时还是国际航空货运枢纽。
China's international aviation transport to the Belt and Road Initiative area [J].https://doi.org/10.11820/dlkxjz.2015.05.003 URL [本文引用: 1] 摘要
基础设施互联互通是降低贸易成本、增强国际联系、构建"一带一路"的基本条件。建设国际航空网络与陆路运输通道、海上航运通道,共同组成"一带一路"交通基础设施互联互通的基础。基于2014年的OAG计划数据,本文重点分析了中国与"一带一路"沿线国家的国际航空运输联系空间格局,并运用枢纽度模型识别国际航空枢纽。研究表明:1中国与"一带一路"沿线国家的航空客运联系广度和强度均高于货运,其中国际客运联系集中在泰国、俄罗斯和新加坡等国,而国际货运联系则主要集中在俄罗斯;2中国对外航空网络格局总体上表现为"轴—辐"与"点—点"模式并存;3上海、北京和广州为中国面向"一带一路"沿线国家的国际航空客运枢纽机场,上海同时还是国际航空货运枢纽。
|
| [9] |
|
| [10] |
中国民用航空机场的可达性研究 [J].
运用可达性分析方法和地理信息技术,研究2005年中国民用航空机场的可达性及其服务水平。中国民用航空机场的可达性水平总体呈现东高西低的态势,机场服务区的面积由东部沿海向东北和中西部地区逐渐增大;全国机场有效服务区面积占国土面积的11%,区内人口和GDP占全国的比重分别为47%和67%。提出全国新机场的规划建议,即优先考虑社会经济需求潜力和改善东北及西北地区航空运输服务水平。
Empirical study on accessibility of Chinese civil aviation airports [J].
运用可达性分析方法和地理信息技术,研究2005年中国民用航空机场的可达性及其服务水平。中国民用航空机场的可达性水平总体呈现东高西低的态势,机场服务区的面积由东部沿海向东北和中西部地区逐渐增大;全国机场有效服务区面积占国土面积的11%,区内人口和GDP占全国的比重分别为47%和67%。提出全国新机场的规划建议,即优先考虑社会经济需求潜力和改善东北及西北地区航空运输服务水平。
|
| [11] |
我国三大机场群与城市群协调发展比较与建议 [J].Comparison and suggestions on the coordinated development of three biggest airport groups and city groups of China [J]. |
| [12] |
基于交通资源优化配置的机场群整合问题 [J].Jiyu jiaotong ziyuan youhua peizhi de jichangqun zhenghe wenti [J]. |
| [13] |
世界主要区域多机场系统发展现状及存在的问题 [J].Development and problems of world major Multi Airport systems [J]. |
| [14] |
区域多机场系统规划模型与方法研究 [J].Research on the model and method of regional multi-airport system planning [J]. |
| [15] |
我国城市多机场体系规划及发展模式分析 [J].Woguo chengshi duojichang tixi guihua ji fazhan moshi fenxi [J]. |
| [16] |
我国区域多机场复合系统协调发展研究 [J].https://doi.org/10.3969/j.issn.1671-2129.2011.02.011 URL [本文引用: 1] 摘要
我国区域多机场复合系统发展存在区域内总航空运输需求不足,新机场航空运输量不足,非主要机场运输量不稳定,区域多机场分配运量难等现状。大都市区在确定是否发展多机场系统以及在规划发展多机场复合系统时,要从始发旅客需要达到一定的阀值、大力发展低成本航空公司、多机场系统分工协作等方面考虑发展策略。
|
| [43] |
Analytic hierarchy process assessment for potential multi-airport systems: The case of Cape Town [J].https://doi.org/10.1016/j.jairtraman.2013.12.004 URL [本文引用: 1] 摘要
This paper discusses the application of an Analytic Hierarchy Process (AHP) analysis for the assessment of a potential multi-airport development. The case study presented evaluates the potential introduction of a second airport in the City of Cape Town, which is currently served solely by Cape Town International Airport. With socioeconomic development, spatial planning, transportation improvement, environmental preservation and financial viability proposed as the main objectives of airport development, a survey of key stakeholders addressed the relative weighting of these criteria in the AHP. The multi-criteria decision-making assessment, as well as analyst judgement, concluded that the City of Cape Town should continue to utilise a single-airport system until passenger volumes per annum increase beyond the 27 Million Air Passengers per annum level.
|

/
| 〈 |
|
〉 |
