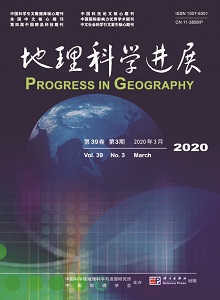
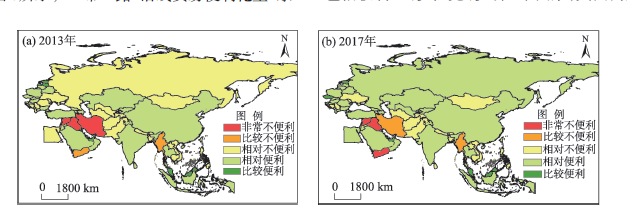
Trade facilitation plays an important role in the economic cooperation of the countries along the Belt and Road. Increasing the level of trade facilitation is conducive to promote the orderly and freely flow of economic factors in the region. Based on the perspective of trade facilitation and existing literature review, this study constructed an evaluation system of trade facilitation with 29 indicators, analyzed the development trend, spatial pattern, and development mode of trade facilitation in the countries along the Belt and Road from 2013 to 2017, and put forward some policy recommendations. The results show that: 1) Since 2013, the level of trade facilitation in the countries along the Belt and Road has been slowly rising, and the six subregions ranked from high to low according to the increase in trade facilitation levels are Mongolia and Russia, Central Asia, Central and Eastern Europe, West Asia, South Asia, and Southeast Asia. 2) Trade facilitation level of the countries along the Belt and Road showed a spatial pattern of high in the east and west and low in the center, and high in the south and low in the north. And the spatial differences gradually narrowed. 3) The change of the second-level indicators was relatively consistent with the overall trade facilitation. China ranks high among the Belt and Road countries on the second-level indicators except business environment. 4) Trade facilitation can be divided into eight modes through k-means cluster analysis. "High level comprehensive development" and "Low level comprehensive development" were the main development modes of the countries along the Belt and Road. "Lagging behind in customs clearance costs and international cooperation", "Leading in domestic trading environment" and "Leading in infrastructure construction" have become important development modes for some countries in Southeast Asia, Central and Eastern Europe, and Central Asia.
Air China, China Eastern Airlines, and China Southern Airlines are the three major state-owned airlines in China, and they have significant influences in the air transportation market. Market competition of the three airlines has always been an important research topic in economics, management, and geography. Based on the flight schedule data, this study constructed a market share index and a market overlap index and used them to examine the structure and competition of the three major airlines on the Chinese and international markets in 2005 and 2015. The results are as follow: 1) The markets of the three major airlines have expanded rapidly over the decade of 2005-2015. In China, the three airlines have added navigation airports mainly in the central and western regions, especially in Heilongjiang Province, Inner Mongolia Autonomous Region, and Guizhou Province. These provinces are the new major market competition places. Among the three major airlines, China Southern Airlines has the largest number of absolutely dominant airports and flight routes, China Eastern Airlines has the largest increase, and Air China has a relatively small market. 2) Spatially, the three major airlines show significant regional differences in the domestic key markets, and each has a great advantage in its respective hub airports. The dominant routes of the three major airlines mainly form radial networks around their hub airports. Routes concentrated in domestic air transportation are mainly represented by competition among two of the three major airlines. With increasing market competition, the market shares of the three airlines in most of the major domestic airports and routes decreased. 3) In the international market, East Asia and Southeast Asia are areas where the three major airlines have focused. Their navigation airports, flights, and competing airports are mostly located here. In particular, Japan and South Korea are the countries of most severe competition of the three major airlines. However, the competition of the three major airlines in the international flight routes is not obvious—this is because they mainly set up routes between their hub airports and international airports, and their operating bases are very different.
With the rapid development of cities in China, urban environmental problems become increasingly more severe. Clarifying the relationships between urban development and the environment can help solve urban environmental problems. In this study, we took the Beijing-Tianjin-Hebei region as the research area and used fractal method to describe urban system and water system in the region, then to explore the interactions between urban and water systems. The main results and conclusions are: 1) From 1990 to 2010, the fractal dimension of construction land in the Beijing-Tianjin-Hebei region increased, while the fractal dimension of the water system decreased; the bi-fractal characteristic of construction land in the Beijing-Tianjin-Hebei region decreased, while the bi-fractal characteristic of the water system increased; the spatial structure of construction land changed from concentration to dispersion from 1990 to 2015 and the water system became more concentrated. These phenomena illustrate that the spatiotemporal change of construction land and water system had opposite trends in the Beijing-Tianjin-Hebei region. 2) The fractal structure of urban centers is more complete than suburbs. 3) In the second decade of the 21st century, the human-water relationship became tenser. The South-to-North Water Transfer Project eased the severe stress of water in the Beijing-Tianjin-Hebei region, which mainly improved the structure of water system at the large scale. 4) The degradation of water system in the Beijing-Tianjin-Hebei region from 1990 to 2010 was caused by both natural and human factors. In the 21st century, the influence of human factors is more significant. According to the results and conclusions, some policy recommendations are proposed: On the one hand, more consideration should be given to the role of water in the process of urban planning, especially the protection of small-scale water sources and saving water by improving the mechanism of water resources management. On the other hand, more attention should be paid to the improvement of suburban spatial structure by avoiding unlimited urban expansion.
With the initiation of the coordinated development strategy of the Beijing-Tianjin-Hebei region, moving out non-capital functions and industrial transfer in Beijing has been paid increasingly more attention. Based on the data of investment projects of over 100 million yuan in Hebei Province by Beijing's enterprises from 2010 to 2015 and the calculation results of geographic concentration, this study analyzed the investment scale, industry characteristics, and location characteristics over the years, and further used a conditional Logit regression model to explore the influencing factors of the investment location of enterprises from all industries, manufacturing industries, and service industries. The purpose of this study was to summarize the spatial change pattern and influencing mechanisms of investments in Hebei by Beijing's enterprises, and provide suggestions for industrial transfer policies in the context of moving out non-capital functions. The study found that: 1) The investment scale in Hebei by Beijing's enterprises increased dramatically. The proportion of manufacturing industry investments decreased and the proportion of service industry investments increased. The types of invested industries were diverse, showing an upgrading trend, and the moving out of industries had achieved some results. 2) The distribution of investments in the prefectural-level cities of Hebei Province was clearly stratified, and they were distributed across urban districts and counties, showing the characteristics of wide-area distribution. Tangshan City was in a dominant position, followed by Baoding, Shijiazhuang, Zhangjiakou, and Langfang cities. 3) From 2010 to 2015, the location of investments in Hebei by Beijing's enterprises was concentrated, but had become slightly dispersed. The investment was moving from Tangshan, Chengde, and Langfang to Baoding and Handan, and basically formed an investment pattern with Tangshan, Shijiazhuang, Baoding, and Zhangjiakou as the core agglomeration area, which was in line with the spatial planning of the coordinated development strategy of the Beijing-Tianjin-Hebei region. The investment location of the manufacturing industries had gradually dispersed, the investment was moving from Tangshan and Langfang to Baoding, Handan, and Shijiazhuang. The investment location of the service industries was dispersed firstly, then concentrated, and the investment was moving from Shijiazhuang and Chengde to Zhangjiakou, Baoding, Langfang, and Qinhuangdao. 4) Industrial foundation, time distance, policy environment, and innovation capacity were important factors that influenced the choice of investment location. Manufacturing industries were affected by time distance, labor cost, and policy environment, so it was easy to form "location lock-in" and “industry lock-in.” The higher economic benefits of service enterprises had overcome the increase of labor costs, and high-quality talents could attract investments from service enterprises.
Taking the county unit of Sichuan Province as the research object, the characteristics and mechanism of urbanization in population outflow areas are discussed. The study found that: different from the experience of coastal cities, urbanization of counties in Sichuan Province is dominated by living-oriented type, and the main driving forces for the urbanization of rural population are consumption and education demands. The main body of the newly urbanized population is the left-behind population after considerable labor losses, and their financial resource of living in cities depends to a large extent on the remittance sent back by migrant workers. Industry shows weak support to urbanization, forming a special mode of urbanization, that is, remote industrialization driven local urbanization, which leads to many unique phenomena. For example, the more population outflow, the faster urbanization speed; counties continued to grow and flourish without manufacturing development; and the urbanization speed of counties is faster than that of city. Based on these new findings, this article discussed the relevant understanding of urbanization mechanism and the prospect of long-term trend and potential problems of urbanization development in such areas.
Increasing urbanization is a global phenomenon that has led to numerous urban problems, including noise, deteriorating air quality, and reduced biodiversity. Urban forests are able to effectively alleviate these problems through their ecosystem services. Therefore, in 2018, the theme of the World Forest Day is "Forests and Sustainable Cities"; and China has started the assessment of "National Forest Cities" since 2004. Under this background, examining the distributions of urban forests in major Chinese cities and then comparing them with large foreign cities could help understand the current situation of Chinese urban forests and provide theoretical references for their management. The main difficulty in cross-regional urban forest research is that differences in urban definitions lead to poor comparability between cities. This study used the Defense Meteorological Satellite Program (DMSP) / Operational Linescan System (OLS) nighttime lighting image and the GlobeLand30 surface cover product to extract urban forest data of 12 major international cities (Beijing, Shanghai, Guangzhou, Tokyo, Seoul, New Delhi, Jakarta, Sao Paulo, Lagos, New York, London, and Moscow) in 2000 and 2010 based on the intensity gradient method and using ArcGIS tools, and examined their spatial and temporal changes. The results show that among the 12 cities, from the perspective of existing urban forests, urban forest coverage and per capita urban forest area are generally high in developed cities, while in Asian developing cities they are low. From the perspective of temporal change, the urban forest growth rate of cities in developed countries is mostly less than 70%, while in most cities of developing countries, it is more than 100% during 2000-2010. The major source of the increase is the expansion of urban area, while the decrease is mainly due to the conversion to artificial surface and urban lawn. According to the spatial distribution of urban forest coverage based on buffer analysis, these cities can be divided into three categories: low in the central area and high in the surrounding areas (Beijing and Seoul); low in the surrounding areas and high in the central area (Guangzhou, Tokyo, Sao Paulo, and so on); and low in the whole urban area (Shanghai, New Delhi, and Jakarta). Finally, based on the results of comparison, recommendations for the future development of urban forests in China are provided.
Flood disasters cause both direct and indirect economic losses to industrial systems, and indirect economic losses may be much higher than direct economic losses. Studying indirect economic losses is of great significance for disaster risk reduction. Based on the input-output model, this study used the direct economic loss data of flood disasters in Hubei Province in 2016 to evaluate indirect economic losses under different flood water depth, from the perspective of sectorial interconnectedness. The results show that: 1) With the increase of flood water depth, direct economic losses and indirect economic losses increase accordingly. 2) For most industrial sectors, indirect economic losses caused by industrial interconnectedness are higher than direct economic losses. However, when flood water depth is shallow, some industrial sectors with more intensive fixed assets are more affected by flood disasters, resulting in higher direct economic losses. 3) The total indirect economic losses show a nonlinear relationship with the total direct economic losses, but with the same trend. When the flood water depth is greater than 2.093 m, indirect economic losses are about 1.15 times of direct economic losses.
There is insufficient study of evapotranspiration (ET) and soil moisture (SM) in arid ecosystems such as the Central Asia. To address this issue, we applied the land surface model (CLM 4.5) to simulate monthly ET and SM in the Central Asia from 1980 to 2009. Other products including GLDAS (Global Land Data Assimilation System), GLEAM (Global Land-surface Evaporation Amsterdam methodology), and AMSR-E (Advanced Microwave Scanning Radiometer for EOS) were used to compare with the simulated results. The comparison indicates that the simulated results agree favorably with other products. Most of the annual evapotranspiration concentrates in spring and summer, reaching its maximum in May. In summer, the high evapotranspiration areas in the Central Asia are concentrated in the northern and northeastern corner of Kazakhstan, and in the southeastern mountainous areas. Vegetation transpiration plays a leading role in the main farmland and forest areas. In spring, the Tianshan Mountains and the Pamir Plateau in the southeast are the high value areas of evapotranspiration, mainly because with the high rainfall and the beginning of snow melting, there is sufficient water for evapotranspiration. The spatial patterns of annual ET and SM in the Central Asia show that the areas with high ET are distributed in the northern and northeastern corner of Kazakhstan and in the southeastern mountainous areas, and the low ET areas are mainly located in Turkmenistan and Uzbekistan, where desert is the main land cover type. The results of simulated surface soil moisture show that in winter, land surface evapotranspiration is low, and precipitation is mostly stored in the surface soil or in snow cover. In spring, air temperature rises, snow melts, and water seeps into the soil. Soil moisture increases continuously, reaching its peak in April. In summer soil moisture continues to decrease, and reaches its lowest value in September. In autumn and winter, evapotranspiration decreases and soil moisture increases. The high value areas of soil moisture in the Central Asia are concentrated in the woodland and farmland areas in the northern and northeastern part, as well as the Amu River and Sir River basins in the Tianshan Mountains and downstream, while the desert areas in the southwest are low value areas. In summer rainfall, evapotranspiration, and soil moisture are low, so the correlation between them is very high; winter precipitaton and soil moisture are highly correlated, especially in barren areas; in the case of high vegetation coverage, spring rainfall and evapotranspiration are highly correlated, and the correlation between soil moisture and rainfall, evapotranspiration is low, and a negative correlation can be observed. Overall, the result of this study will lay foundation for further research on water issues in the Central Asia.
Maize is China's largest food crop. Exploring the temporal and spatial characteristics of maize production potential in the context of climate change is of great significance for China to effectively adapt to climate change. This study combined global agro-ecological zone (GAEZ) model, extreme-point symmetric mode decomposition (ESMD) method, and set-pair analysis method to explore the periodic fluctuation characteristics and long-term trend of maize production potential in China and analyzed the process of spatial pattern change. The results show that China's maize production potential increased during 1960-2010, from 910 million tons in the 1960s to 945 million tons in the 2000s. On the interannual scale, China's maize production potential mainly fluctuated in the quasi-three-year and quasi-five-year periods; on the interdecadal scale, there were quasi-10-year and quasi-20-year fluctuation periods. The quasi-three-year periodic fluctuation was the most important feature of the long-term change of maize production potential, which was mainly affected by the change of annual precipitation. Spatially, maize growing areas were mainly concentrated in the region east of Jiagedaqi-Xilinhot-Linhe-Xining-Tianshui-Zhongdian. During the 1960s-2000s, the maize production potential boundary moved in the northeastern part of China and along the Linhe-Xining line. The trend of change of maize production potential in the North China Plain, Liaohe Plain, and Sichuan Basin showed strong consistency; however, the change process in the Songnen Plain, Sanjiang Plain, Guanzhong Basin, and the middle and lower reaches of the Yangtze River was the opposite of the above. In both types of regions, the changes in maize production potential were significant, and the direction of change was alternating on the interdecadal scale.
Classification is the key to understanding changes in aquatic habitats. Most of the existing classifications were proposed for different purposes such as specific research and management needs and there are no commonly applied criteria for the classification, thus their operability and comparability are limited. Therefore, the purpose of this study was to propose a multifunctional classification system of aquatic habitats that embraces the advantages of remote sensing data based on the system theory, so that the classification can be practical and comparable. Additionally, this study provided the interpreting marks of different types of aquatic habitats for Landsat remote sensing data. Based on the interpreting marks, this study obtained the spatial distribution and areal ratio of different types of aquatic habitat in China by using the Landsat remote sensing data in 2015. The multifunctional classification of aquatic habitats for remote sensing data is the foundation for understanding changes in aquatic habitats.
The impact of climate change is felt globally and China is no exception. Evidence indicates that natural resource-based agriculture is especially sensitive and vulnerable to the adverse effects of climate change due to its strong dependence on weather conditions. Climate-related events such as droughts, cold waves, hailstorms, snowfall, erratic rainfall, and fluctuation in temperature contribute to farmers' vulnerability and affect the livelihood of farming households and agricultural production on which national food security depends. Under the background of global climate change, finding reasonable and effective adaptive measures to reduce agricultural losses and increase agricultural production levels have attracted increasingly more attention. Most studies pay attention to the relationship between farmers' perceptions and adaptive behaviors, while farmers' attributes are seldom considered. Examining the types of farmers' adaptive behaviors and the influencing mechanism among farmers' attributes, perception of climate change, and adaptive behaviors is of significance for making appropriate policies. Based on recent theoretical and empirical studies in the rain-fed agricultural areas, this study constructed a path analysis model with the perception of climate change as mediator to explore the path of impact among the variables of farmers' attributes, perception of climate change, and adaptive behaviors. The results show that: 1) The surveyed farmers showed a certain degree of recognition of local climate change and some actions adapting to climate change were taken. Among these, farmers prioritize technical measures, followed by economic measures, and few farmers adopted migration as an adaptive behavior. 2) The difference in the impact of farmers' attributes on adaptive behaviors is significant. 3) According to the mediating effects of the mediator, the model of multivariate path analysis was decomposed into three types: complete mediation model, partial mediation model, and no mediation model. Through the analysis of the above three models, it was found that farmers' attributes had an indirect impact on adaptive behaviors through mediating variables, as well as a direct impact through non-mediating variables. It indicates that the choice of adaptive behaviors depended not only on the farmers' perception of climate change, but also on their attributes. Finally, relevant policy recommendations were put forward with the aim to improve farmers' ability to cope with climate change.
Traditional industrial research is mostly based on the analytical paradigm of quantitative structure, ignoring patterns of industrial agglomerations. Based on the points-of-interest (POI) data of Gaode Map, this study constructed a firm-cluster-system (FCS) industrial analysis framework combining firm-cluster-system scales. From the perspective of industry classification criteria, it analyzed the geographic nesting hierarchy from micro to macro scales and divided the urban cultural industry POI into five categories: culture and arts industry, press and publishing industry, radio and television industry, sports and fitness industry, entertainment and leisure industry. Using the urban area of Jinan City as the case area, this study integrated nuclear density analysis, industrial landscape ecology model, geographic proximity index, and social network analysis methods to reveal the characteristics of cultural industry POI clustering, industrial cluster landscape, and industrial system network by using the 500 m honeycomb grid. The conclusions of this study are as follows: 1) By establishing a classification system of cultural industries based on POI data and innovatively using the location quotient model to develop research means from industrial POI to industrial landscape, the perspective of cultural industry spatial research has been expanded. 2) Jinan's cultural industry has the characteristics of continuous concentration and scattered aggregation, and there are regional heterogeneity in landscape morphological characteristics. Different industrial types are intertwined to form an ecological network, and there is a coupling relationship at the system level. The entertainment and leisure industry in Jinan has the advantage of group quantity, but the radio and television industry play the role of key species. The findings of this paper provide a basis for industrial regulation and policy optimization at different levels. This research deepens the theory and methods of industrial location analysis and expands the application of geographic big data.
As a new organizational form and research paradigm of urban spatial system, city network has been widely concerned in recent years. However, most of the studies on city networks were based on a positive perspective, while the negative effects, security, and sustainable development of city networks were rarely addressed. By reviewing the literature of city network and regional resilience, this article tentatively proposed a concept and an analytical framework of city network resilience based on evolutionary resilience theory to explore the "negative problems" of city networks. In brief, city network resilience could be comprehended as the ability of city network systems to prevent, resist, respond to, and adapt to the impact of external acute shocks and chronic pressures and recover from them or switch into another development path by means of the cooperation and complementarity of social, economic, organizational, and engineering fields among cities. Based on this concept, combining evolutionary resilience and adaptive cycle theory, a city network was regarded as a complex adaptive system with dynamic changes. Based on the social network, economic network, organizational network, and infrastructure network, considering both adaptation and adaptability, a framework of urban network resilience analysis from the perspective of resilience characteristics and resilience processes was proposed. Furthermore, the analysis and optimization methods of urban network resilience were prospected, and some core issues involved were discussed. The research aimed to provide a scientific basis for regional planning, regional policy formulation, and regional organization establishment with the goal of achieving safe development, and provide valuable references for each city node to identify its role in a region and participate in regional governance.
The study on identification and optimization of production-living-ecological spaces is to optimize the layout of future space based on identifying the structure, pattern, and problems of current spaces, which is a more comprehensive land spatial zoning approach and an urgent practical problem in national spatial planning, as well as a frontier of academic research. In this study, literature review methods, comparative analysis, and induction were performed to systematically summarize the current research situation of the concept and connotation, identification, and optimization of production-living-ecological spaces. At present, the research on the identification and optimization of production-living-ecological spaces has made a major breakthrough. However, the internal mechanism and concept of the formation of production-living-ecological spaces were insufficiently examined. The quantitative identification method and technical system of production-living-ecological spaces need to be improved. The dynamic change and driving mechanism, spatial conflict diagnosis, and problem analysis of production-living-ecological spaces were weakly researched. Optimization theory and technology system of production-living-ecological spaces were still in the initial stage. We propose the following future directions: Forming the concept of quality and quantity in future research; Attaching importance to lessons-learned from the existing research results of international spatial planning; With formation mechanism and concept definition, quantitative identification, mechanism of change examination, conflict diagnosis, and problem analysis and optimization control and simulation of production-living-ecological spaces as the main research lines, constructing the theory and technical system of identification and optimization of production-living-ecological spaces. Meanwhile, more attention should be paid to mountainous areas with horizontal and vertical features.
Flash flood is one of the major natural hazards in China. It seriously threatens the lives of people and property in mountainous areas. Various methods have been developed for flash flood study, but most of them focused on the past few decades. As one of the effective methods of historical flash flood events reconstruction, dendrogeomorphology has been used worldwide. It can provide hazard information with long temporal scale and high temporal resolution, sometimes at the seasonal level. By comparing tree ring width and other growth characteristics between disturbed and undisturbed trees, growth disturbance signals can be found in the disturbed trees. Using the growth disturbance in tree rings, flash flood events can be dated, and then the frequency, size, and spatial distribution characteristics of flash floods that have no or little documentary records can be reconstructed. The discharge of flash flood can be reconstructed quantitatively according to the height of scars or by using hydraulic models. With the development of dendrogeomorphology, research tends to probe into the meteorological driving mechanism of flash floods and the pattern of flash floods on a larger spatial scale. In the practical application of dendrogeomorphology, more instrumental data and historical records are applied in the studies. This makes the method increasingly more widely used around the world. But work based on dendrogeomorphology has not been reported in China. In this article, we reviewed the development of the study on flash floods based on tree ring, briefly summarized the research progress, and discussed the advantages, limitations, and potential of this approach, so as to provide some reference information for relevant work in China.