

韧性涉及区域经济高质量发展[1],是近年来地理学研究的热点问题之一[2-3],韧性既可以认为是系统受到扰动或冲击后维持自身稳定并复苏的能力[4-5],也可以认为是与外界风险无关的系统自身属性[6]。韧性概念总体上经历了从工程韧性到生态韧性,再向演化韧性(社会—生态韧性)不断发展的几个阶段[7],并逐渐从自然生态领域向人类生态学领域延伸[8],前两者强调的都是系统的恢复性,而演化韧性强调的是系统的适应性[9]。实际上,没有风险冲突的系统也存在韧性,但风险冲突更能显示其韧性。对韧性概念的不同理解,进而形成了2大类韧性评价方法:一是基于生态韧性视角,将韧性视为系统应对风险的恢复能力,通过对比风险前后主要指标或者某一核心指标的变化,分析系统韧性特征[10]。例如,部分国外学者利用旅游人次、旅游收入、旅游总资本以及旅游就业人数变化来衡量旅游经济韧性[11-12];还有部分学者通过衡量旅游业受到冲击的程度以及冲击后的恢复速度表征韧性[13]。国内学者谭俊涛等[14]从经济维持性和恢复性2个方面,定量分析中国各地区应对1997年亚洲金融危机和2008年全球金融危机的经济韧性特征;童昀等[15]通过构建恢复指数与恢复缺口,分析了COVID-19对中国城市人口迁徙的短期影响。二是基于演化韧性视角,将韧性视为系统固有的属性,通过设计一套指标体系来考察韧性[16]。如Powell等[17]以中美洲加勒比海地区的6个社区为研究对象,提出了衡量社会—生态系统韧性的指标体系;Foster[18]从评估、准备、响应和恢复4个阶段来划分城市韧性;修春亮等[19]在构建“规模—密度—形态”城市韧性评价体系的基础上,开展了大连市城市韧性评估。
近年来旅游韧性成为学科内外新兴的研究领域。旅游韧性研究在国外具有一定的理论基础,成果相对丰硕[20-21],早期国内学者大部分从脆弱性[22]、适应性[23]等视角展开与此相关的研究。脆弱性、适应性、韧性这3个概念之间既有区别,也有联系。一般而言,脆弱性是一个与韧性相反的概念,而适应性相当于演化韧性的部分内容[24-25]。旅游发展的现实表明:旅游业虽然时刻面临各种风险的冲击,但却能从危机中恢复过来,并产生一定的适应性[26]。理论研究与现实产业发展均表明,旅游经济具有一定的韧性。根据之前文献梳理结果,旅游经济韧性可以理解为旅游经济系统对外界干扰因素的抵御能力,以及旅游经济系统的适应能力。从研究主题看,国内相关研究主要集中在旅游经济韧性[27-28]、旅游流网络结构韧性[9]、旅游社区韧性[29-30]、城市旅游韧性[31]等方面。
各类“黑天鹅”“灰犀牛”等事件对区域旅游发展的影响层出不穷,韧性理论既为区域旅游应对外部风险冲击以及自身适应能力的提升提供新的理论视角,也为管理者制定全局旅游业恢复对策提供决策依据。韧性是新发展理念下研究区域旅游高质量发展的重要切入点。然而,现有旅游学科领域内的韧性关注度还不够,研究仍不成体系,尤其缺少长时间省域尺度的旅游经济韧性评价。如何对省域旅游经济韧性进行定量测度,中国省域旅游经济韧性时空演化格局及演化有何规律,其影响机理如何?诸如此类问题尚需进一步深入研究。基于此,本文利用1998—2020年中国省域尺度的旅游发展相关数据(不含港澳台数据),在对旅游经济韧性定量测度的基础上,进一步分析其时空演化规律并揭示其影响机理。本文的创新性主要体现在以下2个方面:一是利用长时间数据,基于演化韧性视角对中国省域旅游经济韧性进行定量测度;二是对中国省域旅游经济韧性时空演化规律与演化机制进行总结。
1 研究方法与指标选择
1.1 研究方法
1.1.1 旅游经济韧性评价
式中:Reit表示第i个研究对象第t年的旅游经济韧性,ΔMi为第i个研究对象实际旅游收入状况;ΔE为以研究对象所在区域整体旅游收入状况为基础,预测得出的研究对象旅游收入状况;Mit、Mit-k为对象i在t、t-k时间内的旅游收入;Mrt、Mrt-k为全国在t、t-k时间内的旅游总收入。
将式(1)~(3)进行合并,得出区域旅游经济韧性的测度公式为:
当Re>0时,数值越大表示区域旅游经济韧性越高;当Re<0时,数值越小表示区域旅游经济韧性越低。
1.1.2 空间马尔科夫模型
式中:Lag表示空间滞后,xi为区域i的旅游经济韧性,wij为邻域j的观测值对于位置i的空间滞后权重。权重值的确定采用邻近标准:即如果i区域与j区域相邻,wij=1;否则wij=0。
将区域旅游经济韧性在初始年份和下一年份属于同一类型的区域转移定义为“平稳”型;若区域旅游经济韧性提高,则该区域的类型为“向上转移”;反之,则为“向下转移”。按照0~1/3、1/3~2/3、2/3~1的水平,将旅游经济韧性水平分为低、中、高3个层次。对于k个条件矩阵而言,mij(k)表示以k为空间滞后的条件,某个区域在该年份属于i而在下一年份转移为类型j的概率。通过比较概率矩阵中的元素和对应数值,可以了解一个区域的类型变动与周边邻域区域旅游经济韧性转移状态的关系,进而分析其时空演化特征。
1.1.3 地理探测器
式中:q表示探测因素对旅游经济韧性空间分异的解释程度,取值[0,1],各因素对区域旅游经济韧性的影响随数值增大而增大,通过对比各因素的q值,可以识别出影响省域旅游经济韧性空间分异的主要因素。n为研究区域的总样本数;σ2为研究区域的总离散方差;L为次级区域样本数;ni、σi2分别为区域i的样本数和离散方差。
1.2 指标选择与数据来源
(2) 外部社会经济要素。包括区域经济、交通状况、市场因素、城镇化以及产业结构等。① 区域经济:用人均GDP表示(万元),区域经济是地区旅游发展的基础[42],也是影响区域旅游业韧性的重要因素之一。② 交通状况:交通涉及区域可进入性,选用能反映游客出游能力的全社会客运量(万人)来表示交通区位,该指标更能代表地区交通状况[39]。③ 市场因素:市场化是推动区域旅游健康发展的重要力量,本文采用王小鲁等[43]的市场化指数来代表市场状况。④ 城镇化:城镇化为区域旅游发展提供坚实的物质基础,人口城镇化是城镇化的主要特征之一,采用常住城镇人口占总人口的比重来表示[44]。⑤ 产业结构:产业结构状况包括产业结构高级化与合理化[45],产业结构是影响区域韧性的重要因素,利用产业结构高级化与合理化指数,考察产业结构因素对旅游经济韧性的影响。
本文数据如无特殊说明,均来自《中国旅游统计年鉴1998—2018》《中国文化和旅游统计年鉴2019—2021》《中国区域经济统计年鉴1998—2021》,国家统计局官网(
2 旅游经济韧性测度
2.1 旅游经济发展状况
1997年以来,中国旅游业发展迅速,如图1所示。从绝对增长量看:疫情前的2019年为改革开放以来中国旅游发展的一个顶点,全年旅游总收入达到6.630万亿元,相当于1998年的19.283倍。尽管2019年年底发生疫情,但2020年年底的旅游总收入仍是1998年的6.48倍。从相对增长率看:1998—2020年中国旅游业呈现出波动性增长的特征,增长率曲线在2003、2020年2年出现了较大的下降。2003年的“非典”、2019年年底的新冠疫情突发事件对旅游经济发展产生了巨大的冲击,尤其是新冠疫情使得中国旅游经济的绝对与相对增长率均出现“腰斩”现象。此外,从图1还可以看出:“非典”之后旅游经济的增长曲线总体上高于之前,旅游产业的恢复能力较强;虽然旅游产业遭受了新冠疫情的巨大冲击,但度过疫情冲击难关之后,旅游产业可能具有更大的发展前景。
图1
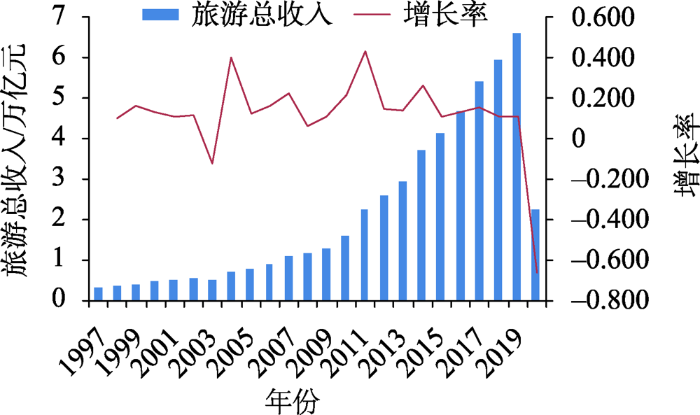
图1
1997—2020中国旅游总收入与增长率
Fig.1
Total tourism revenue and growth rate in China during 1997-2020
就各地区而言,中国各地区旅游经济及增长率的空间分布如图2所示。即使考虑新冠疫情的影响,中国旅游经济的空间分布仍表现出明显的东中西地带差异① (① 根据国家统计局公布的划分标准,东部地带包括:北京、天津、河北、辽宁、上海、江苏、浙江、福建、山东、广东、广西、海南12个省份,中部地带包括:山西、内蒙古、吉林、黑龙江、安徽、江西、河南、湖北、湖南9个省份,西部地带包括:重庆、四川、贵州、云南、西藏、陕西、甘肃、宁夏、青海、新疆10个省份。下同。),与区域经济发展仍表现出一定的空间正相关。从均值来看,高值区主要分布在长三角、珠三角及京津冀三大经济增长中心及其周边地区;低值区主要集聚分布于西北内陆地区。从平均增长率来看,西部地区表现出一定的优势,尤其是西藏(29.13%)、贵州(27.98%)、内蒙古(26.96%)、甘肃(26.18%)、吉林(24.87%)等地,旅游业发展趋势向好。旅游经济强劲的发展势头,是否表明旅游经济具有很强的韧性,旅游经济韧性时空演化的格局与特征是什么?下文将进一步分析。
图2
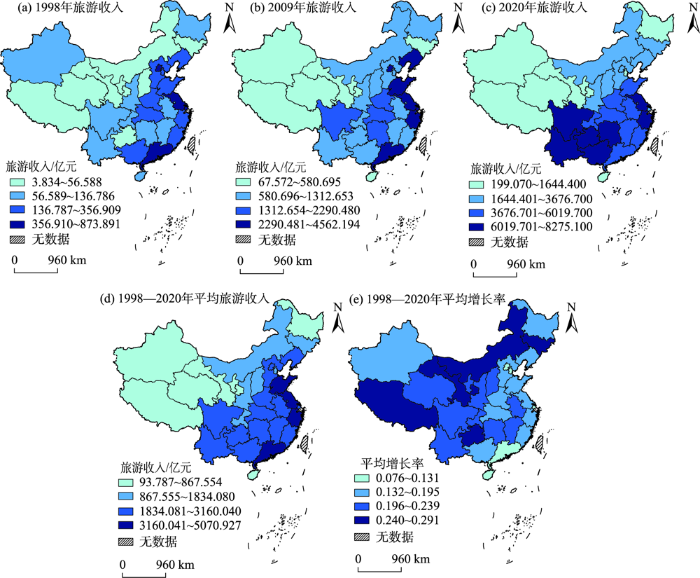
图2
中国各省份旅游收入及增长率的空间分布
注:本图基于自然资源部标准地图服务网站下载的审图号为GS(2019)1822号的标准地图制作,底图无修改。下同。
Fig.2
Spatial distribution of tourism revenue and growth rate in China
2.2 总体韧性评估
利用式(1)~(4)分别计算全国与东、中、西部旅游经济韧性,结果如图3所示。就全国而言,除个别年份(2003、2020年)外,均值均大于0,表明中国旅游经济总体上具有较高的韧性。2003年旅游经济韧性Re值为-0.736,2020年旅游经济韧性Re值为-0.998,为1998年以来最低点,新冠疫情对旅游经济的巨大冲击已经超过“非典”事件。就东、中、西三大地带而言,1998—2020年旅游经济韧性均值分别为0.778、1.186、1.100,均大于0。从数值分布看,总体表现出中部最高、西部次之、东部最低的格局。东部地区旅游发展市场化程度相对较高,竞争非常激烈,旅游发展面临的外部风险相对较大,旅游经济的数值变动较大,韧性水平相对较低;中、西部地区旅游发展的市场环境相对稳定,旅游发展面临的外部风险相对较小,因而韧性水平相对较高。
图3
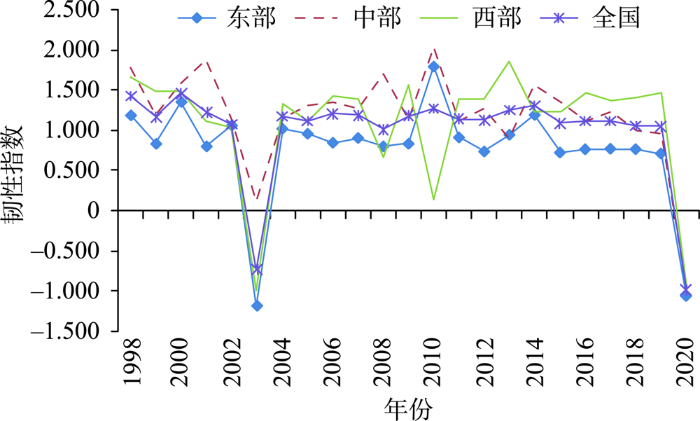
图3
全国与东、中、西部旅游经济韧性
Fig.3
Tourism economic resilience in China and the three main regions
2.3 地区韧性评估
2.3.1 韧性计算结果
分别计算1998—2020年全国各地区旅游经济韧性,利用GIS软件对数值进行可视化处理,其中1998、2003、2009、2014、2020年各地区均值的空间分布如图4所示。1998年中国旅游经济韧性数值小于0的个数较少,仅有广西旅游经济韧性数值为负值(-1.346),其他省份均为正值,表明1998年中国旅游经济具有较高的韧性。受“非典”的影响,2003年旅游经济韧性为负值的省份有16个,包括北京、河北、山西、安徽、福建、山东、河南、湖北、广东、广西、海南、重庆、陕西、甘肃、青海、宁夏等。在“非典”事件影响下,中国省域旅游经济表现出较低的韧性特征。2009年全国所有地区的旅游经济韧性均为正值,各地区旅游经济具有较高的韧性。2014年仅有少数几个省份旅游经济韧性为负值。在新冠疫情的影响之下,2020年所有地区旅游经济韧性均为负值。此外,从均值看,1998—2020年各省份旅游经济韧性的均值都为正值,反映出中国省域旅游经济具有较强的韧性。
图4

图4
主要年份各省份旅游经济韧性空间分布
Fig.4
Spatial distribution of regional tourism economic resilience in selected years
对比1998—2020年各省份旅游经济韧性可以发现:① 各省份旅游经济发展具有较强的韧性。除2003、2020年外,大部分年份旅游经济韧性水平处于正值的地区远远超过负值地区,表明省域旅游经济对外界风险具有较强的抵御和恢复能力。② 区域旅游经济韧性水平与旅游经济发展水平并非一一对应的关系。东部部分省份旅游业发达,但韧性水平相对较低,如上海、北京、天津、广东等地;中、西部地区部分省份旅游收入相对滞后,但韧性水平相对较高,如重庆、贵州、宁夏等地;此外,也存在高韧性高收入现象,如浙江、江苏等地。③ 重大突发事件对旅游经济韧性短期负向影响较大。2003年“非典”时间导致全国17个省份的旅游经济韧性指数降为负值,其中北京(-7.430)、天津(-7.186)、甘肃(-6.676)、河南(-5.808)、山西(-5.387)、海南(-0.519)韧性指数下降幅度较大;另外14个省份旅游经济韧性为正值,其中吉林(6.233)、湖南(5.321)、江苏(4.500)、内蒙古(4.094)、四川(3.307)韧性指数较高,位于中部地区的省份居多,“非典”对中国旅游经济韧性的负向冲击,主要集中在东西部地区。与“非典”相比,新冠疫情对各地区旅游经济韧性的影响是全域的,与2019年相比,旅游经济韧性均出现显著的下降。其中新疆(-1.610)、广东(-1.552)、天津(-1.520)、山西(-1.409)、陕西(-1.351)、河北(-1.340)等省份韧性水平较低。
2.3.2 韧性空间演化特征
利用空间马尔科夫链模型分析中国省域旅游经济韧性的时空演化特征。旅游经济韧性可以作为旅游经济对外界风险的某种反映,实质上也受到周边地区旅游发展的影响,因此,需要引入考虑空间因素的马尔科夫链模型。各地区的转移概率矩阵如表1所示。从表1可以发现:① 表1中主对角线上的数值并非最大,表明省域旅游经济韧性的数值具有不稳定性特征。这是因为旅游产业涉及的相关产业较多,外界宏观环境的变化对旅游经济韧性产生较大的影响。② 主对角线右上部分的数值明显大于左下部分,表明省域旅游经济韧性数值总体上向高值区演化。外界风险对旅游产业的冲击,在经历恢复期之后,旅游经济韧性会得到进一步提升。③ 当韧性处于低水平时,其向高水平转化的概率较大;反之,当韧性处于高水平时,其向低水平转移的概率较小。如在空间滞后数值为1的条件下,韧性的低值向高值转移的概率为0.992,但高值向低值韧性转换的概率仅为0.058。利用GIS对韧性的计算结果进行可视化处理,结果见图5。从图5可以看出:总体上旅游经济韧性的演化具有一定空间集聚性,省域旅游经济韧性本地数值,以及周边领域数值向上、平稳、向下转移的地区基本上呈集聚分布。
表1 1998—2020年省域旅游经济韧性的空间马尔科夫转移矩阵
Tab.1
| 空间 滞后 | ti时期 韧性区域 | n | ti+1时期韧性区域 | ||
|---|---|---|---|---|---|
| 低值区 | 中值区 | 高值区 | |||
| 1 | 低值区 | 20 | <0.001 | 0.008 | 0.992 |
| 中值区 | 34 | <0.001 | 0.100 | 0.900 | |
| 高值区 | 176 | 0.058 | 0.198 | 0.744 | |
| 2 | 低值区 | 19 | <0.001 | 0.103 | 0.897 |
| 中值区 | 51 | 0.017 | 0.237 | 0.746 | |
| 高值区 | 160 | 0.049 | 0.238 | 0.713 | |
| 3 | 低值区 | 25 | <0.001 | 0.094 | 0.906 |
| 中值区 | 48 | 0.077 | 0.123 | 0.800 | |
| 高值区 | 180 | 0.049 | 0.257 | 0.694 | |
注:表中1、2、3分别表示空间滞后的低值区、中值区与高值区;“n”表示省份个数汇总。
图5
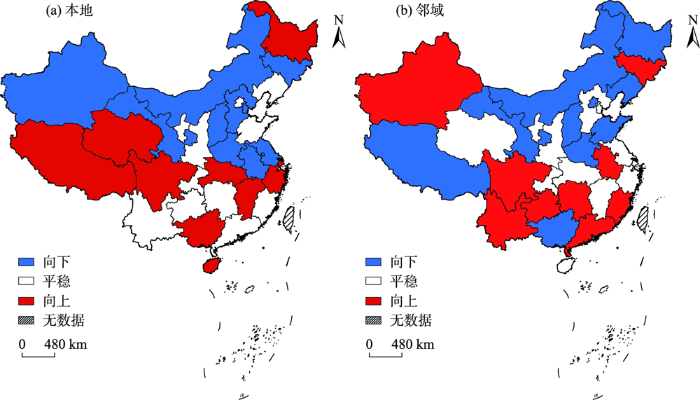
图5
旅游经济韧性及邻域的空间转移格局
Fig.5
Tourism economic resilience and spatial transfer pattern of neighboring areas
3 旅游经济韧性的影响机理分析
在遴选相关指标的基础上,利用地理探测器分析旅游业内外部各因子对旅游经济韧性的影响大小以及主导交互因子,结果如表2所示。从表2中可以发现:① 就单个影响因子而言,全国和东、中、西地带的主导因子分别是旅游从业人数(0.387)、城镇化(0.612)、市场因素(0.592)、区域经济(0.491),说明就东部地区而言,城镇化为旅游发展提供坚实的基础,对区域旅游发展具有重要的促进作用[46],进而为区域旅游经济的稳定发展提供物质基础;就中部地区而言,影响旅游经济的主导因子是市场化因素,市场规范程度是影响中部地区旅游经济韧性的主导因素;就西部地区而言,区域经济因素是影响旅游经济韧性的主导因素,西部地区大部分属于后发地区,没有稳定的经济增长,很难保持旅游经济长期韧性。② 就交互主导因子而言,影响全国旅游经济韧性的主导交互因子是旅游业固定资产与产业结构高级化;东部地区的交互主导因子是旅游资源丰富度与旅游业固定资产;中部地区的主导交互因子是交通与市场因素,西部地区的主导交互因子是区域经济与产业结构高级化。③ 从总体分析结果看,交互主导因子的数值q总体上大于单个影响因子的最大值,这说明区域旅游经济韧性的影响是“合力”作用的结果。另外,不同地带影响旅游经济韧性的主导因子与交互主导因子各不相同,从侧面反映了旅游经济韧性不仅涉及旅游业自身,同时也受到外部不同因素的综合影响。
表2 旅游经济韧性影响因素的探测结果
Tab.2
| 探测因子 | 全国 | 东部 | 中部 | 西部 |
|---|---|---|---|---|
| 旅游资源丰富度(ZY) | 0.354 | 0.285 | 0.564 | 0.400 |
| 旅游业固定资产(GD) | 0.254 | 0.161 | 0.438 | 0.302 |
| 旅游从业人员(RY) | 0.387 | 0.144 | 0.402 | 0.174 |
| 区域经济(EC) | 0.321 | 0.461 | 0.401 | 0.491 |
| 交通状况(TR) | 0.201 | 0.153 | 0.421 | 0.224 |
| 市场因素(MA) | 0.358 | 0.435 | 0.592 | 0.350 |
| 城镇化(UR) | 0.386 | 0.612 | 0.385 | 0.231 |
| 产业结构高级化(IG) | 0.315 | 0.197 | 0.182 | 0.416 |
| 产业结构合理化(IH) | 0.208 | 0.597 | 0.102 | 0.405 |
| 主导交互因子 | GD∩IG | ZY∩GD | TR∩MA | EC∩IG |
| 主导交互因子q值 | 0.705 | 0.786 | 0.727 | 0.754 |
注:GD∩IG表示旅游业固定资产与产业结构高级化的交互因子,ZY∩GD表示旅游资源丰富度与旅游业固定资产的交互因子,TR∩MA表示交通状况与市场因素的交互因子;EC∩IG表示区域经济与产业结构高级化的交互因子。
由地理探测结果可知,省域旅游经济韧性的时空演化,实际上是各种内外因素综合作用的结果。省域旅游经济韧性的影响因素可总结为3类:旅游产业内部要素、外部社会经济要素以及其他无法量化因素,主要包括:国家政策、社会突发事件等。地理探测器揭示了旅游产业内部要素、外部社会经济要素对省域旅游经济韧性的影响,根据不同地带交互主导因子的探测结果,省域旅游经济韧性的影响机理实际上可分为“内生驱动型”与“外生驱动型”2大类。东部地区旅游经济韧性属于“内生驱动型”,旅游经济韧性主要受旅游资源与旅游业固定资产两大内部因素的影响,东部地区旅游产业发展具有雄厚的基础,依靠“内循环”短期内能够支撑产业的稳定发展。中西部地区属于“外生驱动型”,虽然交互主导因子不同,但基本都和旅游业外部因素密切相关,交通、市场、区域经济、产业结构高级化等因素仅仅依靠本行业与本地社会,很难全盘激活,需要地带之间的交流,尤其是与东部地区的交流合作,“外循环”对中西部地区旅游业健康稳定发展更加重要。
影响机理的分析为客观认识及提升旅游经济韧性提供了相关理论依据。旅游经济业健康稳定发展,一方面需要依靠内部资源、资本、人力资源的合理投入;另一方面也需要外部环境的支持,旅游业本质上与外部社会经济环境密切相关;此外,旅游业还受到宏观政策因素、社会突发事件等因素的影响。
4 结论与展望
4.1 研究结论
本文利用1998—2020年中国旅游经济发展相关数据,在对旅游经济韧性进行测度的基础上,分析其时空演化规律并进一步揭示影响机理。主要结论如下:
(1) 1998—2020年中国旅游经济具有较强的韧性特征。不论从整体旅游经济还是从各个省份的旅游经济韧性数值看,中国旅游经济均表现出较强的韧性,个别年份的特殊事件在短期内对旅游业具有一定的冲击,但没有从根本上改变旅游经济长期向好的趋势。
(2) 中国省域旅游经济韧性时空演化具有不稳定性与空间集聚性。空间马尔科夫链模型研究结果表明,旅游经济韧性向高值区的演化概率较高;旅游经济韧性向上、平稳、向下转移的地区基本上呈集聚分布。
(3) 不同地带旅游经济韧性的影响因素存在差异。东、中、西地带的主导因子分别是城镇化、市场因素、区域经济;从交互主导因子看,产业结构高级化是影响全国、西部旅游经济韧性的重要主导交互因子;交互主导因子的数值q总体上大于单个影响因子的最大值,旅游经济韧性的影响是“合力”作用的结果。
(4) 省域旅游经济韧性测度与时空演化机理分析为提升韧性提供了理论基础。东部地区旅游经济韧性属于“内生驱动型”,而中西部地区属于“外生驱动型”。东部地区旅游经济韧性提升,在优化旅游产业内部要素投入的同时,需要进一步完善城镇化建设、优化产业结构;中西部地区旅游经济韧性提升需要外部宏观经济社会要素的支持,同时也需要加强与东部地区的交流。
4.2 研究展望
未来不同地区应该采取相应的措施,提升旅游经济韧性:东部地区旅游发展相对成熟,市场竞争激烈,旅游产业发展需要进一步优化内部资源、资本、人力资源等要素投入,完善城镇化建设;同时优化产业结构布局,为旅游发展营造良好的外部环境,进而促进省域旅游经济韧性的提升。中西部地区旅游发展更大程度上属于“外生驱动型”,一方面需要宏观社会经济要素的支持,另一方面也需要依靠与东部地区的要素交流。未来中西部地区需要进一步完善市场化、提升交通可达性,努力促进产业结构转型升级,夯实旅游业发展的基础设施。除此之外,宏观政策上也要加强对旅游业的合理引导,努力规避“黑天鹅”“灰犀牛”等事件对旅游经济的负面冲击。
旅游经济韧性关系到区域旅游的健康稳定发展,是旅游高质量发展的重要指标。指标与方法的选择不同是否会产生不同的研究结果,今后可进一步拓展。本文研究结论基本符合旅游发展现实,未来可进一步开展以下研究:① 入境旅游收入与国内旅游收入指标在各区域存在明显差异,其韧性测度与时空演化机理有何不同,未来可加强对比研究;② 本文利用地理探测器分析了不同因素对旅游经济韧性的影响关系,实际上各要素与旅游经济韧性的关系可能是“非线性”,未来可对这一非线性关系开展深入研究。
参考文献
新冠疫情冲击、经济韧性与中国高质量发展
[J].
Shocks of 2019-nCoV, economic resilience and China's high quality development
The evolution of regional economic resilience in the old industrial bases in China: A case study of Liaoning Province, China
[J].DOI:10.1007/s11769-020-1105-4 [本文引用: 1]
中国地级及以上城市网络结构韧性测度
[J].
DOI:10.11821/dlxb202106006
[本文引用: 1]

随着城市间关系趋向于网络化发展以及外部急性冲击和慢性压力的增加,城市网络结构韧性作为衡量区域韧性的重要手段,致力于评估城市网络系统在面对突发故障或扰动时,能够抵御、吸收和恢复原有网络特征和重要功能的能力。以中国346个地级及以上城市为研究对象,采用2017年百度指数、腾讯人口迁徙大数据等,在构建信息、交通、经济和综合城市联系网络的基础上,从城市节点和网络层面对其层级性和匹配性进行测度,并对中断场景下网络的传输性和多样性进行分析,进而针对各网络从不同视角提出网络结构优化策略和建议。结果表明:① 2017年中国346个地级及以上城市的信息、交通、经济和综合联系网络整体上呈现以“胡焕庸线”为界的“东密西疏”的分布格局,但空间结构各有特点。② 信息、交通和经济三大网络的层级性排名依次为经济>信息>交通网络。大城市及省会城市因其信息技术的快速创新与传播、产业经济的高度发展与集聚及交通基础设施的快速配备与完善在网络中具有更高的层级。③ 信息、交通、经济三大网络均具有异配性特征。信息网络中高权重节点与低权重节点间的跨区域交流机会更多,因而具有最高的异配韧性。④ 信息网络的传输与多样韧性稍高于经济网络,远高于交通网络。同一城市节点的故障或中断在影响网络传输性的同时,也会累及网络的多样性。
Network structure resilience of cities at the prefecture level and above in China
DOI:10.11821/dlxb202106006
[本文引用: 1]
With the rapid development of information technology, the interweaving physical infrastructure and virtual urban networks show more abundant connotations. As one of the most effective indicators to measure regional resilience, urban network structure resilience focuses on the capacity of the urban network system to restore, maintain, or improve the original network characteristics and important functions when faced with external acute shock and chronic pressure. Therefore, evaluating the resilience of the urban network structure is of great significance for recognizing and understanding regional resilience. Taking 346 cities of China at the prefecture level and above as the research objects, this study constructed information, transportation, economic, and comprehensive connection networks based on the Baidu index, Tencent location services, and social statistics data. The resilience of the urban network was then measured and evaluated in four aspects: hierarchy, heterogeneity, transmissibility, and diversity. The last two properties are in interrupting simulation scenarios. Accordingly, the optimization strategies and suggestions for the network structure were put forward. Based on the results, the following conclusions can be drawn: (1) Although China's information, transportation, economic, and comprehensive networks among the 346 prefecture-level cities and above in 2017 presented a spatial pattern of "dense in the east and sparse in the west" with "Hu Huanyong Line" as the boundary, their spatial structures exhibit their own characteristics. (2) The hierarchy of information, transportation, and economic networks from strong to weak is in the following order: economic network > information network > transportation network. Large cities and provincial capital cities have a higher hierarchy in a network because of the rapid innovation and dissemination of information technology, the high development and agglomeration of industrial economy, and the rapid allocation and improvement of traffic infrastructures. (3) The three major networks of information, transportation, and economy are all heterogeneous. In the information network, there are more opportunities for cross-regional communication between high-weighted and low-weighted nodes, thereby exhibiting the highest heterogeneous resilience. (4) The transmissibility and diversity resilience of information network was slightly higher than those of the economic network and much higher than those of the transportation network. Failures or perturbations of a city have almost the same impact on network transmissibility and diversity. Cities that have a great impact on the resilience of China's urban network structure typically exhibit high centrality and control power. These cities not only have a higher level of economic development and a relatively sound transportation hub, but also exhibit superiority with regard to their geographical conditions and distribution of natural resources.
Tourism and resilience
[J].DOI:10.1016/j.tourman.2018.10.007 URL [本文引用: 1]
区域经济韧性研究进展和在中国应用的探索
[J].
Research progress of regional economic resilience and exploration of its application in China
DOI:10.2307/142031 URL [本文引用: 1]
城市韧性研究进展与展望
[J].
DOI:10.18306/dlkxjz.2020.10.011
[本文引用: 1]
在全球环境变化和快速城市化的背景下,各种不确定风险成为制约城市安全和可持续发展的重要障碍。城市韧性作为一种城市风险治理的新思路,如何提高城市抵御、消解、适应不确定风险的能力,建设有韧性能力的城市,正成为当前地理学及其相关学科领域亟待探索的新课题。论文在概述城市韧性的研究缘起与概念内涵的基础上,从多种要素(人文要素、环境要素、灾害扰动)对城市韧性的影响、城市韧性框架、城市韧性评价及模拟研究等方面出发,对可持续发展视角的城市韧性研究现状进行探讨,并指出当前城市韧性研究在理论框架、作用机理、实证研究、差异性分析等方面仍存在诸多薄弱环节。最后,对城市韧性重点研究方向进行展望,即应以理论框架为引领,推动多目标、多层次、多视角的系统评价研究;以机理解析为支撑,实现城市韧性的动态模拟与决策预警的新突破;以实证研究为导向,继续加强多学科融合和探索城市韧性的应用模式;遵循差异性规律,实现城市规划治理从统一的“多城一策”向灵活的“一城一策”转变。
Progress and prospect of urban resilience research
DOI:10.18306/dlkxjz.2020.10.011
[本文引用: 1]
Under the background of global environmental change and urbanization, various risks and uncertainties have posed an important obstacle on urban security and urban sustainable development. As a potential new approach of urban risk management, urban resilience can improve the ability to resist, dissolve, and adapt when facing risks and uncertainties, and expound the adaptive scheme of risks in the process of rapid urbanization. Urban resilience has been a new topic in geography and related disciplines. Based on the origin and concept of urban resilience research, from the perspective of the impact of various factors (human, environmental, disaster) on urban resilience, this study constructed a theoretical framework of urban resilience, including evaluation and scenario simulation, and discussed the status of urban resilience research, pointing out that there are still many weak links in the theoretical framework, mechanism, practical application, and difference analysis of urban resilience research. Finally, the key directions of urban resilience research were also discussed. The theoretical framework should be used as a guide to promote multi-objective, multi-level, and multi-perspective systematic evaluation research. With the analysis of mechanism as support, studies should aim to achieve a new breakthrough in process simulation of urban resilience and decision making and early warning. Oriented by empirical research, studies should continue to strengthen the application model of multidisciplinary integration and exploration of urban resilience. Considering regional differences, further work should try to achieve a change in urban planning from the unified "one policy for multi-city" approach to the flexible "one policy for one city" approach.
城市韧性的概念演进、研究内容与发展趋势
[J].
The evolution of the urban resilience concept, and its research contents and development trend
韧性概念演变与区域经济韧性研究进展
[J].
Review on the evolution of resilience concept and research progress on regional economic resilience
中国东部沿海五大城市群旅游流网络的结构特征及其韧性评估: 基于演化韧性的视角
[J].
Structural characteristics and resilience evaluation of tourism flow networks in five major urban agglomerations in coastal China: From the perspective of evolutionary resilience
汶川Ms 8.0地震极重灾区的经济韧性测度及恢复效率
[J].
DOI:10.11821/dlxb201910009
[本文引用: 1]
揭示灾后经济发展状态和恢复过程,按照灾区经济韧性科学制定灾后经济重建的调控政策与恢复手段,对增强灾害防范与系统应对能力具有重要意义。以汶川地震极重灾区为案例,基于长时序社会经济面板数据与ARIMA模型,测算灾区经济韧性指数,并运用改进的规模报酬可变DEA模型、Malmquist生产率指数分析灾后年际经济恢复效率及影响效应。结果显示:① 汶川地震极重灾区经济韧性指数为0.877,地震导致灾区短期经济衰退,但2年内恢复至震前水平,工业经济韧性低于农业和服务业。② 受灾当年灾区经济恢复综合效率为0.603,其中,平原丘陵区综合效率、纯技术效率、规模效率均显著优于高原山地区。③ 灾后全要素生产率的年际波动强烈,经济恢复效率显著下降造成短期经济衰退,灾后2年TFP指数下降33.7%和15.2%后恢复至稳态。④ 灾后恢复效率显著下降主因为技术变动因素,而生产体系更新程度决定了灾后经济韧性。随着灾后经济恢复的规模收益下降,灾区经济恢复主要依赖纯技术效率,提升纯技术效率是保持灾后经济长期增长的动力。可见,针对重建自然条件和经济发展阶段的差异性,灾区当地需积极进行经济结构调整和再适应,同时,通过生产体系更新提升技术进步水平,以发挥灾后大规模资金、设施、人力等要素投入的规模效应,从而增强应对灾害冲击的经济韧性与恢复效率。
Economic resilience and recovery efficiency in the severely affected area of Ms 8.0 Wenchuan earthquake
DOI:10.11821/dlxb201910009
[本文引用: 1]
It is of great significance to enhance disaster prevention and response capacity to reveal the post-disaster economic development and recovery process, and to formulate the control policies and recovery methods for post-disaster economic reconstruction according to the economic resilience. Based on the long-term socio-economic data and ARIMA model, this paper calculated the economic resilience index of severely affected area of Wenchuan earthquake, and adopted the improved Variable Return to Scale (VRS) DEA model and Malmquist productivity index to analyze the efficiency and effect of annual post-disaster recovery. The results show that: (1) The economic resilience index of earthquake severely affected area is 0.877. The earthquake caused a short-term economic recession in the affected areas, but the economy returned to its pre-quake state within two years. In addition, the industrial economy is less resilient than agriculture and service industries. (2) The comprehensive economic recovery efficiency of the disaster-stricken area in the year after the disaster is 0.603. The comprehensive efficiency, pure technical efficiency and scale efficiency of the plain hilly area are significantly higher than those of the plateau mountain area. (3) The annual fluctuation of total factor productivity after the disaster was strong, and the economic recovery efficiency declined significantly, resulting in a short-term economic recession. The TFP index returned to steady state after a decline of 33.7% and 15.2% in the two years after the disaster. (4) The significant decline in the post-disaster recovery efficiency is mainly caused by technological changes, and the renewal of production system is the leading factor in determining the economic resilience after the disaster. With the decline in the scale of economic recovery, the long-term economic recovery in the study areas mainly depends on pure technical efficiency, and the improvement of pure technical efficiency is the driving force to maintain the long-term growth of post-disaster economy. Therefore, in view of the differences between the reconstruction of natural conditions and the stage of economic development, the disaster-stricken areas need to change and readjust their economic structures actively. Meanwhile, we should pay attention to updating production system to enhance the level of technological progress, and give full play to the scale effect of large-scale capital, facilities, manpower and other factors investment, so as to enhance the response to the disaster impact of economic resilience and recovery efficiency.
Climate change: Vulnerability and resilience of tourism and the entire economy
[J].DOI:10.1016/j.tourman.2018.12.010 URL [本文引用: 1]
Living in a wildfire: The relationship between crisis management and community resilience in a tourism-based destination
[J].
The economic resilience of tourism industry in Italy: What the Great Recession data show
[J].
中国区域经济韧性特征与影响因素分析
[J].
DOI:10.13249/j.cnki.sgs.2020.02.002
[本文引用: 1]
从经济维持性和恢复性2个方面定量化分析中国31省(市)(未包含港澳台数据)应对1997年亚洲金融危机和2008年全球金融危机的经济韧性特征,并对其主要影响因素进行了研究。结果发现:① 在亚洲金融危机中,西部地区的经济维持性较高,中部地区的经济维持性普遍较低;经济恢复性较高的省市主要集中在中部地区,而东部和西部地区经济恢复性较低,经济维持性和经济恢复性呈现一定的负相关。② 各省(市)应对全球金融危机的经济维持性普遍较高,经济维持性较低的区域主要分在东部沿海区域和沿长江经济带地区,而经济维持性较高的区域主要集中在西部地区。③ 在亚洲金融危机中,第二产业表现出了较强的经济韧性,而在全球金融危机中第三产业经济韧性较好。④ 影响2次经济危机中韧性能力的主要因素是不同的,区位条件、人均固定资产投资额和人均GDP的解释力较强,但在2次经济周期中的作用方向不同。
Regional economic resilience and influential mechanism during economic crises in China
DOI:10.13249/j.cnki.sgs.2020.02.002
[本文引用: 1]
This article quantitatively analyzes the economic resilience of 31 provinces of China in terms of resistance and recoverability during two economic crises: the Asian financial crisis in 1997 and the global financial crisis in 2008. Moreover, it analyzes the main factors that affected regional resilience. There are three main findings. Firstly, in the first economic cycle, the economic resistance in western region was relatively high, and the central region was low; the provinces with high economic recoverability were mainly concentrated in the central region, while those in the eastern and western regions were lower, with economic resistance and recoverability showing a certain negative correlation. All regions in second economic cycle demonstrated well resistance; those with low economic resistance were mainly located in the eastern coastal areas and along the Yangtze River Economic Belt. Thirdly, the secondary industry was stronger than the tertiary industry in terms of economic resilience during the first economic cycle, while the situation was different in the second economic cycle. Finally, the influential factors affecting economic resilience varied across the two economic cycles; location advantage, per capita fixed asset investment and per capita GDP had strong explanatory power on economic resilience, but the direction of action in the two economic cycles was different.
COVID-19疫情对中国城市人口迁徙的短期影响及城市恢复力评价
[J].
DOI:10.11821/dlxb202011017
[本文引用: 1]
新型冠状病毒肺炎(COVID-19)疫情对中国国民经济和社会发展产生剧烈冲击。科学评价中国受新冠疫情短期影响及恢复情况并揭示其时空特征,可为常态化疫情防控阶段的经济形势研判和城市恢复提供有力支撑。基于2020年1月13日—4月8日百度迁徙大数据,通过构建恢复指数(RRI)和恢复缺口(RGI)等指标,从多尺度揭示中国受COVID-19疫情短期影响的逐日特征、阶段特征以及时空格局。结果发现:① 疫情未影响春节前返乡迁徙,节后恢复经历恢复停滞期、快速恢复期、平稳恢复期,全国总体恢复程度由恢复停滞期不足20%上升至快速恢复期末60%左右,3月3日开始进入平稳恢复期,恢复指数达70%以上,完全恢复至历史同期水平仍需较长时间。② 疫情对周末和节假日城市间交往活动影响显著,中部和东北地区尤为明显。③ 疫情影响的区域差异性明显,相对恢复程度西部>东部>中部>东北地区。④ 城市间恢复程度差异显著,节后至4月8日呈现南高北低空间格局。结合疫情程度,广州、深圳、重庆处于高确诊高恢复聚类,河北、天津、黑龙江、河南、安徽、湖南处于低确诊低恢复聚类。⑤ 随着疫情有效控制,城市层面恢复缺口由京津冀、长三角、珠三角等城市群的大规模成片劳动力迁入缺口,转变为国家中心城市和部分省会城市的点状缺口。本文研究结果表明时空大数据在重大突发公共卫生事件实时影响评价方面具有较好应用前景。
The short-term impact of COVID-19 epidemic on the migration of Chinese urban population and the evaluation of Chinese urban resilience
DOI:10.11821/dlxb202011017
[本文引用: 1]
The COVID-19 epidemic in 2020 has a severe impact on China's national economic and social development. Evaluating the short-term impact of the COVID-19 epidemic and the recovery of China's economy and society, as well as revealing its spatiotemporal characteristics, can provide a strong support for the economic situation research and urban restoration of the normalized epidemic prevention and control stage. Based on Baidu migration big data from January 13 to April 8 in 2020 and that of the same period in history, this paper constructs the Relative Recovery Index (RRI) and Recovery Gap Index (RGI). Furthermore, it reveals the daily characteristics, stage characteristics, and spatiotemporal patterns of the short-term impact of the COVID-19 epidemic at multiple scales. The results are as follows: (1) The outbreak did not affect the travel rush before the Spring Festival. The process after the Spring Festival experienced a recovery stagnation period, a rapid recovery period, and a slow recovery period. The overall degree of recovery nationwide rose from less than 20% during the stagnation period to about 60% at the end of the rapid recovery period. The slow recovery period began on March 3, with a recovery index of over 70%. It will take a long time to fully recover to the historical level. (2) The intercity activities on weekends and in holidays were significantly weakened, especially in the central and northeastern regions. (3) The impact of the epidemic on each region is significantly different, in terms of the RRI, the western region > eastern region > central region > northeastern region. (4) The degree of recovery varies significantly between cities. From the Spring Festival to April 8th, the spatial pattern was high in the south and low in the north. According to the severity of the epidemic, Guangzhou, Shenzhen and Chongqing are in the cluster of High confirmed case-High recovery; Hebei, Tianjin, Heilongjiang, Henan, Anhui and Hunan are in the cluster of Low confirmed case-Low recovery. (5) With the effective control of the epidemic, the recovery gap has shifted from the large-scale insufficiency of labor force in the urban agglomerations such as Beijing-Tianjin-Hebei, the Yangtze River Delta, and the Pearl River Delta into the insufficiency in the central cities and some provincial capital cities. The results of this paper show that the use of spatiotemporal big data for real-time impact assessment of major public health emergencies have good application prospects.
Resilient urban planning: Major principles and criteria
[J].DOI:10.1016/j.egypro.2014.12.154 URL [本文引用: 1]
Resident perceptions of social-ecological resilience and the sustainability of community-based tourism development in the commonwealth of Dominica
[J].DOI:10.1080/09669582.2013.776059 URL [本文引用: 1]
基于“规模—密度—形态”的大连市城市韧性评估
[J].
DOI:10.11821/dlxb201812004
[本文引用: 1]
以建设安全城市为目标,依据地理学和景观生态思想方法,构建基于“规模—密度—形态”的三维城市韧性研究框架,并对2000-2016年大连市各县市区的城市韧性进行评估。其中规模韧性利用生态基础设施工具进行度量,密度韧性利用生态足迹与生态承载力工具进行度量,形态韧性基于源汇景观平均距离指数进行度量。还对各年份三类韧性的组合形式进行综合评判。本文认为,“规模—密度—形态”三位一体的韧性评估方法可有效识别城市的韧性特征,是建立城市规划与城市韧性研究之间有效联系的纽带。研究发现:① 规模安全是城市空间扩张的基本约束条件;② 生态承载力是城市密度的安全阈值;③ “源—汇”景观的空间耦合是优良城市形态的基本特征;④ 是“规模—密度—形态”三个韧性的组合状况而不是某一单项指标决定城市的安全性。基于规模、密度、形态韧性及其组合特征判定,为未来大连的城市发展提出建议:① 严格限制中心城区与金州区开发强度,遏制其蔓延式增长趋势;② 严格控制海岸带开发,维持山体和绿色植被斑块的完整性;③ 促进市域均衡开发,提升城市整体韧性;④ 优化新市区开发战略,形成良好城市形态。
Evaluation of urban resilience of Dalian City based on the perspective of "size-density-morphology"
DOI:10.11821/dlxb201812004
[本文引用: 1]
Aiming at building a safe city, this study proposed a “Size-Density-Morphology” based three-dimensional urban resilience evaluation framework according to the theories and methods of geography and landscape ecology. By using the framework, the urban resilience of each county in Dalian city during 2000-2016 was evaluated. There are three kinds of urban resilience, namely size resilience, density resilience and morphology resilience. The size resilience could be measured by ecological infrastructure tools; the density resilience could be measured by ecological footprint and ecological carrying capacity; the morphology resilience could be measured by "Source-sink" landscape average distance index. In addition, this paper also analyzed the combining forms of the three types of resilience. This study demonstrates that the three-dimension evaluation framework has a unique capacity to identify the resilience characteristics of city, and it is a key bond which creates the connection of urban planning and urban resilience research. Findings are as follows: (1) The size safety is the primary constraint condition for urban spatial expansion. (2) Ecological carrying capacity is the safe threshold for urban density. (3) The spatial coupling of source and sink landscape is a basic feature of good urban morphology. (4) It is the combination of size-density-morphology resilience to determine the safety of the city rather than each single one. According to the analysis of combination characteristics of the "Size-Density-Morphology" resilience, four suggestions were put forward for the development of Dalian city in future. (1) Strictly limit the development intensity of central urban area and Jinzhou district to curb the urban sprawl trend; (2) Strictly control the development of the coastal zone and maintain the integrity of natural mountain and green vegetation patches; (3) Promote the balanced development on a whole city scale to improve the city's overall resilience; (4) Optimizing the development strategy of new urban area in order to form a good urban morphology.
Postdisaster social capital, adaptive resilience and business performance of tourism organizations in Christchurch, New Zealand
[J].
DOI:10.1177/0047287518794319
URL
[本文引用: 1]
The resilience of tourism organizations is an important issue for destinations. While studies examine the social capital of firms, researchers have yet to understand the relationship between social capital (structural, relational and cognitive) and organizational resilience as predictors of business performance. This study evaluates these relationships at the interfirm level among tourism organizations in the postdisaster context of Christchurch, New Zealand, where business performance for some tourism operations was severely impacted. Surveys of tourism organizations reveal that structural capital has a positive relationship with both cognitive and relational capital. Only relational capital has an influence on adaptive resilience. Adaptive resilience has a significant influence on business performance. By showing which elements of social capital contribute to adaptive resilience, these findings can be used by tourism organizations in their recovery phase to direct investments in building resilience and strengthening interfirm relationships.
The role of tourism in island economic growth and resilience: A panel analysis for the European Mediterranean countries (2000-2015)
[J].
DOI:10.1108/JES-04-2019-0172
URL
[本文引用: 1]
The purpose of this paper is to verifying the economic resilience of islands and, in particular, the role of the tourism sector in the reaction to the most recent economic crisis. The analysis concerns insular contexts, such as the greater island regions in the Mediterranean basin.
基于集对分析的大庆市经济系统脆弱性评价
[J].
Vulnerability assessment of petroleum city's economic system based on set pair analysis: A case study of Daqing City
千岛湖旅游地社会—生态系统适应性循环过程及机制分析
[J].
Adaptive cycles and mechanism of tourism socio-ecological system in Qiandao Lake in Zhejiang Province
DOI:10.2307/142152 URL [本文引用: 1]
国外旅游地社会—生态系统恢复力研究进展与启示
[J].
Research progress and enlightenment of tourism socio-ecological system resilience in foreign countries
DOI:10.11849/zrzyxb.2014.05.017
[本文引用: 1]
Resilience thinking and method are applied to socio-ecological system, providing a fresh and useful way to explore global sustainable development. Sustainable tourism is an important part of global sustainable development and tourism destination also is an important socio-ecological system. Therefore, resilience theory can better explain the complexity, dynamic and synthesis of tourism destination. It has become an important way to study the tourism sustainable development. It is conducive to better understand the changing relationship between tourism and environment. Based on a large number of foreign studies on socioecological system resilience, this article provides an overview of the related theories and summarizes the scale, the object, the methods and the contents on resilience. Scales in these case studies include large, medium and small scales. The objects are divided into two categories, one is for different types of tourist destinations, such as protected areas, national parks, etc., and the other is the key factors and interference factors of socio-ecological system of tourism destinations, such as communities, stakeholders, and other sudden events. In research methods, currently studies use sociological survey methods, statistical methods, mathematical modeling and GIS and remote sensing, etc. In research contents, studies focused on the understanding tourism socio-ecological system, analyzing relationship between resilience and other concepts, identifying the threshold and driving factors, building the conceptual model and quantitative assessment, adaptive management, and so on. Foreign scholars currently have reached a consensus on tourism socio-ecological system. First, tourism should be included in socio-ecological system. Second, resilience thinking and methods are suitable for tourism socio-ecological system research. At the same time, there are indiscriminate use, such as resilience, sustainability, vulnerability and sensitivity, etc. Therefore, we suggest some future study for better understanding tourism socio-ecological system resilience. There are still critical questions to be solved in the future.
旅游社会—生态系统及其恢复力研究
[J].
Tourism social-ecological systems and resilience research
中国旅游经济系统韧性的时空变化特征与影响因素分析
[J].
Spatial-temporal evolution characteristics and influencing factors of resilience of tourism economic system in China
疫情冲击下我国省域旅游经济韧性空间差异与组态影响研究
[J].
Configurational analysis and spatial difference of provincial tourism economy resilience under the impact of epidemic in China
旅游发展影响下农业文化遗产社区韧性感知研究: 以河北宣化传统葡萄园为例
[J].
DOI:10.12342/zgstly.20210035
[本文引用: 1]
农业文化遗产作为重要的旅游资源之一,其动态保护关系到遗产地社区的生计选择、农民的生活改善和乡村的可持续发展。面对旅游活动所带来的一系列人为干扰,遗产地社区如何应对关系到农业文化遗产的可持续利用以及乡村振兴的实现。本文以河北宣化传统葡萄园为例,运用基于地方居民感知的指标测量法,针对社区居民进行旅游发展影响下农业文化遗产地社区韧性感知研究。研究结果显示:(1)旅游发展对于农业文化遗产地社区存在着较为积极的影响;(2)农业文化遗产地社区韧性各个子系统受旅游发展影响程度存在着一定的差别,由高到低分别为社会、生态、文化、经济、制度;(3)各旅游因子发挥了不同的作用,其作用程度由高到低分别为旅游设施因子、旅游形象因子、旅游产品因子和旅游规模因子。本文探究了农业文化遗产社区韧性在旅游发展中受到何种影响,分析其形成原因,以期实现农业文化遗产保护与可持续旅游的协调发展。
Research on the perception of resilience of agricultural heritage community under the influence of tourism development: Taking the traditional vineyards system of Xuanhua, Hebei Province as an example
DOI:10.12342/zgstly.20210035
[本文引用: 1]
Problems about agriculture, ruralareas, and peasantryare fundamental issues related to national economy and people's livelihoods. Solving those problems is of great significance for rural revitalization. Rural tourism is one of the effective means to implement the rural revitalization strategy in the new era. As an important resource of rural tourism, the dynamic conservation of agricultural heritage is related to the sustainable development of villages, the improvement of farmers livelihoods, and the green and high-quality production of agriculture. Agricultural heritage tourism takes place in rural areas and is closely related to rural tourism. Agricultural communities play an important role in it. In the face of a series of human disturbances caused by tourism activities, the adaptability of the community is crucial. This study took the traditional vineyards of Xuanhua, Hebei as an example. Based on the impact of tourism activities, the residents’ perception method was used to measure the resilience of the community. The aims of this study are to achieve the coordinated development of agricultural heritage sites protection and sustainable tourism, and to provide insights for the development of rural tourism. The following conclusions are proposed: (1) Tourism development has a positive impact on the communities of agricultural heritage sites. (2) During the development of tourism, the impact of the various subsystems of the community resilience of agricultural heritage sites is different.Ranging from high to low in terms of impact,subsystems are society, ecology, culture, economy, and institution. (3) In the process of tourism development, each tourism factor plays a different role. Ranking the significance of their roles from high to low, factors are tourism facility, tourism image, tourism product and tourism scale.
社区营造与乡村旅游社区韧性培育研究: 以四川省成都市蒲江县明月村为例
[J].
Research on community building and resilience cultivation of rural tourism communities: Taking Mingyue Village, Pujiang County, Chengdu City, Sichuan Province as an example
城市旅游环境系统韧性的系统动力学研究: 以兰州市为例
[J].
A study on system dynamics of the resilience of urban tourism environment system: A case study of Lanzhou City
The resilience of cities to economic shocks: A tale of four recessions (and the challenge of Brexit)
[J].
DOI:10.1111/pirs.12430
[本文引用: 1]
This paper examines the resilience of British cities to major economic shocks. Using a novel data set for 85 cities, it analyses their resistance to and recovery from the last four major recessions, over the period 1971 to 2015. It reveals a distinct shift in the relation between resistance and recovery between these shocks, as well as major differences between northern and southern cities. Some possible factors shaping these patterns are explored, and tentative estimates of the likely impact of the Brexit shock (Britain's withdrawal from the European Union) are also provided. A key implication is that differences in resilience to major shocks can contribute to the long-run growth paths of cities.
粤港澳大湾区经济韧性的特征与空间差异研究
[J].
DOI:10.11821/dlyj020200418
[本文引用: 1]
当前区域经济韧性的测度研究的测度维度较为单一地聚焦在GDP之上,缺乏揭示韧性在其它经济指标上的表现;同时过于注重区域内因素,忽略了外向联系的影响。因此,本研究以粤港澳大湾区为例,选择5个经济指标对大湾区的经济韧性进行多维度测算,并借助关系经济地理学理论视角,对区域内部差异的形成原因给予解释。主要得到三个结论:第一,区域的经济韧性难以从单一维度来判定,多维度指标所揭示的经济韧性存在显著差异,其中GDP所表现出来的区域经济韧性较为保守,而就业指标所表现出来的经济韧性变动较大。第二,大湾区内部各城市的经济韧性存在显著差异,这些差异与区位和GDP规模无显著关系,而与其产业经济结构和嵌入全球生产网络方式有显著关系。第三,湾区城市在经济韧性表现的差异可以用战略耦合来进行初步解释,深圳因自主耦合而经济韧性表现最佳,佛山和广州次之,香港和澳门因以依附耦合的方式嵌入全球金融和酒店网络,因而经济韧性相对较差。本文为经济韧性研究提供了大湾区案例和新的分析视角,推动了关系经济地理学在经济韧性研究中的应用。本文建议未来要重视基于定性方法的经济韧性研究。
Economic resilience and spatial divergence in the Guangdong-Hong Kong-Macao Greater Bay Area in China
DOI:10.11821/dlyj020200418
[本文引用: 1]
The contemporary research of measuring regional economic resilience tends to focus on GDP index, while lacks of considering the other dimensions. Meanwhile, it overlooks the impacts from extra-regional linkage. Therefore, this study takes the Guangdong-Hong Kong-Macao Greater Bay Area (GBA) as an example to measure the economic resilience based on five selected economic indicators, namely, GDP, gross export value, industrial added value, total retail sales of consumer goods, and number of the unemployed. Drawing upon the Resis index proposed by Martin and Gardiner in 2019, this paper calculated the relative resilience of cities in GBA. The result showed that Shenzhen has the best resilience, Guangzhou and Foshan ranked second, followed by Dongguan and Zhuhai. In contrast, Hong Kong and Macao have the worst resilience. This paper then explains the causes of regional divergence through the perspective of relational economic geography. It is argued that strategic coupling plays an important role in shaping the intra-regional divergence of resilience in the GBA. The main conclusions are as follows: First, single dimension shows limitations in depicting regional economic resilience, while multi-dimensional indicators reveals a distinctive divergence among different types of regional economic resilience. Second, intra-regional divergence of economic resilience in the GBA has been developed, which is not relevant to location and the GDP scale, but is more related to industrial economic structure and modes of embeddedness in global production networks. Third, strategic coupling can explain the intra-regional divergence. Shenzhen has been benefited from absorptive coupling with the best resilience, while Guangzhou and Foshan cities are in the medium, and Hong Kong and Macao have the worst resilience due to captive coupling with global financial and hotel networks. This paper contributes the literature with a fresh empirical case of regional resilience in the GBA and also provides an alternative theoretical framework that involves extra-regional linkages into analysis. This paper calls for more attentions of qualitative research on regional economic resilience in future, in terms of the variety of resilience from economic to social dimensions and causal mechanism of how resilience is fostered and exerts power in resistance of the shock, particularly in relation to extra-regional linkage in the contemporary global economy.
Another look at regional convergence in Greece
[J].DOI:10.1080/00343400220146759 URL [本文引用: 1]
河南区域经济增长俱乐部趋同研究
[J].
Club convergence of regional growth in Henan Province
长三角地区城市创新投入要素的经济溢出效应及趋同格局
[J].
DOI:10.18306/dlkxjz.2021.01.014
[本文引用: 2]
近年来,城市创新投入要素在长三角一体化进程中的作用不断增加。论文基于2010—2017年长三角地区各城市空间面板数据,利用空间计量模型与马尔可夫链等方法,测度创新投入要素的经济溢出效应并揭示长三角一体化背景下创新外溢对区域经济趋同格局的影响。结果表明:① 长三角地区城市创新投入和创新产出均对城市自身经济增长表现出显著的直接效应,创新投入的溢出效应显著且大于其直接效应,而创新产出的溢出效应不显著;② 受创新投入要素影响,长三角地区经济增长存在“俱乐部趋同”现象,但毗邻不同创新投入类型的城市对本地经济增长呈现出“高促进、低抑制”的态势;③ 长三角一体化经济格局呈现由中心区高水平趋同向外围低水平趋同转变的特征,且具有明显的空间转移惰性,创新投入外溢作用将加剧区域经济增长的“马太效应”;④ 经济增长类型转移的城市集中于省域边界,在局部溢出作用下表现出复杂的转移机理。基于创新局部外溢促进经济俱乐部趋同的分析结果,对长三角区域一体化发展提出针对性建议。
Economic spillover effects and convergence patterns of urban innovation input features in the Yangtze River Delta region
DOI:10.18306/dlkxjz.2021.01.014
[本文引用: 2]
In recent years, urban innovation input feature has played an increasingly role in the economic integration process of the Yangtze River Delta. This study used the spatial econometric model and Markov chain to measure the economic spillover effects of innovation input feature based on the spatial panel data of cities in the Yangtze River Delta from 2010 to 2017, and revealed the impact of innovation spillovers on the pattern of regional economic convergence under the economic integration of the Yangtze River Delta. The main conclusions are as follows: 1) The innovation features and economic growth of the Yangtze River Delta show strong spatial agglomeration characteristics, the trend of Moran's I value of innovation input feature and economic growth are similar, and the Moran's I value of innovation output feature shows an unstable trend in time series. Both innovation input and output features have positive effects on economic growth. 2) From the global view, the innovation input feature has a significant spillover effect on regional economic growth, and the spillover effect of innovation input feature is greater than the direct effect, suggesting that innovation investment will affect the pattern of economic integration development of the Yangtze River Delta; while the spatial spillover effect of the innovation output feature is not significant. 3) From the local view, cities adjacent to higher levels of innovation input are positive for economic growth by local positive spillover, and cities adjacent to lower levels of innovation input are negative for economic growth by local negative spillover. Under the spillover effects of innovation input feature, the economic growth of the Yangtze River Delta region has formed a "club convergence" phenomenon, and the spatial pattern of the regional economic structure is changing from a high level convergence in the center of the Yangtze River Delta to a low level convergence in the periphery. 4) The cities with economic growth type transferred are mainly concentrated at the provincial boundaries, showing complex transfer mechanisms under the effect of local spillovers. The developed regions and the developing regions tend to be stable and have obvious inertia of spatial transfer, and the spillover effect of innovation will exacerbate the Matthew effect of economic growth in the Yangtze River Delta. Based on the results of the analysis that innovation spillovers promote club convergence of economic growth, this study proposed specific recommendations for the development of regional integration in the Yangtze River Delta.
基于地理探测器的天津市生态用地格局演变
[J].
Pattern evolvement of ecological land in Tianjin based on geodetector
基于地理探测器和GWR模型的中国重点镇布局定量归因
[J].
DOI:10.18306/dlkxjz.2020.10.008
[本文引用: 1]
重点镇是小城镇发展的龙头,形成科学合理的重点镇布局对优化中国城市化战略格局有重要意义。论文以2004年和2014年分别公布的1887个和3675个全国重点镇为样本,对其分布及效应的变动特征进行探究,进而在地级尺度对重点镇布局的影响因子及其作用进行地理探测和局部空间回归。结果表明:① 经增补调整,中国重点镇布局及建设效应的均衡性增强,主要集聚区西移北扩,冷热点的分布突破“胡焕庸线”,经济辐射效应的分化程度减弱,体现出政策因素的有力影响。除县际均衡和区域倾斜政策外,重点镇的分布还受到海拔高度、公路网密度、常住人口城镇化率等因子的显著作用。② 因子探测器、GWR模型和交互作用探测器的结合能更精准地刻画影响因子的作用方式、方向、路径和强度。中国重点镇的布局不是5个显著性因子均匀、独立、直接作用的结果,而是影响均具空间异质性的各因子两两交互作用后增效的产物。③ 县际均衡政策与其他因子的协同作用是形成现有重点镇分布格局的主导力量;区域倾斜政策的效果总体较好,但目标区域还需更准确。
Quantitative attribution of national key town layout based on geodetector and the geographically weighted regression model
DOI:10.18306/dlkxjz.2020.10.008
[本文引用: 1]
National key towns are the leader in the development of small towns. The formation of scientific and reasonable national key town layouts is of great significance for optimizing China's urbanization strategy. Taking the 1887 and 3675 national key towns published in 2004 and 2014 respectively as samples, this study used geodector and the geographically weighted regression (GWR) model to explore the changing characteristics of their distribution and analyze the influencing factors of national key town layouts and effects at the prefecture level. The results show that: 1) After the adjustment by the government, the balance of the layout and construction effect of national key towns is enhanced. The main gathering areas moved westward and northward, the distribution of cold spots and hotspots break through the "Hu Huanyong Line", and the degree of differentiation of economic radiation effect is weakened, reflecting the powerful influence of policy factors. In addition to the inter-county balance and regional preferential policies, the distribution of national key towns is also significantly affected by factors such as altitude, road network density, and resident population urbanization rate. 2) The combination of the factor detector, the GWR model, and the interaction detector can more accurately characterize the mode of action, direction, path, and intensity of the influencing factors. The layout of national key towns is not the result of the uniform, independent, and direct effect of the five significant factors, but the product of the synergistic effect of the interaction of the factors with spatial heterogeneity. 3) The synergy between the inter-county balance policy and other factors is the dominant force in the formation of the existing layout of the key towns; the effect of the regional preferential policy is overall positive, but the target areas need to be more accurately identified.
空气污染与旅游经济的时空关系及影响机理
[J].
The time-space relationship of air pollution between tourism economy and its influence mechanism
中国省际入境旅游集散优势度与旅游经济效率的空间关系
[J].
DOI:10.11821/dlyj020190280
[本文引用: 1]
以中国省际入境旅游流为研究对象,在构建集散优势度与旅游经济效率耦合理论框架基础上,运用复杂网络分析方法和空间经济学理论揭示了2005年、2016年各省市“势-效”空间关系演化规律,并据此提出省际入境旅游与当地旅游经济间“势-效”空间关系优化的方式。研究发现:集散优势度存在显著空间分异,且随时间变化发生冷热点迁移。北京、上海、广东、四川最具集散优势。旅游综合效率值整体呈上升趋势,但两极分化现象显著,至2016年基本形成南北高低相间、东西高低分化的“S”型格局。受地区旅游经济增长、资源要素投入等因素影响,“势-效”耦合的空间关系不断调整。针对部分地区“势-效”关系存在失调,研究提出了失衡型、低水平协调型旅游地的协调机制与路径,促进“势-效”关系在空间上良性协同。
Spatial relationship between inbound tourist distribution superiority and tourism economic efficiency among provinces in China
DOI:10.11821/dlyj020190280
[本文引用: 1]
The relationship between tourist flow and tourism economic efficiency has been an important topic of research in the fields of tourism economics and tourism geography. Existing studies tend to treat them as independent subjects. In particular, few studies have investigated the spatial relationship between them. This paper aims to fill the research gap through a comprehensive analysis of inter-provincial inbound tourist flows. The paper first constructs a coupling framework between tourist distribution superiority and tourism economic efficiency. It then measures the comparative superiority and economic efficiency for the 31 provincial-level regions to reveal the temporal and spatial patterns. Several conclusions can be dawn as follows. First, inbound tourist distribution superiority shows significant differentiations at the provincial level. During the 11-year period of 2005-2016, relative superiority changed most significantly. Beijing, Shanghai, Guangdong and Sichuan have obvious advantages in attracting inbound tourists. Second, the average economic efficiency increased from 0.485 to 0.520, and the proportion of the 1st- and 5th-level provincial-level regions increased from 29.03% to 48.39%, indicating an obvious rise as well as a polarization trend. By 2016, an 'S'-shaped spatial distribution for high-level efficiency provinces had emerged. Third, the spatial relationship between distribution superiority and efficiency was altered. Specifically, the number of high-level and medium-level coordination (H-H and M-M) areas increased, while that of low-level coordination (L-L) areas decreased. Meanwhile, the number of imbalanced tourist destinations (H-L or L-H) increased. Fourth, tourist distribution superiority and tourism economic efficiency are two key variables that are closely interrelated. An imbalanced relationship between distribution superiority and efficiency affects the overall competitiveness of regional tourism. Thus it is suggested that more resources should be allocated to the weak coupling system to strengthen the relationship between tourist distribution superiority and economic efficiency. More importantly, varying strategies should be implemented for each tourist destination according to their coupling state.
旅游技术效率、旅游绿色生产率收敛性及其影响因素
[J].
Convergence and influencing factors of tourism technical efficiency, green productivity
中国旅游经济差异的空间特征分析
[J].
A study on the spatial characteristic of provincial difference of tourism economy
中国城镇化进程对旅游经济发展的影响
[J].
DOI:10.11849/zrzyxb.2014.08.003
[本文引用: 1]
论文在从理论上剖析城镇化与旅游经济发展相互作用的基础上,利用人口城镇化指数、旅游经济发展相关的时间序列数据和面板数据,实证分析了中国城镇化与旅游经济发展水平的关系以及城镇化对旅游经济增长的影响。从全国层面,1993 年到2011 年,城镇化与旅游经济发展水平存在稳定的协整关系,旅游经济发展是城镇化的单向格兰杰因果作用关系,但城镇化对旅游经济的直接推动作用并不明显;从区域层面,2000 年到2011 年,物质资本、劳动力、产业结构和市场化都是促进旅游经济增长的重要因素,城镇化通过作用于物质资本和劳动力积累、产业结构升级和市场化进程,间接地对旅游经济增长产生正的影响,促进旅游经济增长;各省年均城镇化与旅游经济水平的拟合效果较好,城镇化水平越高的地区,旅游经济越发达。研究还发现,物质资本要素对旅游经济增长的效应逐渐减弱,而劳动力、市场化、产业结构等要素对旅游经济增长的贡献日益增强,依靠市场化的改革,促进产业结构转型,加快以人为核心的新型城镇化发展,能更好地释放城镇化对旅游经济发展的潜力。
Influence of China's urbanization on tourism economic development
DOI:10.11849/zrzyxb.2014.08.003
[本文引用: 1]
Since the reform and opening up in 1978, China's urbanization pace has been quickened. Tourism industry has become one of the fastest-growing and largest industries. The purpose of this paper is to explore the interrelation between urbanization and tourism economy, and the influence of urbanization on tourism economic growth. Through theoretical analysis, the effects of consumption and investment are two engines, of which urbanization promotes tourism economic growth. Urbanization is mainly manifested in the population migration and industrial agglomeration, which promote the accumulation of material capital, human capital and the transformation and upgrading of industrial structure, and stimulate tourism economic development, in turn, also accelerate the urbanization level. On the basis of theoretical analysis, we employ the proportion of urban population to total population to represent urbanization using the time series data and panel data of related tourism economic development. We also construct the models to investigate the relation between urbanization and the development of tourism economy and the contribution of urbanization to China's tourism economic growth. First, from the national level, this paper employs ADF unit root tests, Engel-Granger Two-step Co-integration Model and Granger Causality Model to examine the long-term equilibrium and causeeffect relationship between urbanization and tourism economic development. The results show that there is a long-term stable co-integration between tourism economic growth and urbanization, and tourism economic growth is in the Granger causality with urbanization during the period from 1993 to 2011, but the direct effect of urbanization on tourism economic growth is not obvious. Second, from the regional level, based on the Cobb Douglas production function, we construct tourism economic growth model and influencing models of urbanization on tourism economic growth factors, the models show that the physical capital, labor, industrial structure and marketization are important factors promoting tourism economic growth from 2000 to 2011. Urbanization can accelerate the accumulation of capital and labor, upgrade industrial structure and push marketization. Urbanization has indirect positive effect on tourism economic growth. We still cannot take effectively the conduction effect of the tertiary industry between the urbanization and the development of tourism economy. The fitting results of urbanization with tourism economic growth of different regions is good, overall, the higher the level of urbanization, the more developed regional tourism economy. The study also shows the effect of physical capital elements on tourism economic growth is waning, while the effect of labor, marketization and industrial structure are gradually increasing. We can better release potential effects of new urbanization on tourism economic growth through relying on market-oriented reforms, promoting transformation of industrial structure and accelerating development of new urbanization.
中国产业结构变迁对经济增长和波动的影响
[J].
An empirical study on the effects of industrial structure on economic growth and fluctuations in China
中国城镇化对旅游经济影响的空间效应: 基于空间面板计量模型的研究
[J].
Spatial effect of China's urbanization on tourism economic development: Empirical research based on the spatial panel econometric model
