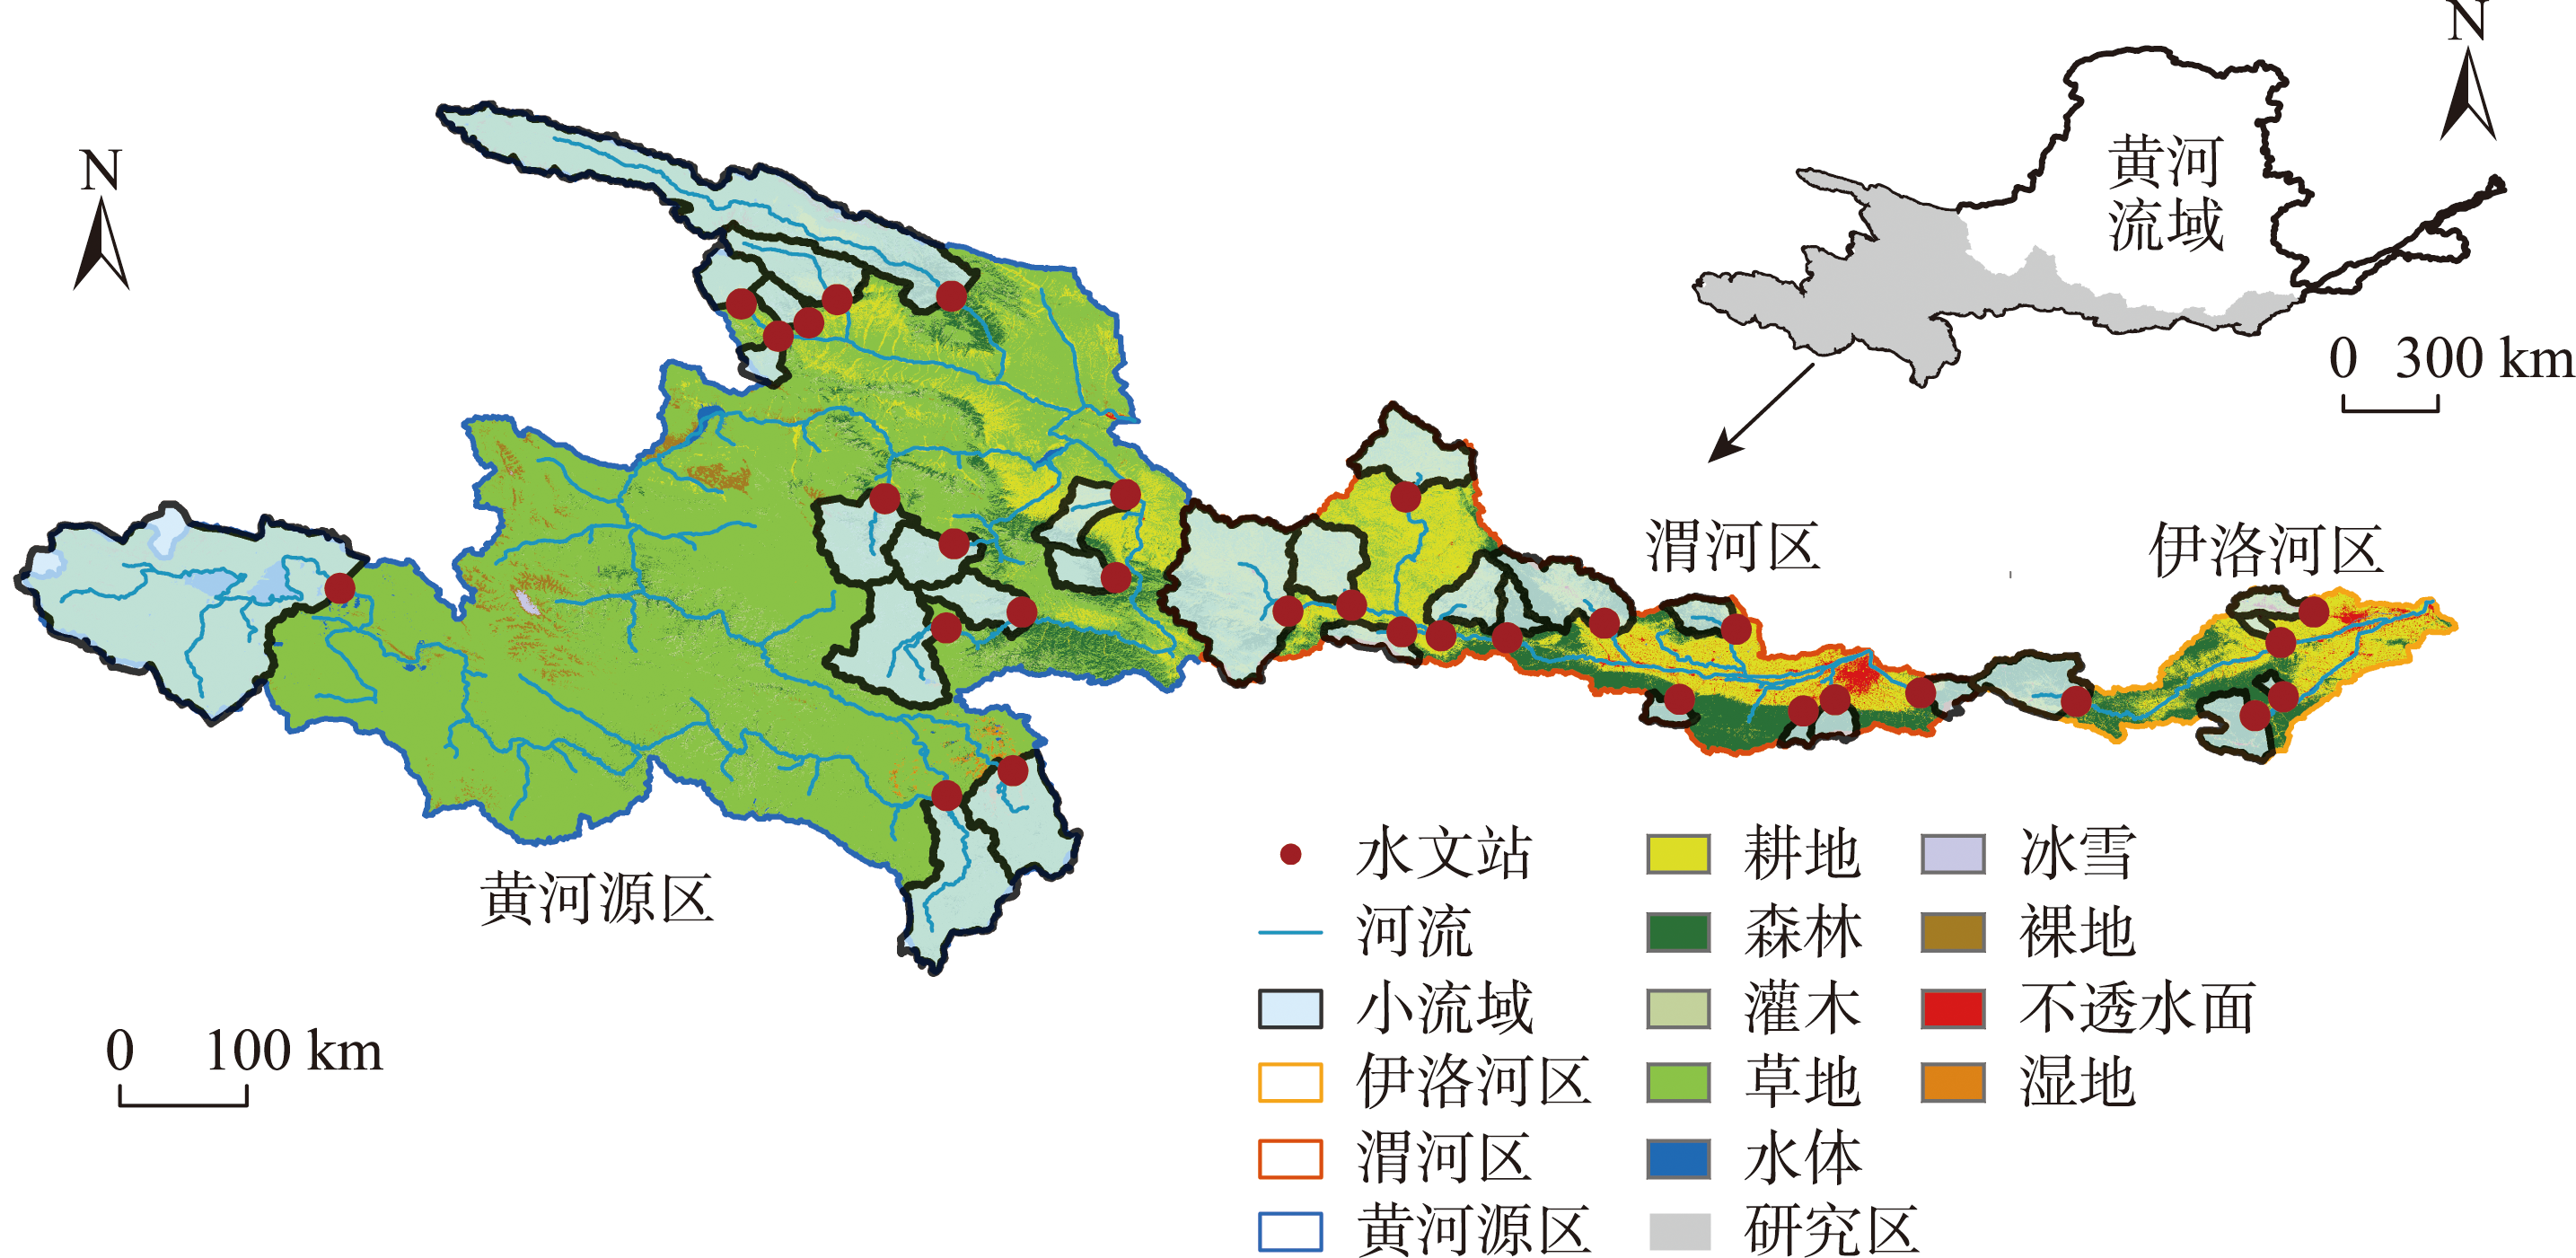
The water conservation zone of the Yellow River (including the source region of the Yellow River, the Weihe River Watershed controlled by the Huaxian Station, and the Yiluo River Watershed) is the main runoff producing area. Identifying the comprehensive change characteristics and spatial differences of flow regime can provide an important scientific basis for analyzing the water cycle evolutions and their causes in the Yellow River Basin under the changing environment. Current research focused on the influence of environmental change on runoff magnitude in the Yellow River Basin, but cannot comprehensively explain the change characteristics and spatial differences of flow regimes. In this study, 31 source small watersheds in the water conservation zone of the Yellow River were taken as the research areas. The characteristics of flow regimes, including the magnitude, rate of change, frequency, duration, and timing metrics, were comprehensively considered. The Theil-Sen trend-free pre-whitening with Mann-Kendall (TFPW-MK) trend analysis and Sen's slope estimator methods were used to detect the variation of flow regime metrics in all the watersheds from 2000 to 2020. The hierarchical clustering method was used to identify the main patterns of flow regime changes and spatial distribution characteristics. The results show that: 1) At most watersheds, significant increases in all magnitude metrics, rate of change in high flow, and low flow frequency were detected, while rate of change in low flow, high flow frequency, and all duration and timing metrics showed a significant decrease. 2) The typical flow regimes found in the Huangshui River, the Tao River, downstream of the Weihe River, and the Luohe River were more sensitive to climate change, mainly showed significant increase in high flow magnitude but decrease in timing, and significant increase in low flow frequency but decrease in duration and timing metrics. 3) The variation of flow regime characteristics was divided into three patterns. The first pattern accounted for 42%, located in the Taohe River, the Huangshui River, the trunk and tributaries of the Weihe River, and the main stream of the Yi River, with significant increases in magnitude, frequency, and rate of change, and significant decreases in duration and timing. The second pattern accounted for 35%, located in the upstream and downstream of the three major watershed divisions, with metrics of low flow increased significantly except for a decrease in rate of change; while the five type metrics in high flow all decreased significantly. The third pattern accounted for 23%, located in the middle and lower reaches of the three watershed divisions, with significant increases in magnitude and frequency, and significant decreases in rate of change, duration, and timing.
Clarifying the changes of water and carbon variables in the water conservation zone of the Yellow River is important for understanding the evolution processes of water and carbon cycles and mechanism in the Yellow River Basin, ensuring water resources and ecological security, and supporting water and carbon resources management. In this study, we investigated the spatial and temporal variation characteristics of the six typical water and carbon variables (gross primary production, net primary production, carbon use efficiency, evapotranspiration, runoff, and water use efficiency) in the water conservation zone of the Yellow River and their causes at different spatial scales, using spatiotemporal statistical analysis, Geodetector, and partial correlation analysis, based on annual water and carbon variable data, meteorological data, and vegetation leaf area index data during 2001-2018. The results show that: 1) The water and carbon variables in the water conservation zone of the Yellow River and the three subregions mainly showed a fluctuating upward trend during the study period; the spatial distribution of water and carbon variables showed obvious regional heterogeneity. The interannual mean values of the carbon variables (gross primary production, net primary production, carbon use efficiency) and the water-carbon coupling variable (water use efficiency) were in the order of Zone III (Yiluo River Zone) > Zone II (Southern Weihe Mountainous Zone) > Zone I (Upper Yellow River Zone), which decreased spatially from southeast to northwest, while the water variables (evapotranspiration and runoff) generally showed a spatial distribution pattern of high in the south and northwest and low in the central area. 2) Climatic factors, especially water-heat factors, and land surface factors jointly drove the variation of the water and carbon variables in the water conservation zone of the Yellow River. The ranking of the driving forces of the water and carbon variables detected at the regional scale did not change fundamentally, and they were mainly driven by the leaf area index, temperature, and precipitation factors; the changes of carbon and water-carbon coupling variables at the subregional and grid scales were mainly driven by the leaf area index and the changes of water variables were mainly driven by net radiation and precipitation.
Hydrological element variation analysis and key parameter identification are one of the core contents of the research on hydrological processes and model simulation in the source region of the Yellow River. In order to understand the influence of freeze-thaw action on soil hydrological elements in the source region of the Yellow River, this study compared the data from the MQ seasonally frozen soil observatory and the KQ permafrost observatory. Based on the data of field monitoring, variability of soil hydrological elements was examined and simulated by the freeze-thaw module of the HYDRUS-1D software. The results showed that: 1) The freeze-thaw process of soil leads to changes of soil hydrological elements. The saturated soil moisture (θs) of seasonally frozen soil is higher during cold period than warm period, the residual soil moisture (θr) is the opposite. For permafrost, θs during cold period is higher than warm period, θr during cold period is lower than warm period in the deep layer only. 2) The soil water content of both seasonally frozen soil and permafrost shows a U-shaped change during freezing within the year, and the water storage of seasonally frozen soil decreases faster than permafrost during the rapid freezing period. 3) The bottom leakage flux of seasonally frozen soil and permafrost both decreases continuously during the stable frozen period, while the bottom leakage flux of permafrost decreases to 0 because of the baseplate of permafrost active layer, and remains unchanged. 4) The frozen peak point of both seasonally frozen soil and permafrost exists at 20 cm below soil surface. Soil water flows bilaterally to the frozen peak point during the rapid freezing period, and flows bilaterally out from the frozen peak point during the rapid thawing period. This study has important theoretical and practical value for understanding of the hydrological process of frozen soil more profoundly and optimizing the management of water resources in the source region of the Yellow River.
The calculation of the physical quantity of aquatic ecological products is the basis for the accounting and realization of the value of aquatic ecological products. In order to objectively reflect the relationship between the value of aquatic ecological products and water cycle processes, this study took the Huangshui River Basin in the upper reaches of the Yellow River as an example, and calculated the physical quantity and value of aquatic ecological products (water resources supply, water resources stock, soil conservation, flood regulation and storage, and water quality purification) in the basin from 1986 to 2015 by means of multi-process simulation of the water cycle in the basin, scenario analysis, and socio-economic condition investigation. The value composition and spatiotemporal distribution pattern of aquatic ecological products were systematically analyzed. The results show that the total value of aquatic ecological products in the Huangshui River Basin from 1986 to 1995 was 60.481 billion yuan/a, which increased by 10.87% and 24.49% in 1996-2005 and 2005-2015, respectively. The contribution of water resources storage was the highest (66.59%-69.53%), followed by reservoir flood control, water supply, and water purification (accounting for 18.91%-23.54%, 5.08%-5.53%, and 4.77%-6.12%, respectively), and the contribution of soil conservation was negligible (0.02%). The value of aquatic ecological products in sub-basins usually decreased from the upstream to the downstream, but the values of aquatic ecological products have increased significantly in sub-basins with water conservancy projects. This study provides a theoretical and technical support for the management of water ecosystems in the upper reaches of the Yellow River.
The water conservation zone of the Yellow River is a critical ecological function zone in China and further study is needed to maintain its ecosystem health and promote high-quality development. This study employed various analytical methods such as trend analysis, LOWESS (locally weighted scatterplot smoothing), Pearson and partial correlation analyses, and residual analysis, to investigate the spatiotemporal variation of vegetation and its driving factors in the Yellow River water conservation zone from 1982 to 2015. It also divided the conservation zone into plain and plateau regions based on topographical differences to examine the intra-regional disparities. The results reveal that: 1) The growing season normalized difference vegetation index (NDVI) in the conservation zone exhibited a significant growth trend, mainly driven by the rapid growth of NDVI in spring and autumn, with varying growth rates at different regional scales (0.0009/a for the whole area, 0.0007/a for the plateau area, and 0.0016/a for the plain area). 2) The correlation between regional NDVI and precipitation and temperature differed through time and across space. During the growing season, NDVI was negatively and positively correlated with precipitation and temperature, respectively. In spring and summer, temperature was the primary controlling factor, whereas in autumn, both precipitation and temperature were involved. Except for temperature in spring, the plain area was controlled by precipitation and temperature in other periods. The growing season NDVI of the conservation zone had a positive correlation with rainfall and temperature in 50.4% and 91.4% of cases, respectively. 3) The NDVI variation trend went through some stages—it stagnated in 1995-2015, during which the correlation between NDVI and rainfall shifted from negative to positive, but before 1995 and after 2015, NDVI increased significantly and had negative and positive correlations with rainfall and temperature, respectively. 4) Human activities and climate change jointly were the primary drivers of NDVI growth in the region, accounting for 74.30% of the total area. The second largest factor of vegetation growth was climate change, which accounted for 11.48% of the area, and vegetation decline caused by human activities accounted for 6.23% of the area. These findings suggest that ecological engineering construction effectively promoted vegetation recovery; however, human activities such as urbanization can also disrupt vegetation growth.
The widespread trend of suburbanization has resulted in the merging of residential and production elements in suburban areas, causing a significant increase in suburban lifestyles globally. The unique socio-economic and cultural settings of major economies like China and the United States exemplify the distinct features of suburban lifestyle development. An in-depth study of the evolutionary characteristics of suburban living spaces and lifestyles in the two countries benefits the dialogue between Chinese and Western suburban theories. A comparative study can offer valuable references for urban planning in China. This study examined the changes in how suburban living spaces are organized and how people live in them in China and the United States. It took a perspective of the daily lives of suburban residents to compare and analyze these developments. Based on the literature review, this study compared the residential, travel, and activity patterns of suburban residents in China and the United States, and examined how they relate to suburban space. It analyzed how residents' lifestyles have changed in suburban development in both countries and their impact on the suburban area. This article summarized the unique characteristics of suburban living in China and the United States, as well as the mechanisms behind them. Research has shown that both Chinese and American suburban lifestyles follow a three-stage development pattern, starting from monocentric urban lifestyles and eventually transitioning to suburban lifestyles. The suburban lifestyle in China started later, but it has experienced remarkable growth and evolution. The suburban lifestyle is now marked by a diversity of people, mixed residential areas, commuting towards the center, using public transportation, and relying on urban center for daily activities. Living in the suburbs has become a well-established and diverse way of life in the United States. It involves a mix of different populations, residential segregation, commuting inside suburban areas, using motorized mode of transportation for travel, and conducting daily activities in suburban areas. Residential diversification and motorized travel are common aspects of suburban lifestyle that China and the United States share. However, there is a difference in the level of residential integration, motorization, and suburbanization in daily activities between the two countries. Differences in suburban lifestyle between the two countries can be attributed to various factors, including the level of urbanization, transportation infrastructure, and disparities in spatial quality. These differences arise from a combination of choices made by individual residents and external limitations.
The relationship between population changes and land use changes is an important issue facing regional urban-rural development. The coordination of the urban-rural population-land relationship is an objective requirement for the development of urban-rural integration. Taking the Yangtze River Delta region as an example, this study used the spatial transition model of human settlements to analyze and compare the processes and characteristics of the population changes and land use changes in Shanghai Municipality and Jiangsu, Zhejiang, and Anhui provinces since 1997, as well as in the five levels of administrative units of city, county, town, township, and village in the region. The results have two aspects: 1) At the provincial level, the overall trend of Jiangsu, Zhejiang, and Anhui provinces is characterized by the complementary trends of urban expansion/sprawl and rural shrinkage/contraction. Compared with Shanghai and Zhejiang, the population and land changes in Jiangsu and Anhui provinces are more coordinated, and the intensity is weaker and more s
Scientifically exploring rural regional system resilience is of great significance for reconstructing rural development paths and rural revitalization. By examining the connotation of rural regional system resilience, this study constructed an evaluation indicator system of "factor support-structural resistance-functional adaptability", and explored the resilience characteristics. An integrated statistical analysis-mechanism identification method was used to identify resilience types. Then, the driving mechanism of resilience of the rural regional system was explored with the help of geographic detectors. The results show that: 1) The spatial differentiation of rural regional system resilience, factor support, structural resistance, and functional adaptability was obvious, and there was significant positive aggregation, among which the positive spatial aggregation of factor support force was the most significant. 2) According to the "statistical analysis-mechanism identification" resilience adaptive type identification method, there are 30 advantage-oriented administrative villages, accounting for 9.74% of the total; there are 67 stable and upgraded administrative villages, accounting for 21.86% of the total; there are 88 administrative villages with improvement type, accounting for 30.32% of the total; and there are 118 traditional control administrative villages, accounting for 38.08% of the total. 3) The level of rural regional system resilience in Suiyang District of Shangqiu City is the result of a combination of influencing factors, among which policy support, per capita income, and location advantage are the leading factors. Under the dual effects of external disturbances and internal drives, rural regional system resilience leads to the differentiation of rural development paths through policy regulation mechanism, endogenous dynamic mechanism, location advantage mechanism, and ecological constraint mechanism.
The land use function of rural tourism destinations is the foundation of the transformation and reconstruction of rural spatial functions. Exploring the spatial and temporal evolution characteristics of land use function types in rural tourism destinations and carrying out scenario simulation in different situations can provide a reference for analyzing the impact of tourism on rural tourism destinations. Taking Sanping Village, Jing'an County, Jiangxi Province as an example, this study analyzed the evolution of land use functional structure from 2007 to 2019 by using multi-source remote sensing images and ArcGIS spatial analysis tools, and simulated the land use functional structure under two future scenarios of "tourism priority development" and "protection-constrained development" by using the PLUS model. The results show that: 1) The land use function of Sanping Village was affected by the transformation of land use. From the traditional village with ecological conservation, agricultural production, rural housing, public services, and other functions, it was gradually transformed into a tourism village with tourism reception, tourism leisure, transportation, and other composite functions. From the initial participation period to the fast development period, the land use type index value increased by 13%, and the expansion intensity index value of tourism function land increased by 1.29 times. 2) With the advancement of tourism, the spatial diffusion and spillover characteristics of tourism function land in Sanping Village were obvious. In the natural germination period, the tourism function land was mainly distributed along the main road. But in the fast development period, the tourism function land began to extend to the natural village along the secondary roads. 3) In the future scenario simulation, compared with the protection-constrained development scenario, under the tourism priority development scenario the function of agricultural production and ecological conservation decreases more, but the tourism reception function will increase.
Quantitative study on the spatial effect of urban not in my backyard (NIMBY) facilities has great practical significance for urban land planning and spatial layout and living environment construction. Based on housing prices, this study constructed the Hedonic Price Model, and used the geographically weighted regression (GWR) and quantile regression models to study the spatial range and spatial heterogeneity of the influence of railway facilities on housing prices, and the difference of the impact on residential communities of different housing price ranges in central Changchun City. The study found that: 1) The railway facilities have a significant negative impact on the housing prices along the line, with the average spatial range affected being about 2 km, and the residential areas within this range account for 55.25% of the total in central Changchun City. For every 1 km decrease in distance from the nearest railway line, the housing price drops by about 114-772 yuan/m2. 2) There is a significant spatial heterogeneity in the impact of railways on housing prices. Due to the comprehensive effect of geographical distance, railway operation characteristics, and specific location conditions, there are obvious differences in the influence intensity of different railway lines, different sections along the same railway line, and different sides of the railway on housing prices. 3) The negative impact of railway facilities on the housing prices generally increases from low to high price residential areas, and the sensitivity of high price residential areas to railway NIMBY effect is obviously greater than that of medium and low price residential areas.
Improving the quality of urban public service provision and promoting a balanced and sufficient development of urban space is one of the critical urban governance issues in the process of China's modernization. However, the relationship between residential segregation and public service provision remains under-researched. Using Shanghai as a case, this study examined the spatial pattern of diversified urban public service provision at the scale of the smallest administrative unit and employed a causal-effect analytical method—generalized propensity-score matching—to identify the actual impact of residential segregation on the public service provision respectively delivered by the public sector and the private sector. The study revealed that the global and local spatial associations between residential segregation and public service provision in Shanghai displayed an inversely distributed pattern. Residential segregation at the neighborhood (residential committee) scale showed a negative effect on the public service provision both overall and by sectoral divisions. Such correlation showed a positive fluctuation in the middle of the residential segregation spectrum. The positive treatment effect of residential segregation on the public service provision from the private sector is relatively weak. Based on these findings, this study offered three policy recommendations: promoting a moderate level of homeownership mix, bridging the gap in public services in relatively segregated neighborhoods, and improving housing opportunities for marginalized groups.
The peaking time and peak Enhanced Vegetation Index (EVI) are important indicators of vegetation phenology and growth that play a decisive role in annual productivity. Using MODIS EVI (MOD13C1) data and a double logistic four-parameter model, we quantified the spatial and temporal variations of peaking time of vegetation growth and peak EVI, and their sensitivities to climate at the middle and high latitudes of the Northern Hemisphere during 2001-2020. The results show that: 1) During the 20 years, the peaking time of vegetation growth occurred between June and August. It first advanced and then delayed with the increase in latitude. Discounting land north of 70°N, the peaking time tended to advance with increasing latitude. Peak EVI ranged between 0.2 and 0.6, with higher EVI in high latitudes. 2) The spatially averaged peaking time of vegetation growth in the study area showed a nonsignificant advancing trend during the study period (0.12 d/a, p>0.05). The percentage of pixels showing advancing trend (60.3%) was larger than that with delaying trend (39.7%). Peak EVI showed a significant increasing trend, with an increase of 0.01/10 a (p<0.01). Spatially 74.5% of the study area showed an increasing trend in peak EVI. 3) During 2001-2020, the impacts of changing temperature, precipitation, and cloud cover in the spring and the summer were widespread. Temperature had the strongest effect on the peaking time and peak EVI of vegetation growth, with asymmetric effects at high latitudes. At low latitudes, a rise in temperature was likely to decrease peak EVI through events such as droughts. In contrast, the effects of precipitation and cloud cover on the peaking time and peak EVI of vegetation growth were relatively complex and spatially heterogeneous. The results of our study may provide data and information to elucidate the mechanisms that drive vegetation phenology and growth patterns and their responses to climate change at the middle and high latitudes of the Northern Hemisphere, and to predict the impacts on ecosystem changes.
As an important part of the East Asian aeolian sediment system, Harbin loess is of great significance for the study of climate change in Northeast China. Grain size end-member analysis is widely used in the study of loess sediments, which can effectively retrieve the mechanism of dust transport and paleoclimate change. In the existing studies, few have examined the transport power and environmental significance indicated by different size fractions in the loess deposit of Harbin. Based on a comprehensive comparison of Analysize, BasEMMA, and BEMMA end-member analysis methods, and combined with the particle size-standard deviation method, this study evaluated the applicability of different particle size end-member analysis methods in Harbin loess-paleosol, and clarified its environmental significance. The results show that the Analysize method has a good applicability in the end-member extraction of grain size of loess-paleosol in Harbin, while the performance of BasEMMA and BEMMA methods are relatively poor. Three effective grain size components were extracted from Harbin loess: EM1 (7.81 μm), which is the atmospheric background dust; EM2 (27.2 μm), which is the contribution of distant dust, representing the summer monsoon signal; and EM3 (54.41 μm), which is the near source input, indicating the winter monsoon intensity. Based on the analysis of marine isotope stages, mass accumulation rate (MAR), and 65 °N solar radiation, this study found that before 250 ka in Harbin, the winter wind was dominant and showed obvious glacial-interglacial cycle characteristics. The driving force of ice volume in high latitudes was the main factor leading to climate change in this period; After 250 ka, the climate in this area showed an overall trend of gradual warming and increasing humidity, and the loess grain size end members did not show obvious glacial-interglacial cycle characteristics. The main cause of this phenomenon was the increased solar radiation in the high latitudes of the northern hemisphere in the summer, which weakened the East Asian winter monsoon, and led to the decrease of dust contribution in the northwest provenance region and the contraction of the Songnen sandy land.
The urban life cycle theory was proposed by Hall and Van den Berg and colleagues based on European urban research. According to the changes in the population of the urban core and rings, the urban spatial evolution process is divided into four stages: Urbanization, suburbanization, deurbanization, and reurbanization. The stage alternation and specific stages described by the theory have also been confirmed by subsequent empirical research, and this theory has been widely applied in identifying and studying the stages of urban development. However, this theory has been criticized and questioned as follows: 1) The process of urban development cannot be measured solely from a single population change perspective; 2) There are heterogeneities in urban development under different backgrounds; 3) The division of stages is unreasonable and debatable; and 4) Urban space does not always evolve linearly in a unidirectional order. In this context, many studies have made revisions, supplements, and improvements to this theory, and some new theories have been proposed, but there is still room for breakthroughs and development. Future breakthroughs can be made in the following aspects: 1) Incorporate marginal cities, shrinking cities, gentrification, and new urban phenomena into research of the post crisis and post pandemic period, and consider changes in people's lifestyle and thinking, socioeconomic background, and so on, to expand the applicability of the theory; 2) Refine urban types to identify the diversity of evolution, and conduct comparative research to identify urban life cycle models that are suitable for China; 3) Incorporate population structure and integrate the data of population size, age, and household and socioeconomic characteristics to enhance the depth of urban spatial analysis; and 4) Increase research on the migration of residents and businesses, expand micro-scale perspectives, and integrate multiple urban systems to enhance the comprehensiveness of urban spatial evolution theory.
This study reviewed the research progress of Chinese agricultural geography, and examined the change of themes of agricultural studies in China. This article discussed the development characteristics of agricultural geography in different time periods, and summarized the experience and achievements, which has theoretical and practical values for promoting the development of agricultural geography and meet the needs of agricultural production and rural development in China. The study used literature review and comparative analysis to analyze the characteristics of Chinese agricultural geography research in different periods. The results show that: 1) From the perspective of research process, agricultural geography research can be divided into four stages—historical description period, agricultural collectivization period, reform and development period, and modern revolution period. 2) Modern agricultural geography in China, mainly involves four research fields—sustainable utilization of agricultural resources, sustainable development of regional agriculture, adjustment and transformation of agricultural structure, and comprehensive study of agricultural and rural geography. 3) Future agricultural geography research will focus on themes around climate change, urban and rural integration, adaptive resilience, and digital technologies and apply them to the practices of development of decision -making.