
Characteristics of e-shopping behavior of Nanjing residents:A case of books and clothes
Online published: 2016-04-27
Supported by
National Natural Science Foundation of China, No.41571146
Copyright
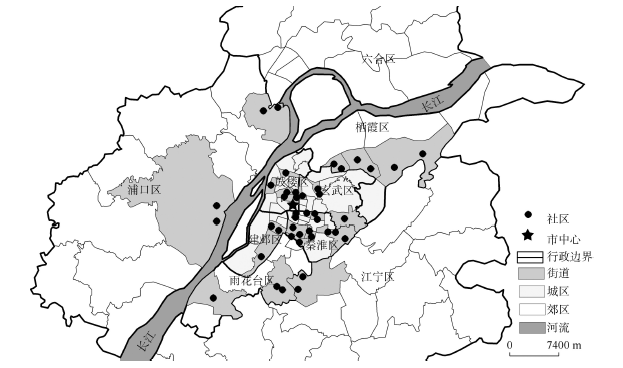
With the rapid development of information and communication technology (ICT), e-shopping has increasingly become a significant part of today’s social and economic life, deeply influencing residents’ shopping behavior and the development of traditional retail trade. Residents’ shopping behavior differs in different countries, among different groups of people, and with different types of goods. This article analyzes the characteristics of e-shopping behavior of Nanjing residents and compares residents’ e-shopping behavior by distinguishing product types based on a sample survey. The survey was conducted in Nanjing City from April to June 2015 by a research group at Nanjing University, which resulted in 963 valid samples that were later applied for analysis of variance. The study result has important implications for understanding the interactions between e-shopping and in-store shopping, as well as the influence of online shopping on transportation and urban retail space. By comparing two types of products—books and clothes, the article summarizes the general characteristics of Nanjing residents’ e-shopping behavior based on shopping frequency, distance of shopping trips, and shopping attitudes. The result of one-way ANOVA shows that residents’ e-shopping behavior is a complicated process. Considering the two types of products, residents with different e-shopping frequencies clearly differ in socioeconomic attributes, spatial locations, Internet use and shopping habits, and shopping attitudes. Residents with different frequencies of shopping clothes online have significantly more dissimilarities, which means experience goods response more strongly to the new shopping mode. Specifically, people with a high frequency of shopping books online are often older (with an average age of about 33), have higher level of education and household monthly income, are more likely to use online search to get product information and less sensitive to prices. People with a high frequency of shopping clothes online are often younger (with an average age of about 30.4), have higher level of education and household monthly income, and low shopping accessibility in place of residence with an average trip distance of 20 minutes, more likely have rich experiences in using the Internet and conduct unexpected consumption, value the recreational function of shopping, and pursue fashion. The results of this study may provide some references and basic data for dissecting the relationships between online shopping and in-store shopping from a geographic perspective and examining trends of retail sales in the city.
ZHANG Yuqing , ZHEN Feng , ZHANG Yongming . Characteristics of e-shopping behavior of Nanjing residents:A case of books and clothes[J]. PROGRESS IN GEOGRAPHY, 2016 , 35(4) : 476 -486 . DOI: 10.18306/dlkxjz.2016.04.008
Fig.1 Distribution of surveyed residential areas图1 被调研小区分布示意图 |
Tab.1 Basic social and economic statistics of the respondents表1 被调查样本基本情况统计表 |
| 样本属性 | 样本量 | 比例/% | |
|---|---|---|---|
| 性别 | 男 | 404 | 42.1 |
| 女 | 555 | 57.9 | |
| 年龄 | 18~24岁 | 173 | 18.7 |
| 25~34岁 | 473 | 51.2 | |
| 35~44岁 | 199 | 21.6 | |
| 45岁以上 | 78 | 8.5 | |
| 学历 | 小学及以下 | 5 | 0.5 |
| 初中 | 43 | 4.5 | |
| 高中/中专 | 104 | 10.8 | |
| 大专 | 226 | 23.5 | |
| 本科 | 448 | 46.6 | |
| 研究生及以上 | 135 | 14.1 | |
| 就业状态 | 全职工作 | 823 | 86.7 |
| 全日制在校学生 | 108 | 11.4 | |
| 在职学生 | 18 | 1.9 | |
| 家庭平均 月收入 | <1000元 | 4 | 0.4 |
| 1000~1999元 | 27 | 2.8 | |
| 2000~2999元 | 75 | 7.9 | |
| 3000~4999元 | 204 | 21.5 | |
| 5000~6999元 | 206 | 21.8 | |
| 7000~9999元 | 168 | 17.7 | |
| 10000~14999元 | 135 | 14.2 | |
| 15000~19999元 | 68 | 7.2 | |
| >20000元 | 62 | 6.5 | |
| 居住地 | 市区 | 534 | 55.5 |
| 郊区 | 429 | 44.5 |
Tab.2 Frequencies of purchasing clothes and books online and offline表2 不同类型商品网络和实体商店购买频率占比 |
| 购买频率 | 商品类型 | |||
|---|---|---|---|---|
| 衣服 | 书籍 | |||
| 网络购买/% | 实体店购买/% | 网络购买/% | 实体店购买/% | |
| 很少 | 26.1 | 29.0 | 55.5 | 70.8 |
| 两个月一次 | 19.1 | 25.6 | 22.0 | 14.9 |
| 一个月一次或两次 | 33.8 | 23.7 | 18.7 | 10.7 |
| 一个月三次或更多 | 21.0 | 21.7 | 3.8 | 3.6 |
| 总计 | 100.0 | 100.0 | 100.0 | 100.0 |
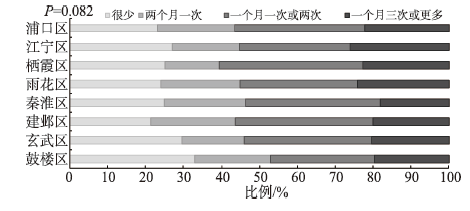
Fig.2 Frequencies of purchasing clothes online in different residential areas图2 不同居住区位居民网购衣服频率占比 |
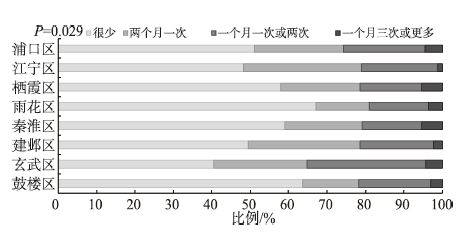
Fig.3 Frequencies of purchasing books online different residential areas图3 不同居住区位居民网购书籍频率占比 |
Tab.3 Travel modes of purchasing clothes and books表3 不同类型商品购物出行交通方式占比 |
| 购物出行最常采用的交通方式 | 商品类型 | |
|---|---|---|
| 衣服/% | 书籍/% | |
| 步行 | 14.0 | 14.6 |
| 电动自行车或助力车 | 13.0 | 13.7 |
| 公交(包括巴士、地铁、轻轨等) | 49.7 | 52.8 |
| 自行车 | 1.3 | 1.9 |
| 出租车 | 3.1 | 2.6 |
| 私家汽车或摩托车 | 18.9 | 14.4 |
| 合计 | 100.0 | 100.0 |
Tab.4 Travel distances of purchasing clothes and books表4 不同类型商品购物出行的距离占比 |
| 购物出行的距离/min | 商品类型 | |
|---|---|---|
| 衣服/% | 书籍/% | |
| <5 | 3.4 | 5.5 |
| 6~10 | 18.1 | 15.4 |
| 11~20 | 27.2 | 23.0 |
| 21~30 | 27.4 | 25.1 |
| 31~40 | 13.9 | 16.5 |
| 41~50 | 5.0 | 5.5 |
| 51~60 | 2.7 | 3.3 |
| >60 | 2.3 | 5.7 |
| 合计 | 100.0 | 100.0 |
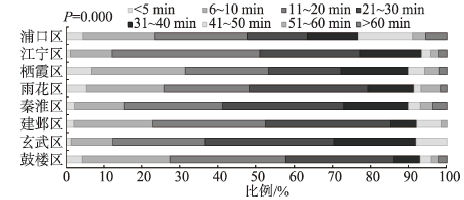
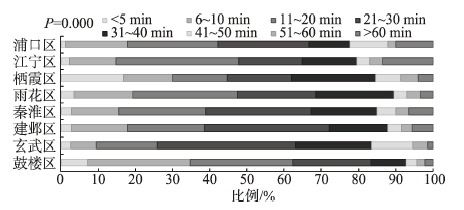
Fig.4 Travel distances of purchasing clothes in different residential areas图4 不同居住区位居民购买衣服出行距离 |
Fig.5 Travel distances of purchasing books in different residential areas图5 不同居住区位居民购买书籍出行距离 |
Tab.5 Factor loading matrix of shopping attitudes表5 购物态度因子载荷矩阵 |
| 购物态度 | 求新 | 购物享受 | 成本节约 | 冲动消费 | 时间节约 |
|---|---|---|---|---|---|
| 我喜欢购买新颖的产品 | 0.725 | ||||
| 买东西时我喜欢追随潮流 | 0.654 | ||||
| 向别人展示我与众不同很重要 | 0.625 | ||||
| 我喜欢了解新颖的产品 | 0.599 | ||||
| 购物通常是一件很无聊的事 | -0.786 | ||||
| 购物是有趣的 | 0.421 | 0.583 | |||
| 我在买东西时通常很匆忙 | -0.540 | ||||
| 购物可以帮助我放松 | 0.470 | ||||
| 我在购买之前通常会比较价格 | 0.760 | ||||
| 购买新颖的产品时,我通常很谨慎 | 0.707 | ||||
| 买东西时获得最低的价格很重要 | 0.575 | ||||
| 我买东西时通常不在意商品的价格 | -0.439 | -0.394 | |||
| 我买东西的时候通常是没有计划的 | 0.804 | ||||
| 我经常会买购物计划外的东西 | 0.668 | ||||
| 我通常会有并坚持我的购物计划 | 0.669 | -0.492 | |||
| 我有足够的时间去购物 | -0.834 | ||||
| 我常常太忙而没有时间去购物 | 0.731 |
Tab.6 Analysis result of one-way ANOVA表6 方差分析结果 |
| 变量 | One-way ANOWA | ||||
|---|---|---|---|---|---|
| 书籍 | 衣服 | ||||
| F值 | P值 | F值 | P值 | ||
| 社会经济属性 | 年龄 | 4.862 | 0.002* | 3.375 | 0.018* |
| 学历 | 12.072 | 0.000* | 4.582 | 0.003* | |
| 家庭平均月收入 | 10.836 | 0.000* | 5.738 | 0.001* | |
| 空间特征 | 购物可达性 | 0.260 | 0.855 | 4.342 | 0.005* |
| 网络使用及 购物习惯 | 使用互联网时间 | 7.113 | 0.000* | 10.313 | 0.000* |
| 上网频率 | 1.733 | 0.159 | 10.606 | 0.000* | |
| 网络搜索使用频率 | 13.434 | 0.000* | 30.280 | 0.000* | |
| 购物态度 | 冲动消费心理 | 3.690 | 0.012* | 9.293 | 0.000* |
| 购物享受心理 | 1.763 | 0.153 | 7.638 | 0.000* | |
| 时间节约心理 | 0.375 | 0.771 | 1.497 | 0.214 | |
| 成本节约心理 | 6.112 | 0.000* | 1.153 | 0.327 | |
| 求新心理 | 2.183 | 0.088 | 6.379 | 0.000* | |
Tab.7 Result of Bonferroni test to the frequencies of purchasing books online表7 书籍网购频率事后检验结果 |
| 变量 | 书籍网上购物频率 | ||||
|---|---|---|---|---|---|
| 很少 | 两个月一次 | 一个月一次或两次 | 一个月三次或更多 | ||
| 社会经济 属性 | 年龄 | -0.2503[一个月一次或两次] | -0.2452[一个月一次或两次] | 0.2503[很少] 0.2452[两个月一次] | |
| 学历 | -0.4077[两个月一次] -0.3944[一个月一次或两次] | 0.4077[很少] | 0.3944[很少] | ||
| 家庭平均 月收入 | -0.7310[一个月一次或两次] -1.0545[一个月三次或更多] | 0.7310[很少] | 1.0545 [很少] | ||
| 网络使用及 购物习惯 | 使用互联 网时间 | -0.2764[两个月一次] -0.2517[一个月一次或两次] | 0.2764[很少] | 0.2517[很少] | |
| 网络搜索 使用频率 | -0.5213[两个月一次] -0.6155[一个月一次或两次] -0.6527[一个月三次或更多] | 0.5213[很少] | 0.6155[很少] | 0.6527 [很少] | |
| 购物 态度 | 冲动消费 心理 | 0.2488[两个月一次] | -0.2488[很少] -0.2694[一个月一次或两次] | 0.2694[两个月一次] | |
| 成本节约 心理 | 0.2509[一个月一次或两次] | 0.4320[一个月一次或两次] | -0.2509[很少] -0.4320[两个月一次] | ||
注:括号中的为和该类别有显著差异的类别,表中数值为均值差,显著性水平为0.05。 |
Tab.8 Result of Bonferroni test to the frequencies of purchasing clothes online表8 衣服网购频率事后检验结果 |
| 变量 | 衣服网上购物频率 | ||||
|---|---|---|---|---|---|
| 很少 | 两个月一次 | 一个月一次或两次 | 一个月三次或更多 | ||
| 社会经济属性 | 年龄 | 0.2468[两个月一次] | -0.2468[很少] | ||
| 学历 | -0.2986[一个月一次或两次] -0.2824[一个月三次或更多] | 0.2986[很少] | 0.2824[很少] | ||
| 家庭平均月收入 | -0.3951[一个月一次或两次] -0.6749[一个月三次或更多] | 0.3951[很少] | 0.6749[很少] | ||
| 空间特征 | 购物可达性 | 0.3813[一个月一次或两次] | -0.3813[两个月一次] | ||
| 网络使用及购物习惯 | 使用互联网 时间 | -0.2750[两个月一次] -0.2400[一个月一次或两次] -0.4608[一个月三次或更多] | 0.2750[很少] | 0.2400[很少] -0.2208[一个月三次或更多] | 0.4608[很少] 0.2208[一个月一次或两次] |
| 上网频率 | -0.3052[一个月一次或两次] -0.5145[一个月三次或更多] | -0.2714[一个月三次或更多] | 0.3052[很少] | 0.5145[很少] 0.2714[两个月一次] | |
| 网络搜索使用频率 | -0.6197[两个月一次] -0.6936[一个月一次或两次] -1.2096[一个月三次或更多] | 0.6197[很少] -0.5899[一个月三次或更多] | 0.6936[很少] -0.5160[一个月三次或更多] | 1.2096[很少] 0.5899[两个月一次] 0.5160[一个月一次或两次] | |
| 购物 态度 | 冲动消费心理 | -0.4439[一个月三次或更多] | -0.4421[一个月三次或更多] | -0.2858[一个月三次或更多] | 0.4439[很少] 0.4421[两个月一次] 0.2858[一个月一次或两次] |
| 购物享受心理 | -0.4316[一个月三次或更多] | 0.3473[一个月三次或更多] | -0.2519[一个月三次或更多] | 0.4316[很少] 0.3473[两个月一次] 0.2519[一个月一次或两次] | |
| 求新心理 | -0.2524[一个月一次或两次] -0.3979[一个月三次或更多] | 0.2524[很少] | 0.3979[很少] | ||
注:括号中的是和该类别有显著差异的类别,表中数值为均值差,显著性水平为0。 |
The authors have declared that no competing interests exist.
| [1] |
[
|
| [2] |
[
|
| [3] |
[
|
| [4] |
[
|
| [5] |
[
|
| [6] |
[
|
| [7] |
[
|
| [8] |
[
|
| [9] |
[
|
| [10] |
[
|
| [11] |
[
|
| [12] |
[
|
| [13] |
|
| [14] |
|
| [15] |
|
| [16] |
|
| [17] |
|
| [18] |
|
| [19] |
|
| [20] |
|
| [21] |
|
| [22] |
|
| [23] |
|
| [24] |
|
| [25] |
|
| [26] |
|
| [27] |
|
| [28] |
|
| [29] |
|
| [30] |
|
| [31] |
|
| [32] |
|
/
| 〈 |
|
〉 |