刘翀 , 朱立平, 王君波
LIU Chong, ZHU Liping, WANG Junbo
通讯作者:
收稿日期: 2017-04-20
网络出版日期: 2017-05-20
版权声明: 2017 地理科学进展 《地理科学进展》杂志 版权所有
基金资助:
作者简介:
作者简介:刘翀(1992-),男,江西南昌人,硕士研究生,研究方向为湖泊环境遥感应用,E-mail:liuchong@itpcas.ac.cn。
展开
摘要
湖泊透明度是湖泊水体性质的一个重要参数,是湖泊浮游生物和进入湖泊的有机和无机颗粒溶解程度的综合反映,对湖泊生态环境研究具有重要的科学及实践意义。遥感影像是获取面积广、时间长的湖泊透明度的重要手段,但由于实测数据缺乏,目前对青藏高原地区湖泊透明度的遥感反演研究相对不足。本文基于青藏高原地区24个湖泊实测透明度SD(Secchi Depth)值和相应的MODIS遥感影像,建立了该地区湖泊水体透明度SD值MODIS遥感反演模型。结果表明:基于MODIS绿色波段B4的单波段幂函数模型在该地区反演效果最好,精度较高(R²=0.91, N=24),并具有较好的稳定性。以当惹雍错为例,选用该模型反演得到湖泊透明度的时间变化序列,发现该湖存在明显的季节波动和较为明显的年际变化。初步分析得出,降水/融水季节的湖泊透明度与湖泊所在流域的降水率具有密切的关系。本文结果表明,利用遥感手段能够有效地开展青藏高原地区湖泊透明度的反演,可为进一步深入研究该地区湖泊透明度及其影响要素奠定基础。
关键词:
Abstract
:Lake water clarity is an important parameter of lake water property, which is an integrated response of lake plankton and organic and inorganic solutions, and has significant scientific and practical implications for lake ecological condition research. Remote sensing is a key method for obtaining lake clarity in wide areas and within long time spans. On the Tibetan Plateau, there are more than 389 lakes with area greater than 10 km2, making the Plateau an ideal region for environmental and climate change research. However, study on the estimation of lake water clarity on the Tibetan Plateau by satellite data is insufficient at present due to the paucity of in situ lake water clarity measurement data. In this study, retrieval models of lake water clarity were established based on the in situ water clarity measurements of 24 lakes distributed in different areas on the Tibetan Plateau and the corresponding MODIS imageries. Statistical methods including linear, exponential, power function, and logarithm regressions were used to build relationships between lake water clarity and the reflectance of MODIS bands on the Tibetan Plateau. The results show that power function model with MODIS green band B4 as single independent variable is the best model for estimating lake water clarity (SD value) on the Plateau (R²=0.91, N=24). The stability of the model was also tested based on 10 in situ SD data at different times in a single lake. Based on this model, we analyzed the temporal variation of lake water clarity of a typical lake Tangra Yumco as an example. The result demonstrates clear seasonal and inter-annual variations of lake water clarity for this lake. Preliminary analysis indicates that the variation of water clarity in precipitation-meltwater rich season is correlated with precipitation intensity of the basin. Our work proved that the reflectance of remote sensing imageries is valid for estimating lake water clarity on the Tibetan Plateau. This may promote further investigation of lake water clarity and its influencing factors on the Tibetan Plateau.
Keywords:
青藏高原以其独特的环境特征及对气候变化的敏感响应与反馈,成为气候与环境变化研究的热点区域(姚檀栋, 2014)。其多样的地表覆被,如冰川(Yang et al, 2003)、积雪(Qin et al, 2006)、林线(Liang et al, 2016)、草地(Shen et al, 2016)等的变化特征,敏感地反映了该地区气候与环境变化信息。青藏高原分布着世界最大的高原湖泊群,湖泊是地表下垫面的重要类型。已有研究表明,青藏高原湖泊面积(鲁安新等, 2005; Zhu et al, 2010)、水量(Song et al, 2013; Zhang et al, 2013; Yang et al, 2017)、温度(Zhang et al, 2014a)以及冰情(勾鹏等, 2015; Yao et al, 2016)等特征,对区域气候与环境变化响应显著。
湖泊水体透明度是湖泊重要的物理参数之一,其变化主要受湖水中光学组分的影响,包括浮游生物、悬浮颗粒物、有色可溶性有机物(CDOM)以及纯水本身等(Mancino et al, 2009)。气候变化和人类活动能影响湖泊浮游生物的生存条件,以及进入湖泊的有机和无机颗粒的溶解程度,从而对湖水透明度产生影响。尽管从20世纪70年代起进行的青藏高原考察就已关注一些湖泊的水体透明度问题,但对整个青藏高原地区湖泊水体透明度的研究却依然极为缺乏。卫星遥感数据是对大范围多时期地表参数反演的有力手段。利用卫星遥感数据对湖泊水体透明度进行研究,目前已在国内外不同地区广泛开展,并取得较好的效果(Kloiber et al, 2002; Olmanson et al, 2008; Wu et al, 2008; Duan et al, 2009; Zhao et al, 2011; Knight et al, 2012; Fukushima et al, 2016; 马建行等, 2016)。借助遥感手段研究湖泊水体透明度的核心在于准确建立湖泊水体透明度与遥感参数之间的反演关系。但在青藏高原地区,受恶劣自然环境的影响,对大范围湖泊透明度的实地测量极为困难,从而制约了该项研究的深入开展。尽管影响湖泊水体透明度的因素相对简单,但其物理机制较为复杂(Gitelson et al, 2000)。从遥感反演的角度,目前的研究多运用不同的统计模型尝试建立遥感参数与水体透明度之间的反演关系,并选择最优反演模型来研究湖泊水体透明度。然而,由于纯粹基于统计方法的反演无法直接体现模型的物理意义,而不同地区影响湖泊水体透明度的因素存在一定差异,致使不同地区水体透明度反演模型具有不同的应用范围,尤其若将某一地区的反演模型(即使精度很高)直接运用到另一地区,其反演效果亦存在很大的不确定性(Fukushima et al, 2016)。因此,对于工作基础薄弱的青藏高原地区而言,必须通过在该地区开展大量的实测湖泊水体透明度数据的调查,才能准确地进行湖泊水体透明度的遥感反演。
本文在获取青藏高原地区24个湖泊实测透明度SD数据及另外10个用于验证模型的SD数据的基础上,借助MODIS遥感数据,运用不同的统计方法,建立了该地区湖泊水体透明度与卫星遥感数据之间的反演关系。在此基础上,以当惹雍错为例,反演得到湖泊透明度时间变化序列,并分析其基本特征和影响因素,可为深入研究青藏高原地区湖泊水体透明度遥感反演及其与环境之间关系奠定基础。
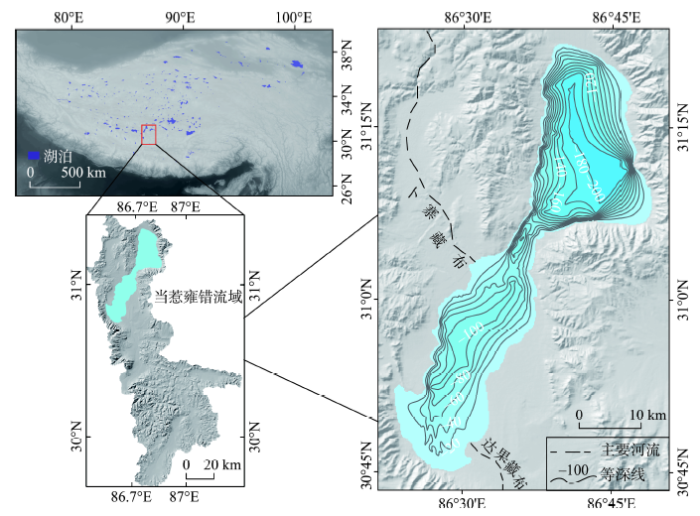
青藏高原是地球上面积最大、海拔最高的高原,其平均海拔超过4000 m。该地区自然环境恶劣,人类活动稀少。相关研究显示,2010年青藏高原湖区湖泊总面积为47366 km2(Zhang et al, 2014b);2005-2006年的研究数据表明,该地区湖泊占中国湖泊总面积的51.4%,其中面积大于10 km2的就有389个,面积约39603.7 km2 (Ma et al, 2011)。根据含盐量的不同,该地区分布有淡水湖、咸水湖以及盐湖等不同类型的湖泊,是地球上湖泊分布密集、湖泊类型多样的区域之一。本文采集的透明度数据包括纳木错、色林错等大湖在内的24个湖泊,这些湖泊广泛分布于高原不同区域(图1)。
图1 湖泊水体透明度实地采样点分布①纳木错②塔若错③班公错④结则茶卡⑤阿翁错⑥别若则错⑦达热布错⑧拉果错⑨洞错⑩达瓦错攸布错昂古错张乃错恰规错错鄂巴木错达则错色林错龙木错邦达错阿克赛钦湖多尔索洞措赤布张错多格错仁
Fig.1 Location of lakes with water clarity measurement in this study
对湖泊水体透明度的实地测量方法为塞氏盘深度测量法。测量时,将塞氏盘水平放入待测水体中,直至其到达“可见”与“不可见”的深度临界值,该深度临界值即为测量点的塞氏盘深度(Secchi Depth, SD)。这一参数已被广泛应用于湖泊环境的研究(Fee et al, 1996; Lathrop et al, 1996; 张运林等, 2003;Barbiero et al, 2004; Holeck et al, 2008; 潘继征等, 2008; 张晓晶等, 2009; Rose et al, 2017)。本文使用20 cm黑白塞氏盘进行测量,获得24个湖泊的透明度SD值(表1)。此外,我们还在纳木错获取了不同时间段共10个透明度SD值,作为验证数据,以检验模型的稳定性。
表1 文中获取的湖泊透明度SD值及对应遥感影像信息
Tab.1 In situ measured Secchi Depth (SD) data and information of corresponding satellite imagery
| 序号 | 湖泊名称 | 采样坐标 | MODIS 影像文件名 | SD/m | 采样日期 | 影像日期 | 日期偏差/d | |
|---|---|---|---|---|---|---|---|---|
| 1 | 纳木错 | 90.7456°E | 30.7338°N | MOD021KM.A2016323.0500.006.2016333195247 | 8.0 | 2016.11.19 | 2016.11.19 | 0 |
| 2 | 塔若错 | 84.1366°E | 31.1403°N | MOD021KM.A2014249.0525.006.2014249130649 | 6.2 | 2014.9.06 | 2014.9.6 | 0 |
| 3 | 班公错 | 79.8094°E | 33.5509°N | MOD021KM.A2012209.0455.006.2014224155957 | 14.0 | 2012.7.28 | 2012.7.29 | 1 |
| 4 | 结则茶卡 | 80.8814°E | 33.9417°N | MOD021KM.A2012212.0525.006.2014224201213 | 3.0 | 2012.7.31 | 2012.7.30 | 1 |
| 5 | 阿翁错 | 81.7586°E | 32.7531°N | MOD021KM.A2012216.0500.006.2014225101108 | 3.0 | 2012.8.5 | 2012.8.3 | 2 |
| 6 | 别若则错 | 82.9585°E | 32.4378°N | MOD021KM.A2012216.0500.006.2014225101108 | 0.5 | 2012.8.6 | 2012.8.3 | 3 |
| 7 | 达热布错 | 83.2328°E | 32.4829°N | MOD021KM.A2012216.0500.006.2014225101108 | 3.2 | 2012.8.6 | 2012.8.3 | 3 |
| 8 | 拉果错 | 84.1647°E | 32.0269°N | MOD021KM.A2012223.0510.006.2014224150200 | 5.0 | 2012.8.8 | 2012.8.10 | 2 |
| 9 | 洞错 | 84.7651°E | 32.1623°N | MOD021KM.A2012223.0510.006.2014224150200 | 0.8 | 2012.8.8 | 2012.8.10 | 2 |
| 10 | 达瓦错 | 84.9422°E | 31.2233°N | MOD021KM.A2012223.0510.006.2014224150200 | 1.0 | 2012.8.11 | 2012.8.10 | 1 |
| 11 | 攸布错 | 84.8241°E | 30.7900°N | MOD021KM.A2012223.0510.006.2014224150200 | 12.5 | 2012.8.12 | 2012.8.10 | 1 |
| 12 | 昂古错 | 85.4441°E | 31.2053°N | MOD021KM.A2012223.0510.006.2014224150200 | 3.5 | 2012.8.13 | 2012.8.10 | 3 |
| 13 | 张乃错 | 87.4118°E | 31.5508°N | MOD021KM.A2012229.0430.006.2014220065835 | 3.0 | 2012.8.17 | 2012.8.16 | 1 |
| 14 | 恰规错 | 88.2445°E | 31.8489°N | MYD021KM.A2012232.0640.006.2012232192302 | 5.0 | 2012.8.19 | 2012.8.19 | 0 |
| 15 | 错鄂 | 88.7061°E | 31.6598°N | MYD021KM.A2012232.0640.006.2012232192302 | 8.0 | 2012.8.20 | 2012.8.19 | 1 |
| 16 | 巴木错 | 90.6184°E | 31.2639°N | MOD021KM.A2012238.0425.006.2014220060635 | 3.2 | 2012.8.21 | 2012.8.25 | 4 |
| 17 | 达则错 | 87.5503°E | 31.8538°N | MOD021KM.A2012228.0525.006.2014220103327 | 6.0 | 2012.8.18 | 2012.8.15 | 3 |
| 18 | 色林错 | 88.8889°E | 31.8190°N | MYD021KM.A2014218.0745.006.2014220180109 | 3.2 | 2014.8.7 | 2014.8.6 | 1 |
| 19 | 龙木错 | 80.4734°E | 34.6240°N | MOD021KM.A2015253.0610.006.2015253195641 | 2.5 | 2015.9.10 | 2015.9.10 | 0 |
| 20 | 邦达错 | 81.5300°E | 34.9575°N | MOD021KM.A2015248.0550.006.2015248134032 | 1.3 | 2015.9.5 | 2015.9.5 | 0 |
| 21 | 阿克赛钦湖 | 79.7935°E | 35.2456°N | MOD021KM.A2015259.0535.006.2015259134615 | 1.0 | 2015.9.17 | 2015.9.17 | 0 |
| 22 | 多尔索洞措 | 89.8341°E | 33.3490°N | MOD021KM.A2016298.0510.006.2016298133407 | 7.5 | 2016.10.24 | 2016.10.24 | 0 |
| 23 | 赤布张错 | 90.2322°E | 33.3813°N | MOD021KM.A2016305.0515.006.2016305133931 | 5.0 | 2016.10.31 | 2016.10.31 | 0 |
| 24 | 多格错仁 | 88.9916°E | 34.5537°N | MOD021KM.A2016311.0435.006.2016311134330 | 2.0 | 2016.11.6 | 2016.11.6 | 0 |
本文使用的遥感数据为MODIS(Moderate Resolution Imaging Spectroradiometer) L1B数据和基于L1B的8天合成产品MOD09数据。其中模型的建立基于L1B数据,当惹雍错透明度时间变化特征反演则基于MOD09数据。对于L1B数据,本文使用的波段包括可见光—近红外波段范围内的B1-B4、B8-B16。B8-B16波段设计之初的用途即为海洋水色研究,其空间分辨率为1 km,具有良好的光谱分辨率与信噪比(表2),故本文认为其非常适合水体清洁度很高的青藏高原地区湖泊研究。其中,B13和B14波段根据信号增益不同分为B13lo/B13hi和B14lo/B14hi,本文统一使用B13lo和B14lo。B1-B4波段中包含经重采样得到的红色波段B1、蓝色波段B3、绿色波段B4,短波近红外波段B2,尽管这几个波段信噪比相对较低,但重采样之前具有更高的空间分辨率(500 m和250 m)。为提高研究的光谱分辨率,对比验证具有空间分辨率优势的这几个波段在青藏高原地区的应用效果,同时还使用B1-B4波段的数据。因此,本文使用的MODIS L1B数据共计13个波段。这些遥感影像由分别搭载在Aqua、Terra卫星上的2个传感器获得。其中,遥感影像日期的选择原则为:选择最邻近透明度实地采样日期的无云遥感影像。对于本文涉及的MODIS L1B遥感数据,其与实地透明度测量日期偏差大部分为0~1天,最大偏差为4天(表1)。本文所使用数据从LAADS DAAC(https://ladsweb.nascom.nasa.gov/data/search.html)获取。
表2 文中使用MODIS 各波段基本信息
Tab.2 Basic information of MODIS bands used in this study
| 波段名称 | 波段宽度/nm | 信噪比/NE△t | 空间分辨率 |
|---|---|---|---|
| B8 | 405~420 | 880 | 1 km |
| B9 | 438~448 | 838 | 1 km |
| B3 | 459~479 | 243 | 500 m合成为1 km |
| B10 | 483~493 | 802 | 1 km |
| B11 | 526~536 | 754 | 1 km |
| B12 | 546~556 | 750 | 1 km |
| B4 | 545~565 | 228 | 500 m合成为1 km |
| B1 | 620~670 | 128 | 500 m合成为1 km |
| B13 | 662~672 | 910 | 1 km |
| B14 | 673~683 | 1087 | 1 km |
| B15 | 743~753 | 586 | 1 km |
| B2 | 841~876 | 201 | 250 m合成为1 km |
| B16 | 862~877 | 516 | 1 km |
对MODIS L1B和MOD09数据的处理主要包括几何校正、大气校正(其中MOD09数据为已进行标准大气校正的产品)、反射率提取。本文中,遥感影像的几何校正处理基于MODIS 自带的地理坐标数据,经过geographic lat/lon投影转换,在ENVI 5.2环境中实现。利用遥感影像提取的水色信号分异精度与大气校正密切相关(Olmanson et al, 2011),最理想的方式是同步实测大气参数,借助相关大气校正模型对遥感影像进行大气校正处理。尽管由于内陆水体大气校正的复杂性,目前尚不存在任何一种适用于所有内陆水体的大气校正标准方法(Malthus et al, 2012),但由于获取实测大气参数难度较大,现已发展了很多只需输入少量可估算参数的标准大气校正模型,其良好效果已得到广泛验证(马荣华等, 2009)。本文中L1B数据使用基于MODTRAN 大气校正模型的FLAASH大气校正模块,在ENVI 5.2环境下输入相关大气校正参数,实现对遥感影像的大气校正。遥感影像的反射率提取,选择透明度采样点位坐标所在像元进行数据的导出,以得到与实测透明度数据对应的湖泊水面反射率数据。
本文使用的温度、降水数据,基于中国区域高时空分辨率地面气象要素驱动数据集获取(http://westdc.westgis.ac.cn/data/7a35329c-c53f-4267-aa07-e0037d913a21,数据同化方法见何杰等, 2011)。其中温度为瞬时近地面(2 m)气温(K),降水率(mm/hr)根据3小时平均降水率计算得到。
基于统计学的多个自变量对单个因变量反演的方法,主要包括涉及单个自变量的线性、非线性回归,多个自变量的多元回归,多个自变量的主成分回归(以消除多个自变量之间共线性),以及在各自变量的数据转换(对数转换、倒数转换、指数转换、幂转换等)之后的各种分析。已有的研究(表3)表明,利用遥感数据对湖泊水体透明度SD值的反演方法中,效果较好的主要包括以单波段作为自变量的线性、非线性回归模型,以波段比值作为自变量的一元、多元回归模型,以及多元逐步回归或主成分回归模型。因此,本文将依次尝试利用上述几种主要方法,选择效果最优方法,建立青藏高原地区湖泊水体透明度SD深度与MODIS遥感数据之间的反演模型。
表3 其他地区湖泊SD值遥感反演拟合形式总结
Tab.3 Fitting formulas between lake SD and remote sensing parameters in other studies
| 研究地区 | 反演方法 | 最优拟合形式 | R² | N | 传感器 | 参考文献 |
|---|---|---|---|---|---|---|
| 美国明尼苏达州、威斯康星州 | 单波段/波段组合、逐步回归、多元线性回归 | ln(SD) = b0 + b1(B2/B4) + b2B1 | 0.82 | 311 | OLI | Olmanson et al, 2016 |
| 中国吉林省中西部 | 先取相关系数较高的单波段、波段倒数、波段比值,再作多元线性回归 | SD=a(B1/B2)+b(B1/B3)+c(B2/B3)+d | 0.639 | 70 | HJ-1 CCD | 马建行等, 2016 |
| SD=aB1+bB2+c(B2/B3)+d | 0.894 | 63 | MODIS | |||
| 美国五大湖 | 单波段多项式 | 1/SD=aRrs (550)3 + bRrs (550)2 +cRrs (550) +d | 0.74 | 1328 | CZCS, SeaWiFS, MODIS | Binding et al, 2015 |
| 美国缅因州 | 单波段、波段比值 | SD= a(B1/B3)+bB1+cB7+d | 0.70~0.89 | 24~71 | TM | Courville et al, 2014 |
| 美国缅因州 | 单波段、波段比值 | SD= aB1+bB3+ c | 0.63~0.83 | 31~117 | TM | McCullough et al, 2012 |
| 美国明尼苏达州 | 根据前人经验直接利用蓝、红波段 | ln(SD)= aB1+bB3+ c | 0.32~0.71 | 748 | MODIS | Knight et al, 2012 |
| 中国太湖 | 直接利用前人经验公式 | ln(SD)=a(TM1/TM3)+bTM1+c | 0.77 | 32 | ETM+ | Zhao et al, 2011 |
| 鄱阳湖 | 取相关性较好的单波段、波段组合,做线性、对数、指数、倒数、开方、多项式回归取最优 取相关性较好的单波段、波段组合,做线性、对数、指数、倒数、开方、多项式回归取最优 | ln(SD)= aBblue+bBred+ c | 0.88 | 71 | MODIS | Wu et al, 2008 |
| ln(SD)= aBblue+bBred+ c | 0.83 | 25 | TM | |||
| 中国东北部 | 取单波段、波段比值、平均作一元回归 | SD= aB3/B2+b 或SD= aB3/B1+b 或SD= a (B1+B4)/2+b 或SD= a (B3+B2)/2+b 及上述方式变量取对数 | 0.69~0.98 | 7~20 | TM | Duan et al, 2009 |
| 美国明尼苏达州 | 直接利用前人经验公式 | ln(SD)=a(TM1/TM3)+bTM1+c | 0.71~0.96 | 13~278 | MSS, TM, ETM+ | Olmanson et al, 2008 |
| 美国明尼阿波利斯 | 单波段、波段组合、逐步回归选取关系较强参数,作多元回归 | ln(SD)=a(TM1/TM3)+bTM1+c | 0.70~0.80 | 21~53 | MSS,TM | Kloiber et al, 2002 |
4.1.1 单波段反射率与湖泊透明度的相关性
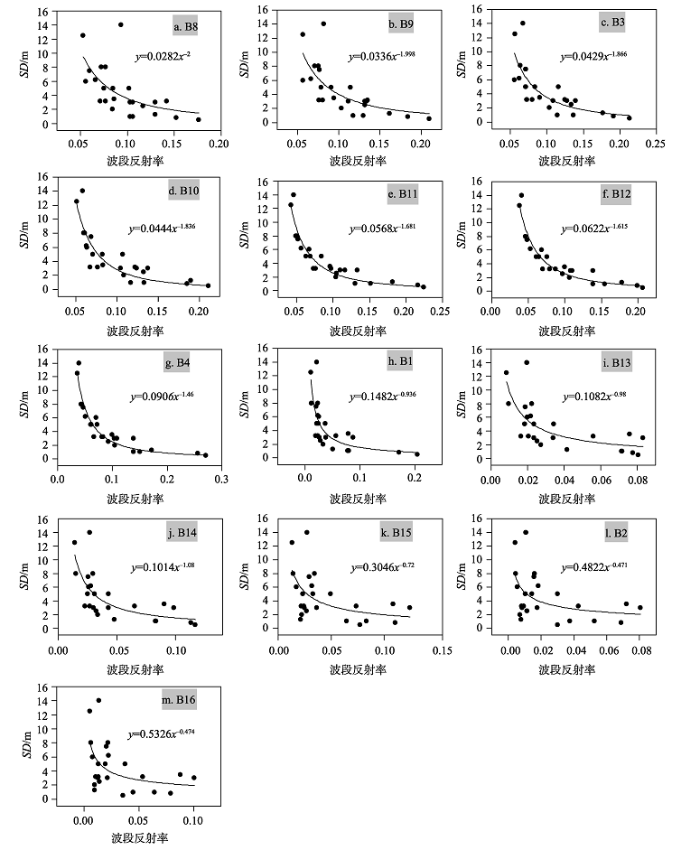
将MODIS L1B数据得到的湖泊水体表面反射率与对应的24个湖泊实测SD数据进行相关分析,结果表明(图2),MODIS各个波段的反射率与湖泊实测SD数据呈现出明显的非线性关系,湖泊水体在各波段的反射率会随着湖泊水体SD值的降低(即透明度降低)而呈现出加速增长的趋势。进一步使用指数函数、对数函数、幂函数对散点进行拟合后发现,幂函数的拟合效果最优,但在不同波段呈现出很大差异,拟合效果的R²介于0.22~0.91(图3)。
图2 湖泊实测SD值与MODIS不同波段反射率关系
Fig.2 Scatter plots of lake in situ SD and reflectance of MODIS bands
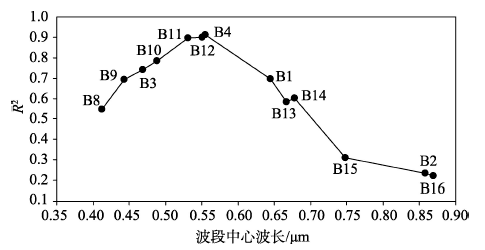
图3 基于单波段幂函数模型的MODIS不同波段对湖泊实测SD拟合效果
Fig.3 Retrieval accuracy (R²) of lake SD estimation with MODIS single band power function model
不同波段幂函数对湖泊实测SD的拟合效果呈现出一定的规律性,其拟合效果(R²)随着波段所在中心波长的变化呈明显的分异规律(图3):位于绿色波段的B11、B12、B4拟合效果最好,R²皆高于0.9,且之间差异很小;位于蓝色波段的B9、B3、B10拟合效果次之,R²均介于0.7~0.8之间,且随着波长增加而上升;位于紫色波段的B8和位于红色波段的B1、B13、B14拟合效果较差,R²均在0.55~0.70之间;而波段B15、B2、B16拟合效果最差,R²均低于0.32。因此,基于单波段回归模型的分析结果表明,本文涉及的湖泊透明度SD值对MODIS绿色波段(B11、B12、B4)最为敏感,其拟合效果具有较高的精度(R²=0.90~0.91, N=24)。
4.1.2 波段组合及其变换对湖泊水体透明度的反映
不同地区湖泊透明度SD值遥感反演模型的总结表明(表3),对波段数据进行数学变换(倒数、比值、加减)后的一元或多元回归分析对SD及ln(SD)可能会有较好的反演效果。因此,我们同样尝试使用这些方法分析湖泊透明度SD值的MODIS遥感反演效果。图2表明,单波段反射率与SD之间的幂函数关系最为显著,而对于幂函数而言,波段倒数只是对原单波段数值作的可逆数学转换,因此波段倒数对反演效果的进一步提升并无实际意义。对于波段比值与SD及ln(SD)之间的关系,考虑到本文使用的MODIS波段之间存在较强的相关性(即自变量之间存在较强的共线性),有必要先消除这种变量之间的共线性。因此,可先对波段反射率数据作主成分分析,在提取主成分的基础上进行多元回归。此外,由于红、绿、蓝波段比值与其中某一单波段的二元回归模型在众多地区也取得了较好的反演效果,故本文也尝试使用该方法进行建模。不同方法的反演效果如表4所示。
表4 使用不同方法对湖泊水体SD值的拟合结果
Tab.4 Retrieval accuracy of lake SD with different types of model
| 自变量类型 | 因变量 | 最优拟合自变量 | 最优拟合方法 | 最优拟合结果 | R² | N |
|---|---|---|---|---|---|---|
| 波段比值 | SD | x=B8/B11 | 线性 | SD= 8.8254x - 4.9669 | 0.65 | 24 |
| 指数 | SD= 0.3635e2.0575x | 0.59 | 24 | |||
| 对数 | SD= 10.027ln(x) + 4.1792 | 0.63 | 24 | |||
| 幂 | SD = 3.0486x2.5065 | 0.65 | 24 | |||
| 多项式 | SD= 0.4808x2 + 7.6165x - 4.2702 | 0.65 | 24 | |||
| 波段比值 | ln(SD) | x=B8/B4 | 线性 | ln(SD) = 1.5093x - 0.5485 | 0.60 | 24 |
| 多项式 | y = -0.9299x2 + 4.0536x - 2.0735 | 0.68 | 24 | |||
| 对数 | ln(SD) = 1.9501ln(x) + 1.04 | 0.68 | 24 | |||
| 幂 | 变量含负值,无法拟合 | |||||
| 指数 | 变量含负值,无法拟合 | |||||
| 主成分 | ln(SD) | 主成分PC1、PC2、PC3、PC4 (PC1-PC4累计贡献率>99%) | 主成分回归 | ln(SD)=-1.5PC1+0.95PC2+10.79PC3-21.55PC4 | 0.88 | 24 |
| 红绿蓝比值与单波段 | ln(SD) | x1=B1/B3、x2=B3 | 二元回归 | ln(SD)=1.211767x1-13.1984x2+1.149798 | 0.90 | 24 |
| 红绿蓝加减 | SD | x=B12+B4 | 幂 | SD=0.2187x-1.536 | 0.91 | 24 |
结果表明,使用波段比值作为自变量的一元回归线性、非线性模型反演湖泊透明度SD值的效果相对较差,其R²皆小于0.7。基于各波段主成分变换的回归拟合效果(R²=0.88)较上文绿色单波段(B11、B12、B4)幂函数反演效果(R²=0.90~0.91)也并未得到提升。利用红、绿、蓝波段比值与其中某波段的二元回归效果(R²=0.90),以及将波段相加减后作为自变量的拟合效果(R²=0.91),与上文绿色单波段(B11、B12、B4)幂函数反演效果(R²=0.90~0.91)基本持平。
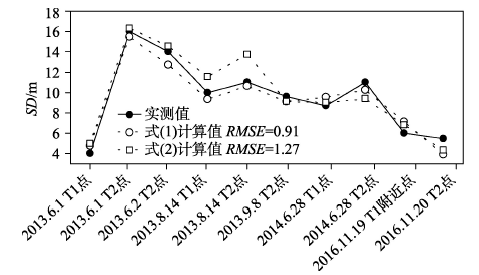
表4所列的2个相对最优的拟合效果中,对于以B12+B4作为自变量拟合表现出R²=0.91的效果,由于这2个波段单独作为自变量时拟合效果R²都很高(图2),故我们认为波段相加表现出的高拟合精度仅仅是由于统计叠加造成的,而对拟合效果的提升并无实际意义。对于波段比值与单波段组合的二元回归反演方法,利用在纳木错T1(30.844722°N,90.903611°E)、T2(30.768056°N,90.775556°E)点采集的不同时期湖水透明度SD数据,对绿色单波段回归方程(式(1))和波段比值与单波段组合的二元回归方程(式(2))两种拟合方法进行比较。
式中:SD为湖泊透明度塞氏盘深度;B4为MODIS B4波段地表反射率;B3为MODIS B3波段地表反射率;B1/B3为MODIS B1、B3波段地表反射率的比值。
上述2种方法的计算结果表明(图4),基于B4波段的幂函数反演公式(式(1))计算的SD值与实测SD值拟合效果更好(RMSE=0.91, N=10),而基于波段比值与单波段组合的二元回归反演公式(式(2))计算值与实测SD值并未表现出更为稳定的拟合效果(RMSE=1.27,N=10)。因此可以认为,基于MODIS B4波段的幂函数反演模型,最适合于本地区湖泊透明度的反演。
图4 基于单波段幂函数和波段比值与单波段的二元回归反演计算的SD值与实测值对比
Fig.4 Comparison between in situ SD values and calculated SD values with MODIS single band power function model and combination of band ratio-single band model
4.1.3 波段反射率对湖泊水体透明度的反映机制
基于不同湖泊水体透明度SD值与MODIS L1B数据反射率之间的统计关系,尝试建立了不同形式的湖泊水体透明度SD值遥感反演模型,其中效果最好的是基于绿色波段的单波段幂函数模型(式(1))。对于在其他地区使用较多的模型(表3)在本文中并未表现出最好的拟合效果,可能是由于水体性质的不同所致。水体性质的差异,使得不同光学组分对湖泊水体透明度主导作用不同,必然改变水体在不同波段反射率的变化规律(Gitelson et al, 2000),因而影响相关模型的拟合效果。
基于统计方法得到的反演模型虽不能直接体现其物理意义,但诸多研究呈现出的遥感数据与湖泊透明度SD值之间的较高相关性(表3),表明这些模型必然与相关物理基础相契合。对于青藏高原地区的湖泊而言,一方面,该地区气候寒冷,湖泊浮游生物生产力较低,较少的人类活动也使进入湖泊的营养物质极少,悬浮物浓度不仅总体较低,而且其叶绿素和有机质成分也较少,因而大部分湖泊具有较高的透明度;另一方面,高原太阳辐射较强,并能穿透较深的湖水,由于浮游生物和沉水植物光合作用主要发生在湖泊的真光层(Delgadillo-Hinojosa et al, 1997),而湖泊SD深度与真光层深度密切相关(Garibaldi et al, 2003),因此SD深度内水体的反射率光谱对绿色波段最为敏感。同时,由于青藏高原地区的湖泊大多为封闭湖泊,在干旱的气候条件下,强烈蒸发导致湖水矿化度增高,以Na+为主的盐分对蓝色波段的反射更为敏感,因此,在红蓝波段比值与蓝色单波段组合的二元回归公式中呈现较高的拟合度。这与本文的研究结果中,SD值与中心波长位于0.44~0.50 μm的波段(B9、B3、B10)表现出较好的拟合效果一致。
基于上文建立的湖泊透明度遥感反演公式(式(1))和MOD09数据,以青藏高原中南部的大湖当惹雍错为例,反演湖泊透明度季节、年际变化基本特征,并分析其与流域温度、降水之间的关系。
当惹雍错(N30°45′~31°22′,E86°23′~86°49′)位于西藏尼玛县,是冈底斯山脉中段北麓断陷盆地内的一个封闭湖泊(图5)。湖泊呈长靴状,湖面海拔4528 m,长71.7 km,最大宽19.4 km,平均宽11.65 km。最新统计显示,湖泊水域面积为846.49 km2,流域面积为9022.56 km2(Yang et al, 2017)。南部的达果藏布和西部的卜寨藏布为湖泊的主要补给河流。其中达果藏布长210.1 km,集水面积5898.8 km2;卜寨藏布长56.0 km,集水面积736.0 km2(中国科学院青藏高原综合科学考察队, 1984)。以中间最窄处为界线可将湖泊分为南北两部分,实测数据显示,北部湖区为整个湖泊的深水部分,四周湖岸坡度较大,中央湖区水深超过 200 m, 实测最大水深为214. 48 m。中间最窄处湖区水深也超过100 m,南部湖区的最南部地形较缓,中间只有小部分湖区水深超过100 m, 实测最深处为 110 m,湖泊盐度为9.4 g/L(王君波等, 2010; Qiao et al, 2017)。
4.2.1 湖泊透明度时间变化基本特征
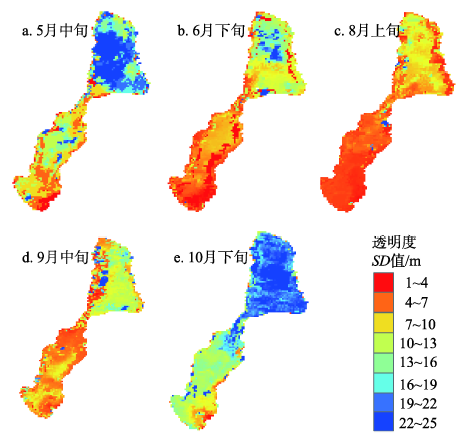
本文首先提取了当惹雍错不同季节(2015年)的湖泊透明度SD值,其分布如图6所示。结果显示,当惹雍错湖泊透明度在该年不同季节存在明显的变化特征:从5月中旬-10月下旬,湖泊水体透明度整体上呈现出先降低后升高的变化趋势:5月中旬,湖泊大部分水域透明度SD值大于7 m;6月下旬,湖泊透明度SD值低于7 m的水域大幅增加,8月上旬则进一步扩大;到了9月中旬,透明度SD值深度有所回升,直至10月下旬,湖泊大部分水域透明度SD值都大于10 m。湖泊透明度夏季相对偏低,春、秋季节相对偏高。此外,还应注意到,湖泊透明度整体随季节变化的同时,北部湖盆透明度相对更高,而南部湖盆透明度则相对更低。
图6 2015年当惹雍错透明度季节变化特征
Fig.6 Seasonal variation of lake water clarity of Tangra Yumco in 2015
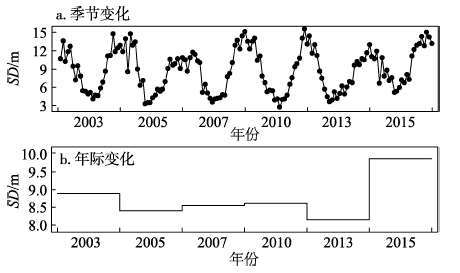
进一步分析当惹雍错湖泊水体透明度不同年份的季节变化以及年际变化特征,提取了当惹雍错2003、2005、2007、2010、2013、2015年共计6年湖泊透明度SD值。考虑到湖泊结冰状况,选择MOD09产品每年编号为137~329(5月中旬-11月下旬)的遥感影像,作为时间变化数据,最终参与分析的遥感影像共计150景。但仍存在因湖泊水域内部分区域结冰,或是遥感影像噪点所造成的像元数值极高或极低而引起的误差。故本文以大于25 m和小于1 m为阈值(根据总体情况,显示SD深度不超过25 m,有云像元显示SD小于1 m,非云像元一般大于1 m,故以此为阈值),剔除显示数值大于25 m和小于1 mm的像元,取剩余有效像元计算得到的平均值作为湖泊该景影像SD数据,以保证参与计算的像元数据质量。其中,剩余有效像元数量占所有像元比例皆超过90%。按照这一原则,提取了当惹雍错透明度SD深度不同年份时间变化序列。取湖泊水域所在像元SD值,计算其平均值作为该景影像湖泊SD值。取该年内所有影像平均值,作为该年SD值。当惹雍错透明度SD值在不同年份的季节及年际变化如图7所示。
结果显示,从季节上看,当惹雍错湖泊透明度在不同年份表现出相似的季节波动特征:每年5月中旬,湖泊透明度SD深度较高,达到10~15 m左右;到了夏季,湖泊水体透明度逐渐下降,其SD深度降至最低,仅为3~5 m;而到了11月,湖泊透明度重新提高,其SD值回升到10~15 m左右。这与图6显示的规律是基本一致的。而从年际变化来看,湖泊透明度也存在一定幅度的变化,最低值出现在2013年,该年平均SD值为8.2 m,而最高值则出现在2015年,该年平均SD值为9.9 m。
4.2.2 湖泊透明度时间变化与流域温度、降水之间关系
为了进一步探讨当惹雍错湖泊水体透明度的影响因素,本文利用流域温度,降水数据,分析其与湖泊透明度的关系。取湖泊所在流域对应的数据,计算得到流域内平均值,将上述平均值与图7所示的当惹雍错透明度时间变化进行对比。
图7 当惹雍错透明度季节、年际变化特征
Fig.7 Seasonal and inter-annual variations of lake water clarity of Tangra Yumco
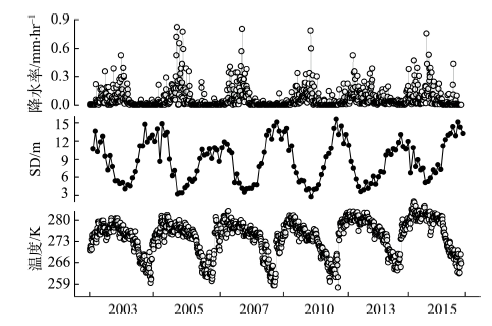
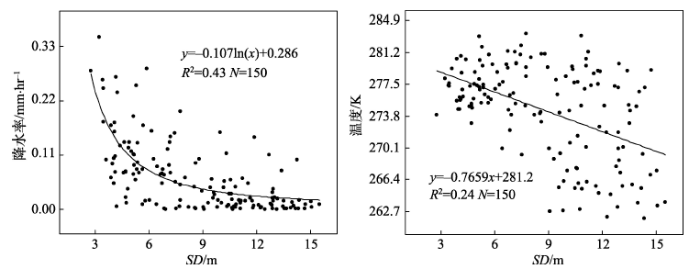
结果显示(图8),当惹雍错湖泊水体透明度的变化趋势与流域温度、降水率总体上呈负相关的关系,即降水率越大,温度越高,湖泊透明度越低;而降水率越小,温度越低,则透明度越高。图9进一步拟合了透明度SD值与降水率、温度的关系,发现降水率与SD值的拟合关系相对更好,其R2达到0.43;而温度与SD值的R2 为0.24。这表明了流域降水率对当惹雍错湖泊水体透明度相对更为显著的影响。
图8 当惹雍错透明度与流域温度、降水率对比
Fig.8 Comparison of lake water clarity (SD) and lake basin temperature and precipitation intensity of Tangra Yumco
图9 当惹雍错透明度与流域温度、降水率散点图
Fig.9 Scatter plots of lake water clarity (SD) and lake basin temperature and precipitation intensity of Tangra Yumco
对于湖泊透明度与气象数据的关系,类似的现象也反映在美国威斯康星(Wisconsin)地区湖泊透明度的相关研究中(Rose et al, 2017)。该项研究表明,湖泊在相对较湿润的年份,透明度会下降;而在相对较干旱的年份,透明度会升高。对于本文得出的当惹雍错流域降水率与湖泊透明度变化之间存在的较好关系,主要是由于流域降水对汇湖河流产生影响,进而引起河流携带进入湖泊物质的变化,因而对湖泊透明度产生影响。当降水率增加,河流携带进入湖泊的物质增加,从而使得湖泊水体相对更加浑浊,进而降低了湖泊的透明度;反之,由于河流携带进入湖泊的物质减少,因而使得湖泊水体相对清澈,致使湖泊透明度提高。从湖泊水域空间分布来看,当惹雍错湖泊透明度季节变化,南部湖盆相比较北部湖盆透明度明显偏低(图6)。一方面,该湖主要入湖河流多位于南部湖盆(图5),加之相对狭长的湖盆形态,使得南部湖盆受河流影响更大;另一方面,北部湖盆的水深梯度由岸边到中心急剧降低,并且水深较大,使得地表径流入湖后影响的空间范围有限,因此,在降水/融水季节,南部湖盆的湖泊透明度相对较低。同时,对于平均盐度高达9.4 g/L的盐湖来讲,其湖水中较高的Na+使得湖水对蓝色波段具有强烈的反射作用,在5月和10月入湖河流影响较弱的季节,北部湖盆湖水对绿色波段的反射受到对蓝色波段反射的影响,致使以绿色波段反演的湖水透明度的明显增加。
本文基于青藏高原地区24个湖泊透明度SD值实测数据及MODIS遥感数据,建立了该地区湖泊透明度SD值的遥感反演模型,并反演得到当惹雍错透明度时间变化特征,分析了其与流域温度、降水之间的关系。主要结论为:
(1) 基于MODIS绿色波段B4的单波段幂函数模型在本地区反演效果最好,精度较高(R²=0.91, N=24),借助在不同时期所获取的实测SD数据对上述模型进行验证,表明上述模型具有较好的稳定性(RMSE=0.91 m, N=10)。因此基于MODIS B4波段的幂函数反演模型最适合于青藏高原地区湖泊透明度SD值遥感反演。
(2)当惹雍错透明度存在明显的季节波动和较为明显的年际变化。5月中旬-10月下旬,湖泊水体透明度整体上呈现出先降低后升高的变化趋势;湖泊透明度年际变化较为明显,2013年湖泊透明度SD值平均为8.2 m,2015年湖泊透明度SD值平均为9.9 m。初步分析表明,降水/融水季节的湖泊透明度与湖泊所在流域的降水率具有密切的关系。
致谢:感谢暨南大学林秋奇副教授、中国科学院青藏高原研究所侯居峙研究员、马庆峰博士、汪勇博士、郭允博士等在野外调查和数据获取方面的协作和帮助。
The authors have declared that no competing interests exist.
| [19] |
Studies on the phytoplankton of the deep subalpine Lake Iseo [J].https://doi.org/10.4081/jlimnol.2003.177 URL [本文引用: 1] 摘要
<br /><div>This paper reports the results of investigations carried out on the chemical characteristics and phytoplankton community of Lake Iseo. Samplings were performed on a monthly basis from 1998 to 2000. At least three main algal groups dominated the community throughout the study period. The large Bacillariophyceae were dominant mainly during late winter and early spring (Aulacoseira spp., Melosira varians, Asterionella formosa), with few species able to maintain occasional positive growth also during mid summer and/or autumn (Fragilaria crotonensis and Diatoma elongatum). The thermal stability of the water column and silica depletion were the main factors responsible for the decline of the large spring diatoms. The subsequent growth of Mougeotia sp. (Conjugatophyceae) was favoured by its lower sinking rate and resistance to increasing grazing pressure by the dominant copepods (Copidodiaptomus steueri) and cladocerans (Daphnia hyalina ?? galeata). Among the cyanobacteria, the greater development of Planktothrix rubescens in the autumn months, with conditions of vertical homogenisation and decreasing Zeu/Zmix ratios, was favoured by its ability to survive at low light irradiances. The temporal replacement of these three groups constitutes the main sequence of the annual phytoplankton succession in Lake Iseo. A large development of other algal groups was recorded only in one or two of the three study years (e.g. Dinophyceae and Chlorococcales). The changes observed in the annual phytoplankton development are discussed in the light of differences in the spring fertilisation of the waters, caused by differences in the depth of the layer involved in the late winter and spring vertical mixing.
|
| [20] |
Remote estimation of phytoplankton density in productive waters [J]. |
| [21] |
Spatial and long-term temporal assessment of Lake Ontario water clarity, nutrients, chlorophyll a, and zooplankton [J].https://doi.org/10.1080/14634980802515302 URL [本文引用: 1] 摘要
Secchi depth, total phosphorus, soluble reactive phosphorus, silica, chlorophyll a, and zooplankton (density, biomass, and average size) were sampled as part of a lake-wide, seasonal (spring, summer, and fall) assessment of Lake Ontario in 2003 to characterize the status of the lower aquatic food web. For each parameter, spatial comparisons were performed to test for differences between habitats (nearshore and offshore) and between regions (east and west) during each season. Significant differences between habitats were found only for silica and chlorophyll a; silica was higher nearshore in fall, and chlorophyll a was higher offshore in fall. Significant differences between regions were detected in Secchi depth, epilimnetic zooplankton mean length, total phosphorus and Cercopagis pengoi density and biomass; Secchi depth and zooplankton mean length were higher in the east in spring, total phosphorus and Cercopagis pengoi biomass were higher in the west in summer, and Cercopagis pengoi biomass was higher in the east in fall. Cercopagis pengoi was present lake-wide in summer and fall, but Bythotrephes longimanus was present only in fall in the Kingston basin. Mean spring total phosphorus, soluble reactive phosphorus, chlorophyll a, and epilimnetic zooplankton density and biomass are at or near record low levels. As we move into the future, persistent low levels of these lower food web elements will continue to stress alewife populations both through reduced food resources and food quality for zooplankton, and may force these fish to seek alternative food such as Mysis.
|
| [22] |
A procedure for regional lake water clarity assessment using Landsat multispectral data [J].https://doi.org/10.1016/S0034-4257(02)00022-6 URL [本文引用: 1] 摘要
Although previous investigations have demonstrated reliable empirical relationships between satellite data and nearly contemporaneous ground observations, satellite imagery has not been incorporated into routine lake monitoring programs. This paper focuses on key issues involved in applying satellite imagery to the regional assessment of lake clarity. Ten Landsat Thematic Mapper (TM) images and four Multispectral Scanner (MSS) images of the Twin Cities Metropolitan Area (TCMA) spanning 25 years (1973鈥1998) were analyzed. Based on this analysis, recommendations are made for a Landsat-based procedure for water clarity assessment. Closeness of fit ( r 2 values) of regression models between satellite brightness data and measured Secchi disk transparency (SDT) decreased with increasing size of the time window between image collection and ground observation of SDT. Use of SDT data collected within 卤1 day of the image date is recommended, but where SDT data are limited, windows up to 卤7 days yield reasonable results, especially in late summer when water clarity is relatively constant. Average brightness data from at least nine pixels in the deep open area of a lake should be used to predict lake clarity, but the accuracy of predicted SDT did not improve much as the number of pixels in the area of interest (AOI) increased above this value. A three-coefficient regression model using the TM1/TM3 ratio and TM1 was a consistent and reliable predictor of SDT ( r 2 values of .7鈥.8). A similar relationship involving the MSS1/MSS2 ratio and MSS1 was a reasonable predictor of SDT for MSS data. Efforts to produce a standard prediction equation for SDT applicable to images collected on different dates were not successful, but a simple regression procedure to account for differences in atmospheric conditions among image collection dates substantially decreased the range of coefficients in the regression model.
|
| [23] |
Application of MODIS imagery for intra-annual water clarity assessment of Minnesota Lakes [J]. |
| [24] |
Water clarity in Lake Mendota since 1900: Responses to differing levels of nutrients and herbivory [J]. |
| [25] |
Species interactions slow warming-induced upward shifts of treelines on the Tibetan Plateau [J].https://doi.org/10.1073/pnas.1520582113 URL PMID: 27044083 [本文引用: 1] 摘要
The alpine treeline is commonly regarded as being sensitive to climatic warming because regeneration and growth of trees at treeline generally are limited by low temperature. The alpine treelines of the Tibetan Plateau (TP) occur at the highest elevations (4,900 m above sea level) in the Northern Hemisphere. Ongoing climatic warming is expected to shift treelines upward. Studies of treeline dynamics at regional and local scales, however, have yielded conflicting results, indicating either unchanging treeline elevations or upward shifts. To reconcile this conflict, we reconstructed in detail a century of treeline structure and tree recruitment at sites along a climatic gradient of 4 掳C and mean annual rainfall of 650 mm on the eastern TP. Species interactions interacted with effects of warming on treeline and could outweigh them. Densification of shrubs just above treeline inhibited tree establishment, and slowed upward movement of treelines on a time scale of decades. Interspecific interactions are major processes controlling treeline dynamics that may account for the absence of an upward shift at some TP treelines despite continued climatic warming.
|
| [26] |
China’s lakes at present: Number, area and spatial distribution [J].https://doi.org/10.1007/s11430-010-4052-6 URL [本文引用: 1] 摘要
Based on 11004 satellite images from CBERS CCD and Landsat TM/ETM, changes in the spatial characteristics of all lakes in China were determined following pre-established interpretation rules. This dataset was supported by 6843 digital raster images (1:100000 and 1:50000), a countrywide digital vector dataset (1:250000), and historical literature. Comparative data were corrected for seasonal variations using precipitation data. There are presently 2693 natural lakes in China with an area greater than 1.0 km
|
| [27] |
The case for a global inland water quality product [C]// |
| [28] |
Assessing water quality by remote sensing in small lakes: The case study of Monticchio lakes in southern Italy [J]. |
| [29] |
Combining lake and watershed characteristics with Landsat TM data for remote estimation of regional lake clarity [J].https://doi.org/10.1016/j.rse.2012.03.006 URL 摘要
Water clarity is a reliable indicator of lake productivity and an ideal metric of regional water quality. Clarity is an indicator of other water quality variables including chlorophyll-a, total phosphorus and trophic status; however, unlike these metrics, clarity can be accurately and efficiently estimated remotely on a regional scale. Remote sensing is useful in regions containing a large number of lakes that are cost prohibitive to monitor regularly using traditional field methods. Field-assessed lakes generally are easily accessible and may represent a spatially irregular, non-random sample of a region. We developed a remote monitoring program for Maine lakes >02802ha (1511 lakes) to supplement existing field monitoring programs. We combined Landsat 5 Thematic Mapper (TM) and Landsat 7 Enhanced Thematic Mapper Plus (ETM+) brightness values for TM bands 1 (blue) and 3 (red) to estimate water clarity (secchi disk depth) during 1990–2010. Although similar procedures have been applied to Minnesota and Wisconsin lakes, neither state incorporates physical lake variables or watershed characteristics that potentially affect clarity into their models. Average lake depth consistently improved model fitness, and the proportion of wetland area in lake watersheds also explained variability in clarity in some cases. Nine regression models predicted water clarity (R 2 02=020.69–0.90) during 1990–2010, with separate models for eastern (TM path 11; four models) and western Maine (TM path 12; five models that captured differences in topography and landscape disturbance. Average absolute difference between model-estimated and observed secchi depth ranged 0.65–1.0302m. Eutrophic and mesotrophic lakes consistently were estimated more accurately than oligotrophic lakes. Our results show that TM bands 1 and 3 can be used to estimate regional lake water clarity outside the Great Lakes Region and that the accuracy of estimates is improved with additional model variables that reflect physical lake characteristics and watershed conditions.
|
| [30] |
A 20-year Landsat water clarity census of Minnesota's 10000 lakes [J].https://doi.org/10.1016/j.rse.2007.12.013 URL [本文引用: 1] 摘要
A 20-year comprehensive water clarity database assembled from Landsat imagery, primarily Thematic Mapper and Enhanced Thematic Mapper Plus, for Minnesota lakes larger than 8ha in surface area contains data on more than 10,500 lakes at five-year intervals over the period 1985–2005. The reliability of the data was evaluated by examining the precision of repeated measurements on individual lakes within short time periods using data from adjacent overlapping Landsat paths and by comparing water clarity computed from Landsat data to field-collected Secchi depth data. The agreement between satellite data and field measurements of Secchi depth within Landsat paths was strong (average R 2 of 0.83 and range 0.71–0.96). Relationships between late-summer Landsat and field-measured Secchi depth for the combined statewide data similarly were strong ( r 2 of 0.77–0.80 for individual time periods and r 2 02=020.78 for the entire database). Lake clarity has strong geographic patterns in Minnesota; lakes in the south and southwest have low clarity, and lakes in the north and northeast tend to have the highest clarity. This pattern is evident at both the individual lake and the ecoregion level. Mean water clarity in the Northern Lakes and Forest and North Central Hardwood Forest ecoregions in central and northern Minnesota remained stable from 1985 to 2005 while decreasing water clarity trends were detected in the Western Corn Belt Plains and Northern Glaciated Plains ecoregions in southern Minnesota, where agriculture is the predominant land use. Mean water clarity at the statewide level also remained stable with an average around 2.25m from 1985 to 2005. This assessment demonstrates that satellite imagery can provide an accurate method for obtaining comprehensive spatial and temporal coverage of key water quality characteristics that can be used to detect trends at different geographic scales.
|
| [31] |
Evaluation of medium to low resolution satellite imagery for regional lake water quality assessments [J].https://doi.org/10.1029/2011WR011005 URL [本文引用: 1] 摘要
This study evaluates currently available imagery from Landsat, MERIS, MODIS, and AWiFS sensors for their usefulness in regional-scale measurements of lake water clarity and chlorophyll for comprehensive lake management and scientific studies (e.g., modeling). Images from these systems were collected nearly concurrently and processed using methods similar to those developed previously for regional assessments of lake water clarity using Landsat imagery. We tested both atmospherically corrected and uncorrected imagery products; the uncorrected products performed as well as or better than the atmospherically corrected products in empirical relationships to estimate water clarity and chlorophyll. MODIS and MERIS systems, which have large swath widths and high temporal coverage are well suited for regional assessments of large lakes, but their low spatial resolution limits the number of lakes that can be assessed. Landsat imagery allows all lakes 鈮4 ha (more than 12,000 in Minnesota) to be assessed, but its low spectral resolution limits assessments to water clarity. The MERIS system, with spectral and spatial resolution suitable for large (>150 ha) lakes, was the only system with a spectral band set that measured key absorption and scattering characteristics of phytoplankton that could be used reliably for regional chlorophyll assessments. Although none of the currently available systems is ideal, the study yielded a better definition of the spectral, spatial, and temporal characteristics of the ideal system for regional-scale water quality remote sensing that may be realized in upcoming satellite systems.
|
| [32] |
Comparison of Landsat 8 and Landsat 7 for regional measurements of CDOM and water clarity in lakes [J].https://doi.org/10.1016/j.rse.2016.01.007 URL 摘要
For water clarity measured as Secchi depth (SD), we compared September 1, 2008 Landsat 7 and August 22, 2013 Landsat 8 images from path 28 using stepwise regression to identify the best model using all bands and band ratios including the new blue and narrower NIR band. The best water clarity model for Landsat 8 used the OLI 2/4 band ratio plus OLI band 1 and was nearly identical with a model using the OLI 2/4 band ratio plus OLI band 2. The latter model is similar to the model used for previous Landsat water clarity assessments, which used the ETM聽+ 1/3 band ratio plus ETM聽+ band 1. For SD measurements we found strong relationships with both sensors, with only slight improvements for the OLI sensor for the lakes in our datasets. In contrast to some previous reports that indicated Landsat 7's ETM聽+ lacked sufficient sensitivity for reliable retrieval of CDOM, we found that overall both sensors worked well for water clarity and CDOM measurements. This will allow their continued use for current and historical measurements of important water characteristics on a regional scale.
|
| [33] |
Characteristics and seasonal variations in the hydrochemistry of the Tangra Yumco basin, central Tibetan Plateau, and responses to the Indian Summer Monsoon [J].
This study focuses on the characteristics, seasonal variations, and controlling mechanisms of the ionic composition of the Tangra Yumco basin for lake water, river water, and rainfall, which is locate
|
| [34] |
Snow cover distribution, variability, and response to climate change in western China [J]. |
| [35] |
Annual precipitation regulates spatial and temporal drivers of lake water clarity [J].https://doi.org/10.1002/eap.1471 URL PMID: 27859882 [本文引用: 2] 摘要
Abstract Understanding how and why lakes vary and respond to different drivers through time and space is needed to understand, predict, and manage freshwater quality in an era of rapidly changing land use and climate. Water clarity regulates many characteristics of aquatic ecosystems and is responsive to watershed features, making it a sentinel of environmental change. However, whether precipitation alters the relative importance of features that influence lake water clarity or the spatial scales at which they operate is unknown. We used a dataset of thousands of north temperate lakes and asked: (1) How does water clarity differ between a very wet versus dry year? (2) Does the relative importance of different watershed features, or the spatial extent at which they are measured, vary between wet and dry years? (3) What lake and watershed characteristics regulate long-term water clarity trends? Among lakes, water clarity was reduced and less variable in the wet year than in the dry year; furthermore, water clarity was reduced much more in high-clarity lakes during the wet year than in low-clarity lakes. Climate, land use/land cover, and lake morphometry explained most variance in clarity among lakes in both years, but the spatial scales at which some features were important differed between the dry and wet years. Watershed percent agriculture was most important in the dry year, whereas riparian zone percent agriculture (around each lake and upstream features) was most important in the wet year. Between 1991 and 2012, water clarity declined in 23% of lakes and increased in only 6% of lakes. Conductance influenced the direction of temporal trend (clarity declined in lakes with low conductance), whereas the proportion of watershed wetlands, catchment-to-lake-area ratio, and lake maximum depth interacted with antecedent precipitation. Many predictors of water clarity, such as lake depth and landscape position, are features that cannot be readily managed. Given trends of increasing precipitation, eliminating riparian zone agriculture or keeping it <10% of area may be an effective option to maintain or improve water clarity. This article is protected by copyright. All rights reserved. This article is protected by copyright. All rights reserved.
|
| [36] |
Strong impacts of daily minimum temperature on the green-up date and summer greenness of the Tibetan Plateau [J].https://doi.org/10.1111/gcb.13301 URL PMID: 27103613 [本文引用: 1] 摘要
Abstract Understanding vegetation responses to climate change on the Tibetan Plateau (TP) helps in elucidating the land–atmosphere energy exchange, which affects air mass movement over and around the TP. Although the TP is one of the world's most sensitive regions in terms of climatic warming, little is known about how the vegetation responds. Here, we focus on how spring phenology and summertime greenness respond to the asymmetric warming, that is, stronger warming during nighttime than during daytime. Using both in02situ and satellite observations, we found that vegetation green-up date showed a stronger negative partial correlation with daily minimum temperature ( T min) than with maximum temperature ( T max) before the growing season (‘preseason’ henceforth). Summer vegetation greenness was strongly positively correlated with summer T min, but negatively with T max. A 1-K increase in preseason T min advanced green-up date by 402days ( P max</sub> did not advance green-up date ( P > 0.10) and higher summer T max even reduced greenness by 2.6%02K611 ( P min</sub> were likely caused by reduced low temperature constraints, and the apparent negative effects of higher T max on greenness were probably due to the accompanying decline in water availability. The dominant enhancing effect of nighttime warming indicates that climatic warming will probably have stronger impact on TP ecosystems than on apparently similar Arctic ecosystems where vegetation is controlled mainly by T max. Our results are crucial for future improvements of dynamic vegetation models embedded in the Earth System Models which are being used to describe the behavior of the Asian monsoon. The results are significant because the state of the vegetation on the TP plays an important role in steering the monsoon.
|
| [1] |
2000-2013年西藏纳木错湖冰变化及其影响因素 [J].https://doi.org/10.18306/dlkxjz.2015.10.004 URL [本文引用: 1] 摘要
湖冰物候事件是气候变化的敏感指示器.本文以西藏纳木错湖为研究对象,基于MODIS多光谱反射率产品数据监测了2000-2013年纳木错湖冰冻融日期,并结合多个气象站点的气象数据和实测湖面温度、湖面辐射亮温分析验证了湖冰变化的原因.纳木错湖冰变化较好地响应了区域气候变暖:开始冻结日期延迟和完全消融日期提前使湖冰存在期显著缩短(2.8 d/a)、湖冰冻结期增长、湖冰消融期缩短,其中消融期变化最为明显,平均每年缩短3.1d.湖冰冻融日期的变化表明:2000年后纳木错湖冰冻结困难,消融加速,稳定性减弱.纳木错湖冰变化主要受湖面温度、湖面辐射亮温和气温变化的影响,它们可以作为气象因子来解释区域气候变化.
Lake ice change at the Nam Co Lake on the Tibetan Plateau during 2000-2013 and influencing factors [J].https://doi.org/10.18306/dlkxjz.2015.10.004 URL [本文引用: 1] 摘要
湖冰物候事件是气候变化的敏感指示器.本文以西藏纳木错湖为研究对象,基于MODIS多光谱反射率产品数据监测了2000-2013年纳木错湖冰冻融日期,并结合多个气象站点的气象数据和实测湖面温度、湖面辐射亮温分析验证了湖冰变化的原因.纳木错湖冰变化较好地响应了区域气候变暖:开始冻结日期延迟和完全消融日期提前使湖冰存在期显著缩短(2.8 d/a)、湖冰冻结期增长、湖冰消融期缩短,其中消融期变化最为明显,平均每年缩短3.1d.湖冰冻融日期的变化表明:2000年后纳木错湖冰冻结困难,消融加速,稳定性减弱.纳木错湖冰变化主要受湖面温度、湖面辐射亮温和气温变化的影响,它们可以作为气象因子来解释区域气候变化.
|
| [37] |
Modeling and analysis of lake water storage changes on the Tibetan Plateau using multi-mission satellite data [J].https://doi.org/10.1016/j.rse.2013.03.013 URL [本文引用: 1] 摘要
Estimation of the water storage changes in the lakes of the Tibetan Plateau (TP) is essential for an accurate evaluation of climate change in this alpine region and its impact on the surrounding hydrologic environment. Because of the remoteness and poor accessibility of these alpine lakes, and a lack of lake bathymetric data, estimating their mass budget over the TP poses a considerable challenge. However, the integration of optical remote sensing images, satellite altimetry data, and gravimetry data makes it possible to monitor the overall variations in lake water storage in this extensive region. The ICESat/GLAS altimetry data used in this study reveal that most of the lakes in the TP showed a significant upward tendency (0.2―0.6 m/year) in water level between 2003 and 2009, particularly those lakes that are supplied with a large proportion of glacial meltwater. A series of lake area data derived from Landsat MSS/TM/ETM + imagery over the past four decades indicate that during the 1970―1990 period most of the lakes experienced severe shrinkage, with only some of those in central and western Tibet undergoing expansion. During the 1990―2011 period, in contrast, the majority of the lakes on the TP displayed a remarkably expansion tendency. The total lake area increased from 35,638.11 km
|
| [38] |
Comparison of MODIS and Landsat TM5 images for mapping tempo-spatial dynamics of Secchi disk depths in Poyang Lake national nature reserve, China [J].https://doi.org/10.1080/01431160701422254 URL [本文引用: 1] 摘要
Landsat has successfully been applied to map Secchi disk depth of inland water bodies. Operational use for monitoring a dynamic variable like Secchi disk depth is however limited by the 16‐day overpass cycle of the Landsat system and cloud cover. Low spatial resolution Moderate Resolution Imaging Spectroradiometer (MODIS) image captured twice a day could potentially overcome these problems. However, its potential for mapping Secchi disk depth of inland water bodies has so far rarely been explored. This study compared two image sources, MODIS and Landsat Thematic Mapper (TM), for mapping the tempo–spatial dynamics of Secchi disk depth in Poyang Lake National Nature Reserve, China. Secchi disk depths recorded at weekly intervals from April to October in 2004 and 2005 were related to 5 Landsat TM and 22 MODIS images respectively. Two multiple regression models including the blue and red bands of Landsat TM and MODIS respectively explained 83% and 88% of the variance of the natural logarithm of Secchi disk depth. The standard errors of the predictions were 0.20 and 0.3702m for Landsat TM and MODIS‐based models. A high correlation (r02=020.94) between the predicted Secchi disk depth derived from the two models was observed. A discussion of advantages and disadvantages of both sensors leads to the conclusion that MODIS offers the possibility to monitor water transparency more regularly and cheaply in relatively big and frequently cloud covered lakes as is with Poyang Lake.
|
| [2] |
中国区域高时空分辨率地面气象要素驱动数据集[Z] .China meteorological forcing dataset [Z]. |
| [39] |
Causes of glacier change in the source regions of the Yangtze and Yellow Rivers on the Tibetan Plateau [J].https://doi.org/10.3189/172756503781830449 URL [本文引用: 1] 摘要
Glaciers are an important element of the environment in the source regions of the Yangtze and Yellow rivers on the Tibetan Plateau. Using Geographical Information System techniques, we have studied changes in the location of glacier margins in two areas: the Geladandong area in the headwaters of the Yangtze, and the A'nyêmaqên Shan mountains in the headwaters of the Yellow River. Marginal positions during the Little Ice Age (LIA) maximum, in 1969 in the Geladandong area, in 1966 in the A'nyêmaqên Shan, and in 2000 in both areas, were determined using aerial photographs, satellite images, topographical maps and digital elevation models. Extrapolating the results to the entire source regions of the Yangtze and Yellow rivers, we estimate that the total glacierized area decreased about 1.7% between 1969 and 2000 in the Geladandong area and about 17% between 1966 and 2000 in the A'nyêmaqên Shan. Glaciers were stable or advanced slightly between 1969 and 1995 in the Geladandong area, and between 1966 and 1981 in the A'nyêmaqên Shan, but have retreated since the mid-1990s in the former and since the 1980s in the latter. Significant increases in summer air temperature and decreases in annual precipitation are the causes of the present retreat. As a consequence of the retreat, water storage, as ice, in the Yangtze and Yellow river drainages is decreasing by 65-70 x 106m3a-1.
|
| [40] |
Spatiotemporal variations in volume of closed lakes on the Tibetan Plateau and their climatic responses from 1976 to 2013 [J].
Abstract To study the response of lakes to climate change, variations in volume of closed lakes larger than 50 km2 on the Tibetan Plateau (TP) were analyzed by integrating Shuttle Radar Topography Mission, Digital Elevation Model (SRTM DEM) and LANDSAT images. Total lake volume (LV) increased (net) by 102.64 km3 during 1976–2013 with an average annual rate of 2.77 km3 year611; the rate increased dramatically to 7.67 km3 year611 during 2000–2013. Four main patterns of LV change were discovered using k-means clustering analysis: (1) a slight increase in LV during 1976–2000 followed by a rapid increase in the southeastern part of the endorheic region, (2) an initial decrease in LV followed by an increase during 1990–2013 in the central and western parts of the endorheic region, (3) an initial decrease in LV followed by an increase during 2000–2013 in the northeastern part of the endorheic region, and (4) an overall decrease during the whole study period for the southern outflow region. Precipitation was the dominant factor affecting LV change. In particular, abnormally large amounts of precipitation during 2000–2013 resulted in a dramatic increase in LV. Temperature changes were positively correlated to LV change before 2000 and negatively after 2000. Glaciers have different influence on LV change based on the comparison between lakes with and without glacial melt input. The distinct regional patterns of change in LV indicate that the sensitivity of lakes to a changing climate varies depending upon the time period and spatial location. These findings have important implications for both the interpretation of past lake level records and prediction of future lake responses to climate change.
|
| [3] |
青藏高原典型冰川和湖泊变化遥感研究 [J].https://doi.org/10.3969/j.issn.1000-0240.2005.06.001 URL [本文引用: 1] 摘要
青藏高原冰川和湖泊变化是气候变化敏感的指示器, 利用地形图、航空照片、 TM卫星遥感资料和其它相关研究文献资料, 分析了青藏高原典型地区的冰川和湖泊变化情况. 结果表明: 1960-2000年期间, 在气温上升、降水增加、最大可能蒸散降低的背景下, 研究区内不同地区湖泊的面积变化存在比较大的空间差异. 以冰川融水为主要补给的纳木错和色林错地区的主要湖泊以扩大为主, 而以降水为主要补给的黄河源地区的主要湖泊则基本上全面萎缩. 研究区的冰川在1960-2000年期间以退缩为主, 但各地退缩的幅度有较大的差异.
Study on the fluctuations of typical glaciers and lakes in the Tibetan Plateau using remote sensing [J].https://doi.org/10.3969/j.issn.1000-0240.2005.06.001 URL [本文引用: 1] 摘要
青藏高原冰川和湖泊变化是气候变化敏感的指示器, 利用地形图、航空照片、 TM卫星遥感资料和其它相关研究文献资料, 分析了青藏高原典型地区的冰川和湖泊变化情况. 结果表明: 1960-2000年期间, 在气温上升、降水增加、最大可能蒸散降低的背景下, 研究区内不同地区湖泊的面积变化存在比较大的空间差异. 以冰川融水为主要补给的纳木错和色林错地区的主要湖泊以扩大为主, 而以降水为主要补给的黄河源地区的主要湖泊则基本上全面萎缩. 研究区的冰川在1960-2000年期间以退缩为主, 但各地退缩的幅度有较大的差异.
|
| [41] |
Spatial-temporal variations of lake ice phenology in the Hoh Xil region from 2000 to 2011 [J].https://doi.org/10.1007/s11442-016-1255-6 URL Magsci [本文引用: 1] 摘要
<p>Lake ice phenology, i.e. the timing of freeze-up and break-up and the duration of the ice cover, is regarded as an important indicator of changes in regional climate. Based on the boundary data of lakes, some moderate-high resolution remote sensing datasets including MODIS and Landsat TM/ETM+ images and the meteorological data, the spatial-temporal variations of lake ice phenology in the Hoh Xil region during the period 2000-2011 were analyzed by using RS and GIS technology. And the factors affecting the lake ice phenology were also identified. Some conclusions can be drawn as follows. (1) The time of freeze-up start (FUS) and freeze-up end (FUE) of lake ice appeared in the late October-early November, mid-November - early December, respectively. The duration of lake ice freeze-up was about half a month. The time of break-up start (BUS) and break-up end (BUE) of lake ice were relatively dispersed, and appeared in the early February - early June, early May - early June, respectively. The average ice duration (ID) and the complete ice duration (CID) of lakes were 196 days and 181 days, respectively. (2) The phenology of lake ice in the Hoh Xil region changed dramatically in the last 10 years. Specifically, the FUS and FUE time of lake ice showed an increasingly delaying trend. In contrast, the BUS and BUE time of lake ice presented an advance. This led to the reduction of the ID and CID of lake. The average rates of ID and CID were -2.21 d/a and -1.91 d/a, respectively. (3) The variations of phenology and evolution of lake ice were a result of local and climatic factors. The temperature, lake area, salinity and shape of the shoreline were the main factors affecting the phenology of lake ice. However, the other factors such as the thermal capacity and the geological structure of lake should not be ignored as well. (4) The spatial process of lake ice freeze-up was contrary to its break-up process. The type of lake ice extending from one side of lakeshore to the opposite side was the most in the Hoh Xil region.</p>
|
| [42] |
Water balance estimates of ten greatest lakes in China using ICESat and Landsat data [J].https://doi.org/10.1007/s11434-013-5818-y URL [本文引用: 1] 摘要
Lake level and area variations are sensitive to regional climate changes and can be used to indirectly estimate water balances of lakes.In this study,10 of the largest lakes in China,~1000 km2or larger,are examined to determine changes in lake level and area derived respectively from ICESat and Landsat data recorded between 2003 and 2009.The time series of lake level and area of Selin Co,Nam Co,and Qinghai Lake in the Tibetan Plateau(TP)and Xingkai Lake in northeastern China exhibit an increasing trend,with Selin Co showing the fastest rise in lake level(0.69 m/a),area(32.59 km2/a),and volume(1.25 km3/a)among the 10examined lakes.Bosten and Hulun lakes in the arid and semiarid region of northern China show a decline in both lake level and area,with Bosten Lake showing the largest decrease in lake level(0.43 m/a)and Hulun Lake showing the largest area shrinkage(35.56 km2/a).However,Dongting,Poyang,Taihu,and Hongze lakes in the mid鈥搇ower reaches of the Yangtze River basin present seasonal variability without any apparent tendencies.The lake level and area show strong correlations for Selin Co,Nam Co,Qinghai,Poyang,Hulun,and Bosten lakes(R20.80)and for Taihu,Hongze,and Xingkai lakes(~0.70)and weak correlation for East Dongting Lake(0.37).The lake level changes and water volume changes are in very good agreement for all lakes(R20.98).Water balances of the 10 lakes are derived on the basis of both lake level and area changes,with Selin Co,Nam Co,Qinghai,and Xingkai lakes showing positive water budgets of 9.08,4.07,2.88,and 1.09 km3,respectively.Bosten and Hulun lakes show negative budgets of 3.01 and 4.73 km3,respectively,and the four lakes along the Yangtze River show no obvious variations.Possible explanations for the lake level and area changes in these four lakes are also discussed.This study suggests that satellite remote sensing could serve as a fast and effective tool for estimating lake water balance.
|
| [4] |
基于HJ-CCD和MODIS的吉林省中西部湖泊透明度反演对比 [J].https://doi.org/10.18307/2016.0323 URL [本文引用: 1] 摘要
水体透明度能够反映光在水体中的穿透程度,影响水生植被及以光为依赖条件的水生生物的分布,获取透明度的传统方法是采用透明度盘进行测量,但也可以通过遥感方法获得.环境减灾卫星是专门用于环境与灾害监测预报的小卫星星座,影像覆盖范围广,空间、时相分辨率较高,可以为水环境遥感提供较好的数据源.MODIS数据在近岸水体和内陆大型湖泊水环境监测中也有广泛应用,它的时相分辨率也很高,但空间分辨率低.利用HJ-1A卫星CCD数据和MODIS日反射率产品(MOD09GA),以2012年9月吉林省石头口门水库、二龙湖、查干湖、月亮泡等地的实测透明度为基础(实测点数74个,最小值为0.134 m,最大值为1.410 m,平均值为0.488 m),根据灰色关联度选取构建模型的波段组合,建立水体透明度反演模型.HJ1A-CCD数据与MOD09GA数据建立的模型R2分别为0.639和0.894,均方根误差(RMSE)分别为0.248和0.135,模型验证的平均相对误差(MRE)分别为17.1%和9.5%,RMSE分别为0.207和0.089.MODIS数据以其较高的辐射分辨率使模型精度较高,但是HJ数据在应用于透明度小于1 m的水体时精度也较高(MRE=13.5%,RMSE=0.066).HJ-CCD数据在空间分辨率上的优势使其能够获得透明度空间分布的细节信息.比较两者反演得到的湖泊平均透明度,结果较为一致.
Comparison of water transparency retrieving of lakes in the mid-east part of Jilin Province based on HJ-CCD and MODIS imagery [J].https://doi.org/10.18307/2016.0323 URL [本文引用: 1] 摘要
水体透明度能够反映光在水体中的穿透程度,影响水生植被及以光为依赖条件的水生生物的分布,获取透明度的传统方法是采用透明度盘进行测量,但也可以通过遥感方法获得.环境减灾卫星是专门用于环境与灾害监测预报的小卫星星座,影像覆盖范围广,空间、时相分辨率较高,可以为水环境遥感提供较好的数据源.MODIS数据在近岸水体和内陆大型湖泊水环境监测中也有广泛应用,它的时相分辨率也很高,但空间分辨率低.利用HJ-1A卫星CCD数据和MODIS日反射率产品(MOD09GA),以2012年9月吉林省石头口门水库、二龙湖、查干湖、月亮泡等地的实测透明度为基础(实测点数74个,最小值为0.134 m,最大值为1.410 m,平均值为0.488 m),根据灰色关联度选取构建模型的波段组合,建立水体透明度反演模型.HJ1A-CCD数据与MOD09GA数据建立的模型R2分别为0.639和0.894,均方根误差(RMSE)分别为0.248和0.135,模型验证的平均相对误差(MRE)分别为17.1%和9.5%,RMSE分别为0.207和0.089.MODIS数据以其较高的辐射分辨率使模型精度较高,但是HJ数据在应用于透明度小于1 m的水体时精度也较高(MRE=13.5%,RMSE=0.066).HJ-CCD数据在空间分辨率上的优势使其能够获得透明度空间分布的细节信息.比较两者反演得到的湖泊平均透明度,结果较为一致.
|
| [5] |
湖泊水色遥感研究进展 [J].https://doi.org/10.18307/2009.0201 URL [本文引用: 1] 摘要
从卫星传感器、大气校正、光学特性测量、生物光学模型及水体辐射传输、水质参数反演方法等方面,系统分析了湖泊水色遥感的发展现状.湖泊水体物质组份的复杂性以及卫星传感器与实际需求的矛盾决定了湖泊水色遥感的难度.目前湖泊水色遥感在一些关键问题上仍没有实质性进步,离水色遥感监测的业务化尚有一段距离.令人欣慰的是,卫星传感器以及水色遥感反演算法的不断发展和进步,让我们看到了胜利的曙光.
Progress in lake water color remote sensing [J].https://doi.org/10.18307/2009.0201 URL [本文引用: 1] 摘要
从卫星传感器、大气校正、光学特性测量、生物光学模型及水体辐射传输、水质参数反演方法等方面,系统分析了湖泊水色遥感的发展现状.湖泊水体物质组份的复杂性以及卫星传感器与实际需求的矛盾决定了湖泊水色遥感的难度.目前湖泊水色遥感在一些关键问题上仍没有实质性进步,离水色遥感监测的业务化尚有一段距离.令人欣慰的是,卫星传感器以及水色遥感反演算法的不断发展和进步,让我们看到了胜利的曙光.
|
| [43] |
Estimating surface temperature changes of lakes in the Tibetan Plateau using MODIS LST data [J].https://doi.org/10.1002/2014JD021615 URL [本文引用: 1] 摘要
Temperature changes over the Tibetan Plateau (TP) exhibit a dependence on altitude, as observed from meteorological station data and Moderate Resolution Imaging Spectroradiometer (MODIS) land surface temperature (LST) data. However, little is known about the changes in water surface temperature (WST) of lakes in the TP under the warming climate conditions over the past few decades. In this study, lake WST was examined using a MODIS/Terra 8 day LST (nighttime) product (MOD11A2) over the period 2001–2012. It was found that 52 lakes included in the analysis of WST exhibited an average rate of change of 0.01265±650.033°C/yr. Of these 52 lakes, 31 lakes (60%) displayed a temperature increase with a mean warming rate of 0.05565±650.033°C/yr and 21 lakes (40%) displayed a temperature decrease with a mean cooling rate of 610.05365±650.038°C/yr. The rates of change in WST for 13 lakes were statistically significant, and these included nine warming and four cooling lakes. Of the 17 lakes with nearby weather stations, nine lakes (53%) showed faster warming than nearby air/land. The warming lakes could be attributed to locally rising air and land surface temperatures as well as other factors such as the decreased lake ice cover. The cooling lakes were mostly located at high elevations (>420065m), and the trend could have been due to increased cold water discharge to the lakes from accelerated glacier/snow melts. Therefore, both warming and cooling lake temperatures in the TP were possibly the result of increased air temperatures (0.03665±650.027°C/yr) under global warming conditions.
|
| [44] |
Lakes’ state and abundance across the tibetan plateau [J].https://doi.org/10.1007/s11434-014-0258-x URL [本文引用: 1] |
| [6] |
云南抚仙湖透明度的时空变化及影响因子分析 [J].https://doi.org/10.3321/j.issn:1003-5427.2008.05.019 URL [本文引用: 1] 摘要
根据2005年的综合调查资料和1980年以来的常规监测资料,分析了云南高原深水湖泊抚仙湖透明度的空间分布、年际变化及影响因子.2005年6-7月抚仙湖水体透明度范围为0.5-6.2m,平均值为4.6m,透明度分布的总体格局是:南区>北区,湖心区>沿岸区,河口区较低.藻类和悬浮物是影响透明度空间分布的主要因子,随着水体中藻类和悬浮物的增加,透明度下降.近20多年来,抚仙湖透明度呈下降趋势,藻类增加是直接影响因子,水体总氮、总磷的增加促进了藻类的增殖,是重要的间接影响因子.
Spatial-temporal dynamic changes of the water transparency and their influencing factors in Lake Fuxian, Yunnan Province [J].https://doi.org/10.3321/j.issn:1003-5427.2008.05.019 URL [本文引用: 1] 摘要
根据2005年的综合调查资料和1980年以来的常规监测资料,分析了云南高原深水湖泊抚仙湖透明度的空间分布、年际变化及影响因子.2005年6-7月抚仙湖水体透明度范围为0.5-6.2m,平均值为4.6m,透明度分布的总体格局是:南区>北区,湖心区>沿岸区,河口区较低.藻类和悬浮物是影响透明度空间分布的主要因子,随着水体中藻类和悬浮物的增加,透明度下降.近20多年来,抚仙湖透明度呈下降趋势,藻类增加是直接影响因子,水体总氮、总磷的增加促进了藻类的增殖,是重要的间接影响因子.
|
| [45] |
Estimation of water clarity in Taihu Lake and surrounding rivers using Landsat imagery [J].https://doi.org/10.1016/j.advwatres.2010.08.010 URL Magsci [本文引用: 1] 摘要
In China, the increase in exogenous-source pollutants from rivers is one of the most important causes of lake eutrophication. The application of remote sensing technology to water quality monitoring of rivers connected to these lakes has special significance for lake management at regional scales. Many research studies have estimated water clarity using Landsat imagery. However, most of this work focused on lakes or reservoirs, for which abundant water-only pixels (i.e., pure pixels of water, PPW) were available. Few of these studies have addressed rivers, especially rivers with an average width less than 100 m. In our study, we sought to determine whether water clarity in the rivers connected to Taihu Lake could be estimated using Landsat imagery. We obtained 18 Enhanced Thematic Mapper Plus (ETM+) images from 2009 for 13 rivers ranging from an average of 37.3 to 173.6 m wide. Three field campaigns conducted in May 2009, September 2009, and January 2010 were used to obtain field measurements of Secchi disk depth (SDD). Our results suggested that the widely used model, a(TM1/TM3) + b(TM1)+ c, was suitable for the estimation of SDD for Taihu Lake. The brightness of the panchromatic band of ETM+ showed significant correlations with TM1, TM3 and TM1/TM3 (p < 0.001). As a result, SDD in the lake could also be estimated using the Landsat panchromatic band. The multispectral image of ETM+ did not provide adequate PPW for estimation of water clarity in rivers. However, PPW derived from the panchromatic image captured about 93% of the variation in SOD, on average, for the every worst-case scenario in the 13 rivers. Using the PPW in rivers, a significant correlation was found between the brightness of the panchromatic image and SDD (R(2) = 0.64, p < 0.001). Our results demonstrate that the panchromatic image of Landsat, but not the multispectral image, can be used to estimate water clarity in rivers with an average width greater than 40 m in the Taihu basin. (C) 2010 Elsevier Ltd. All rights reserved.
|
| [46] |
Quantitative analysis of lake area variations and the influence factors from 1971 to 2004 in the Nam Co basin of the Tibetan Plateau [J].https://doi.org/10.1007/s11434-010-0015-8 URL Magsci [本文引用: 1] |
| [7] |
西藏当惹雍错和扎日南木错现代湖泊基本特征 [J].https://doi.org/10.18307/2010.0422 URL [本文引用: 1] 摘要
湖泊现代特征的调查和对比研究是湖泊学和古湖泊学研究工作的基础,青藏高原大部分湖泊目前仍缺少详细的基本特征考察资料.基于2009年9月实地考察,本文报道藏北高原腹地的两个内陆封闭大湖——扎日南木错和当惹雍错的水深分布和现代湖水基本特征.测深结果显示扎日南木错大部分湖区水下地形较为平坦,最大水深为71.55m;当惹雍错实测最大水深为214.48m,是青藏高原上已知最深的湖泊,也是我国已知的第二深水湖.湖水理化性质显示在垂直方向上两湖都呈现明显的分层结构,温跃层的温度梯度分别为1.1℃/m和0.57℃/m,当惹雍错底层水温最低仅为1.6℃;两湖表水层的电导率分别高达18500μS/cm和12900μS/cm;两湖表水层pH都超过10,而底层水的pH都降低到5左右,上下层湖水显示了不同的酸碱性质.湖水电导率和溶解氧在温跃层都具有同步跃变特征,反映了温度对湖水性质的影响.
Modern limnological features of Tangra Yumco and Zhari Namco, Tibetan Plateau [J].https://doi.org/10.18307/2010.0422 URL [本文引用: 1] 摘要
湖泊现代特征的调查和对比研究是湖泊学和古湖泊学研究工作的基础,青藏高原大部分湖泊目前仍缺少详细的基本特征考察资料.基于2009年9月实地考察,本文报道藏北高原腹地的两个内陆封闭大湖——扎日南木错和当惹雍错的水深分布和现代湖水基本特征.测深结果显示扎日南木错大部分湖区水下地形较为平坦,最大水深为71.55m;当惹雍错实测最大水深为214.48m,是青藏高原上已知最深的湖泊,也是我国已知的第二深水湖.湖水理化性质显示在垂直方向上两湖都呈现明显的分层结构,温跃层的温度梯度分别为1.1℃/m和0.57℃/m,当惹雍错底层水温最低仅为1.6℃;两湖表水层的电导率分别高达18500μS/cm和12900μS/cm;两湖表水层pH都超过10,而底层水的pH都降低到5左右,上下层湖水显示了不同的酸碱性质.湖水电导率和溶解氧在温跃层都具有同步跃变特征,反映了温度对湖水性质的影响.
|
| [8] |
“第三极环境(TPE)”国际计划: 应对区域未来环境生态重大挑战问题的国际计划 [J].TPE international program: A program for coping with major future environmental challenges of The Third Pole region [J]. |
| [9] |
乌梁素海水体透明度分布及影响因子相关分析 [J].https://doi.org/10.18307/2009.0619 URL [本文引用: 1] 摘要
根据2006—2008年间5—10月对乌梁素海的连续监测资料,分析了乌梁素海水体透明度的时空分布状况和季节变化规律,对影响透明度的5个理化因子,包括浊度、悬浮物、叶绿素a、氮磷比和pH值进行相关分析.三年内有监测资料的月份中,乌梁素海水体透明度变化范围在0.33—1.62m,平均值为0.93m,透明度分布的总体趋势是芦苇区及靠近芦苇区较低,西南端开阔水面区较高.从相关分析结果来看,浊度是乌梁素海水体透明度的主要影响因素,其与透明度的关系是SD=1.489x-0.471(R=0.83,N=100,P〈0.0001);悬浮物是乌梁素海水体透明度的直接影响者,与透明度的关系是S1/4=-3.9481nSD+12.055(R=0.65,N=100,P〈0.0001);pH值和N/P对透明度的影响是间接的.
Spatial-temporal changes in water transparency and its impact factors in Lake Wuliangsuhai [J].https://doi.org/10.18307/2009.0619 URL [本文引用: 1] 摘要
根据2006—2008年间5—10月对乌梁素海的连续监测资料,分析了乌梁素海水体透明度的时空分布状况和季节变化规律,对影响透明度的5个理化因子,包括浊度、悬浮物、叶绿素a、氮磷比和pH值进行相关分析.三年内有监测资料的月份中,乌梁素海水体透明度变化范围在0.33—1.62m,平均值为0.93m,透明度分布的总体趋势是芦苇区及靠近芦苇区较低,西南端开阔水面区较高.从相关分析结果来看,浊度是乌梁素海水体透明度的主要影响因素,其与透明度的关系是SD=1.489x-0.471(R=0.83,N=100,P〈0.0001);悬浮物是乌梁素海水体透明度的直接影响者,与透明度的关系是S1/4=-3.9481nSD+12.055(R=0.65,N=100,P〈0.0001);pH值和N/P对透明度的影响是间接的.
|
| [10] |
太湖水体透明度的分析、变化及相关分析 [J].https://doi.org/10.3969/j.issn.1003-6482.2003.02.005 URL [本文引用: 1] 摘要
本文根据1993-2001年太湖站常规监测资料及2001-2002年周年实验资料,分析研究了太湖水体透明度的分布特征、季节变化,重点分析了透明度与光学衰减系数、悬浮物及叶绿素a的相互关系,阐述了影响透明度的主要因子.研究表明:太湖透明度的区域分布为湖心区最低,其次是河口区,东太湖最高;季节变化表现为全湖平均透明度夏秋季大、冬春季小,不同湖区变化不尽相同;光学衰减系数与透明度的关系为:Kd=0.096+(1.852)/(ST);悬浮质与透明度的关系为:S1/4=8.103-5.847 ln ST;对透明度主要影响因子进行分析,发现太湖透明度主要受悬浮物的影响,透明度跟叶绿素的相关性不是很大,只存在微弱的线性相关.
Distribution, seasonal variation and correlation analysis of the transparency in Taihu Lake [J].https://doi.org/10.3969/j.issn.1003-6482.2003.02.005 URL [本文引用: 1] 摘要
本文根据1993-2001年太湖站常规监测资料及2001-2002年周年实验资料,分析研究了太湖水体透明度的分布特征、季节变化,重点分析了透明度与光学衰减系数、悬浮物及叶绿素a的相互关系,阐述了影响透明度的主要因子.研究表明:太湖透明度的区域分布为湖心区最低,其次是河口区,东太湖最高;季节变化表现为全湖平均透明度夏秋季大、冬春季小,不同湖区变化不尽相同;光学衰减系数与透明度的关系为:Kd=0.096+(1.852)/(ST);悬浮质与透明度的关系为:S1/4=8.103-5.847 ln ST;对透明度主要影响因子进行分析,发现太湖透明度主要受悬浮物的影响,透明度跟叶绿素的相关性不是很大,只存在微弱的线性相关.
|
| [11] |
|
| [12] |
Long-term dreissenid impacts on water clarity in Lake Erie [J].https://doi.org/10.1016/S0380-1330(04)70371-8 URL [本文引用: 1] 摘要
Since shortly after their introduction, dreissenid mussels have been thought to have improved water clarity in Lake Erie, particularly in the western basin. However, long-term monitoring (1982鈥2004) has found no evidence of persistent, basin-wide increases in water clarity in either the western or the central basin of Lake Erie since the Dreissena invasion. In fact, spring water clarity in both of those basins has exhibited statistically significant declines in the post-dreissenid period. In contrast, chlorophyll a levels in the western basin have declined by about 50% since the Dreissena invasion during both spring and summer. The discrepancy in the responses of water clarity and chlorophyll a is probably a consequence of both the large sediment loads entering the western basin and resuspension of unassimilated non-algal particulates. In the eastern basin, spring transparency has increased substantially and turbidity has decreased since Dreissena colonization, in spite of the much greater depth of this basin. This is probably due to higher mussel densities and the lack of major sources of turbidity in that basin. Summer turbidity has also decreased markedly in the eastern basin, although thermal stratification during this period would probably preclude direct filtration effects. Instead, we hypothesize that reductions in whiting events due to calcium uptake by dreissenids have contributed to the summer decreases in turbidity seen in the eastern basin.
|
| [13] |
Long term water clarity changes in North America's Great Lakes from multi-sensor satellite observations [J].https://doi.org/10.1002/lno.10146 URL 摘要
Abstract Water clarity in North America's Laurentian Great Lakes has undergone considerable change over the last several decades as a consequence of invasive species, eutrophication, and implemented nutrient management practices. Satellite observations from the CZCS, SeaWiFS, and MODIS-Aqua sensors have been used in tandem with long term records of Secchi disk depth ( Z SD) to provide a retrospective analysis of spatial and temporal variations in water clarity over the Great Lakes. A simple empirical algorithm is presented, relating Z SD to remote-sensing reflectance at 鈭 550 nm ( R rs鈭550). Results suggest remarkable and complex changes in water clarity over the Great Lakes. Lakes Ontario, Huron, and Michigan have seen increases in average Z SD over the three sensor periods of 58%, 49%, and 62%, respectively. Lake Erie shows highly variable Z SD with no consistent long term trends, while Lake Superior has remained fairly consistent in its lake-wide water clarity conditions. Temporal trends document the decrease in whiting events on Lake Michigan while capturing the ongoing occurrence of these seasonal bright-water events on Lake Ontario. Results indicate a divergence in Z SD trends between nearshore and offshore environments; with larger increases in offshore than nearshore Z SD and some nearshore areas suggesting a decrease in Z SD. Offshore regions of Lakes Huron, Michigan, and Superior show diminished Z SD seasonality in contrast to increasing seasonal variance in the nearshore. Spatial and temporal variations in Z SD are in agreement with documented reductions in Great Lakes bioproductivity, degrading nearshore water quality, and changing biogeochemical processes influencing whiting events and sediment resuspension.
|
| [14] |
A landsat-based evaluation of lake water clarity in Maine lakes [J].https://doi.org/10.1080/02723646.2014.909716 URL 摘要
Temporal trends in water clarity and land-use/land-cover (LULC), as well as the relationship between changes in water clarity and LULC, were analyzed using water clarity values extracted from Landsat images from 1986 to 2008, acquired for east-central Maine. Of 40 lakes identified using satellite imagery, our analysis found one lake with a significant decrease in water clarity. In a second data-set, with 99 lakes, we identified two lakes with a significant increase in water clarity. Analyses of the relationship between temporal changes in the water clarity and LULC did not identify any clear, consistent, relationships between changes in the water quality variables and LULC. Overall, the results of this study aid in the identification of the relationship between water clarity and LULC, and identify temporal changes in water clarity. The findings of this study support the previous research that demonstrates the ability of satellite imagery to be used in assessments of water clarity, thus enabling evaluation at broader spatial scales and longer temporal scales than assessments that rely solely on ground-based data.
|
| [15] |
The effect of vertical mixing on primary production in a bay of the gulf of California [J].https://doi.org/10.1006/ecss.1996.0167 URL [本文引用: 1] 摘要
Short-term variability of primary production was studied during Summer 1986 in Bahia de Los Angeles, Mexico. An 8-day time series of temperature, salinity, nutrients and chlorophyll awas performed. Simultaneously, primary productivity was measured using theC method. The water column was stratified during the first 3 days, and mixed when the wind speed was up to 10 m s. Wind stress played a major role in producing vertical mixing and forcing surface circulation in the Bay. Higher chlorophyll avalues (>3 mg m) were recorded at 10 m depth during the first 3 days, and were 2-3-fold greater than those measured on the following days. The inverse relationship between the integrated phytoplankton biomass and the calculated euphotic depth (Z) suggests that light penetration in the water column was mainly controlled by the phytoplankton biomass. The photosynthetic assimilation ratio (P) ranged from 3路7 mgC (mg chla)h, measured during stratification of the water column, to 9路3 mgC (mg chla)h, measured with water-mixed conditions.Pvariability was a result of the combined effect of vertical mixing in the water column and the increased light availability. Short-term integrated primary production ranged from 26 to 62 mgC mh, and its temporal variability was associated with phytoplankton biomass and the light availability. The averaged daily integrated production was related to nitrate concentrations in the water column. These results suggest that limitation of primary production from both light and nutrients occurred simultaneously in Bahia de Los Angeles during Summer 1986.
|
| [16] |
Remote-sensing assessment of regional inland lake water clarity in northeast China [J].https://doi.org/10.1007/s10201-009-0263-y URL [本文引用: 1] 摘要
Water clarity in three lakes, Chagan, Xinmiao, and Kuli, in northeast China was evaluated based on Landsat TM data and in situ measurements in this study. The agreement between satellite data and water clarity from field-collected Secchi disk depth (SDD) for individual lakes was strong (0.7202≤02 R 2 02≤020.98), and four regression equations were used to estimate SDD values. Lake clarity showed strong geographic patterns: Lake Chagan had low clarity and Lake Xinmiao and Kuli had high clarity. The study indicates that Landsat TM can be effectively applied to estimate water clarity for inland lakes in the area.
|
| [17] |
Effects of lake size, water clarity, and climatic variability on mixing depths in Canadian Shield lakes [J].https://doi.org/10.4319/lo.1996.41.5.0912 URL [本文引用: 1] 摘要
The depth of the summer mixed layer (E
|
| [18] |
Semi-analytical prediction of Secchi depth using remote-sensing reflectance for lakes with a wide range of turbidity [J].https://doi.org/10.1007/s10750-015-2584-7 URL [本文引用: 2] 摘要
Abstract It is crucial to monitor light environments in large lakes using satellite remote-sensing data. Many studies have proposed prediction schemes of transparency information, but most of them were site-specific. Here, we applied semi-analytical retrieval procedures of inherent optical properties from in situ-measured remote-sensing reflectance and then predicted the Secchi depth (SD) using contrast transmittance theory. Two types of water regions (clear or turbid waterbodies) were first classified based on spectral characteristics, and a selection from two retrieval procedures for clear and turbid water bodies was made. The relationship between the SD and the sum of attenuation coefficients (beam and diffuse attenuation coefficients), which arises in contrast transmittance theory, was determined by analyzing the data from the previous research. The predicted SD values were compared with the observed values in 10 Japanese lakes with a wide variety of turbidity (SD 0.4鈥17 m). Fairly good agreement between the predicted and observed SD values was obtained, indicating the usefulness of this prediction scheme. We then made an accuracy comparison with the results obtained by previous studies, and we discuss the coefficients and the discrepancies between the measured and predicted SD values in addition to the future directions of this approach.
|

/
| 〈 |
|
〉 |
