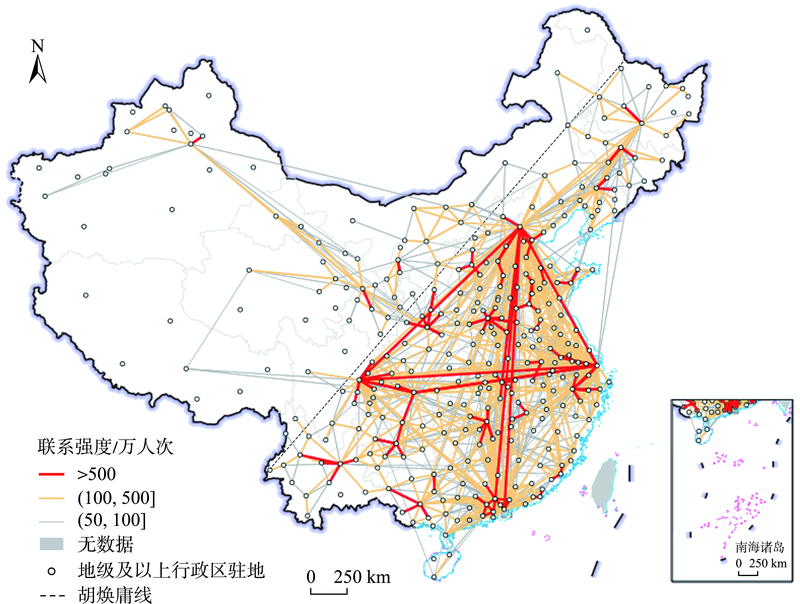
Spatial interaction of human mobility is a heated topic for scholars, but little is known about the nonlinear relationship of the influencing factors in the spatial interaction. Using Tencent migration data in 2018 and employing the gradient boosting decision tree (GBDT) model, this study analyzed the nonlinear characteristics of the distance-decay parameter. The results show that: 1) In the annual data benchmark model the distance-decay parameter presents nonlinear characteristics; the partial dependence curve presents two "platform areas" where the distance-decay parameter is close to 0, and two "attenuation areas" where the distance-decay parameter is about 2.8; and the results are still robust using road-based distance or data from other years. 2) There are significant differences between the distance-decay parameters of aviation, railway, and road transportation. The distance-decay pattern during the Spring Festival is basically consistent with the annual benchmark model. We recommend to plan metropolitan areas and urban agglomerations according to the nonlinear characteristics of intercity connection influenced by distances-decay pattern, and optimize the layout of territorial development accordingly.
Cities are the main spatial carriers for the agglomeration of regional population, industry and other factors, and systematically revealing the evolution of urban construction land structure and its driving mechanism is of great significance for further promoting the implementation of ecological conservation and high-quality development strategy of the Yellow River Basin. Based on the urban construction land data of the Yellow River Basin from 2007 to 2019, the spatiotemporal change characteristics and differentiation patterns of the construction land structure in the basin were analyzed by using the information entropy model, and the formation mechanism of the driving factors was examined by using the random forest model. The results show that: 1) From 2007 to 2019, the area of urban construction land in the Yellow River Basin continued to grow, with an average annual growth rate of 5.34%, but the information entropy of urban construction land structure decreased, and experienced a change process of high-level disorder, relatively stable, and low-level orderly. 2) The growth rate of urban construction land use in the upper, middle, and lower reaches of the Yellow River increased successively, with the annual growth rate reaching 3.91%, 5.06% and 6.22% respectively. The information entropy of urban construction land use structure in the middle reaches of the Yellow River decreased the most, and the decline rates in the upper reaches and lower reaches were similar. 3) All types of construction land in the basin are mainly distributed in provincial capitals and cities in economically developed areas, and there is a clear spatial heterogeneity in the information entropy of urban construction land use structure in the region. The information entropy of urban construction land use structure in provincial capital cities and economically developed cities showed a decreasing trend, while the information entropy of less developed cities gradually increased. 4) The scale of urban land use and the size of urban population have the strongest effect on the change of urban construction land use structure, followed by the intensity of industrial structure upgrading and scale of fiscal expenditure. The role of economic development level and policy support is small, and the intensity of impact of upstream, middle reaches, and downstream influencing factors is heterogeneous. 5) The scale of urban land use, the size of urban population, and the scale of fiscal expenditure showed a positive change relationship with the information entropy of urban construction land use structure, the level of economic development and industrial structure upgrading showed a negative change relationship with the information entropy of urban construction land use structure, and the policy support showed an inverted U-shaped change relationship with the information entropy of urban construction land use structure.
In order to reveal the differences in the spatial pattern of housing prices among different buyers in China's megacities, this study divided the household registration of housing buyers from Changsha City into two categories and depicted the spatial and temporal evolution of housing price patterns for these two groups of buyers respectively. A spatiotemporal auto regression model (STAR) was employed to analyze the influence of location, landscape, neighborhood, and other factors on the housing prices. We found that: 1) The housing price gradient of Changsha's non-registered household buyers has fallen faster than others while their space is more smooth. 2) The overall pattern of Changsha housing price space with "one river, two banks, and two centers" has gradually emerged. The influence of traditional central business district (CBD)—the Wuyi Square—on housing prices is declining, but it maintains a high level of housing price gradient and price elasticity for the locals. The sub-center Meixi Lake New City has a greater impact on the housing prices for outside buyer. 3) Outside buyers have a higher propensity to pay for housing quality and neighboring facilities. 4) In the period of prosperity and regulation of the housing market, the transaction prices of surrounding housing projects have different effects on the two types of housing buyers. This study explored the causes of the spatial differentiation of housing prices between the two types of buyers from four aspects: Functional requirements, subjective factors, differences of policy, and economic motivations. In the context of "housing for living not for speculation", paying attention to the spatial structure of housing price of different groups of people and the changing trends of influencing factors will help to develop a deeper understanding of the housing regulation policy in megacities.
With the rapid development of cities and the improvement of citizens' environmental awareness in China, tensions and conflicts caused by "Not In My Backyard" (NIMBY) facilities have increased. How to plan NIMBY facilities properly has become an essential issue for promoting environmental justice and social harmony. We obtained the geographic data of the NIMBY facilities in the main urban area of Guangzhou City from the Planning Cloud Platform. Using Python coding, we also collected housing price data from major real-estate brokerage companies. Kriging interpolation was used to analyze the spatial distribution characteristics of the NIMBY facilities. We used both ordinary least squares regression and geographically weighted regression to investigate the relationship between the locations of NIMBY facilities and housing prices in their surrounding areas. Results show that the distribution of NIMBY facilities in the main urban area of Guangzhou is spatially consistent with the distribution of low-income neighborhoods. The NIMBY facilities are mainly distributed around neighborhoods with lower housing prices. The impact of NIMBY facilities on the housing prices of surrounding neighborhoods is related to the type and location of NIMBY facilities. The feature of NIMBY facilities in the urban peripheries negatively impact housing prices. In the core urban area, however, good location, infrastructure, and public services have, to some extent, canceled out the negative impacts of NIMBY facilities on housing prices. The impact of stigma related NIMBY facilities on housing prices is significantly lower than that of pollution, high safety risk, and psychological distress related NIMBY facilities. This study provides scientific guidelines for urban NIMBY planning.
Improving the efficiency of financial services for the real economy is the "target" that needs to be studied in the construction of the Hainan Free Trade Port. By measuring the efficiency of financial services for the real economy in 18 cities and counties of the Hainan Free Trade Port from 2011 to 2020, this study used the Dagum Gini coefficient and kernel density estimation to characterize the spatiotemporal heterogeneity of efficiency, examined its driving mechanism with the help of the random forest model, and revealed the spatiotemporal differentiation mechanism of the efficiency of financial services for the real economy in the Hainan Free Trade Port. The research results indicate that: 1) The efficiency of financial services for the real economy in the Hainan Free Trade Port showed obvious temporal and spatial imbalances, with significant phases in the time series. The spatial distribution of efficiency showed a pattern of high in the west and low in the east, high value clustering, and a "depression" in the central area. 2) The differentiation of the overall efficiency and efficiency in coastal cities and counties gradually strengthened, while the gap within the non-coastal cities and counties gradually narrowed. The spatial differentiation of the efficiency of financial services for the real economy in coastal regions was the main source of the overall differentiation. 3) Government intervention was the leading factor for efficiency differentiation. The influencing factors, including financial agglomeration, have a nonlinear influence on efficiency, the trends and thresholds of effects are different, and the marginal output capacity of each factor and the dynamic difference of the absorption and application capacity of the factors in various cities and counties are the main sources of spatiotemporal heterogeneity. The results provide some scientific basis for optimizing the spatial allocation of financial resources in the Hainan Free Trade Port and improving the efficiency of financial services for the real economy.
With the reform of China's urban housing system, relocation in cities is becoming increasingly more frequent. Analyzing the internal driving forces of residents of different age groups to move provides a basis for the improvement of urban living environment planning and construction. This study used multi-source data such as mobile phone signaling data in Wuhan City in 2019 and 2021 and took the life cycle perspective to identify the relocation frequency of residents of different age groups within the Fourth Ring Road of Wuhan City. This study proposed a model of relationship between the characteristics of built environment factors and the frequency of relocation, and explored the impact of various built environment factors in the residents' living circles on the relocation of residents of multiple ages. The study found that: 1) The moving in and out intensities of residents of different ages varied in different urban locations. Residents aged 19-39 moved more frequently than residents aged over 40. In general, the moving in and out intensity of the traffic areas within the inner ring road is high, and both are larger than those between the outer ring roads. 2) Relevant indicators in the dimensions of public service facilities, transportation convenience, and the living environment are important factors that caused residents' decision to move. Considering the differences in the relocation intensity of residents of different age groups and the characteristics of influencing factors, relevant planning decisions need to incorporate differentiated measures to improve the built environment, scientifically guide residents of different ages to relocate, and optimize urban population distribution.
The relationship between urban vitality and the built environment has always been a subject of intense research in urban geography and planning. Traditionally, global regression techniques have been mostly developed to analyze their quantitative relationship based on a linear consumption. However, the results from existing studies are rather mixed, indicating that their relationship may not be global. Therefore, it is necessary to explore the local characteristics of the associations between urban vitality and the built environment. Based on a collection of multi-source datasets including Baidu Heat Map data, building data, road network data, and point of interest data in central Guangzhou City—including Liwan, Yuexiu, Tianhe and Haizhu districts, this study applied the gradient boosting decision tree model to unveil the nonlinear associations of built environment characteristics (including intensity, function, and accessibility) with urban vitality and threshold effects. The differences in the impacts of the built environment between daytime and nighttime on weekdays have also been examined. The results show that: 1) During both the daytime and the nighttime, floor area ratio contributes the greatest to urban vitality, followed by the intensity of recreation and public transport facilities. Compared to diversity, reasonable development intensity, concentration of leisure and office facilities, and public transport oriented development have larger collective contributions to urban vitality. 2) Although differences exist between daytime and nighttime, all built environment variables have nonlinear associations with urban vitality. The threshold value and gradient of key built environment variables are recognized in the nonlinear shapes of associations. Urban planners and local governments are recommended to meticulously disentangle the complicated built environment associations to make informed and targeted interventions for fostering and maintaining urban vitality.
Daily activities of the elderly population are closely related to their physical and mental health, and are complicatedly affected by the attributes of multiple neighborhood destination built environments. However, current research has paid little attention to the activity opportunity characteristics of the elderly population and scope of the built environment centered on neighborhood destinations. Combined with the theory of homo-urbanicus, this study constructed a research framework on the relationship between neighborhood destinations and daily activity opportunities from the needs of the elderly for survival, contact, and social interaction. Taking the main urban area of Dalian City as an example, data on the perception and participation in daily activities were collected from 1149 older adults in 2017 and 2019. From the three dimensions of accessibility, attractiveness, and friendliness, built environment indicators were measured for the neighborhood destinations that the elderly have potential contact with, including commercial, medical, educational, and leisure facilities. We used the multiple linear regression and the multinomial logistic regression methods to analyze the impact of neighborhood destination built environments on older adults' daily activity opportunities. The main findings of the study are as follows: 1) The daily activity opportunities of the elderly can be divided into three categories: bystander type, target type, and active type. In addition to being severely constrained by individual attributes, these types also show heterogeneity in their spatial distributions. 2) Commercial facilities have a significant impact on activity perception, and leisure facilities have a significant impact on activity participation. Specifically, indicators such as the proportion of residential areas around community activity centers and the distance to shopping mall intersections have a greater impact on activity perception. The road network density around chess and card rooms and the proportion of cars around community activity centers have a greater impact on activity participation. 3) The environmental suitability of hospitals has an effect on the bystander elderly, and the spatial location of shopping malls has an effect on the active elderly. The research results show that in the optimization of the built environment of urban public service facilities, it is necessary not only to meet the needs of the elderly for the use of space, but also to meet their needs for rest and observation. In addition, urban planners should pay attention to the differences in the impact of different types of service facilities on daily activity opportunities of the elderly, and carry out targeted planning and policy interventions. This study provides new ideas for the refined construction of age-friendly cities.
The commercial homogenization of ancient town tourism destination is the main manifestation of the homogenization of this type of tourism destination. Although to some extent this phenomenon promotes the economic development of the tourism destination, it also affects the tourism experience of tourists and leads to the disorder of the commercial operation of the destination. Taking Dali ancient city as an example, this study obtained the street view image data inside the ancient city through programming, and used computer vision, machine learning, and other technologies to identify the shop sign text information in the street view images. On this basis, this study constructed an index model to measure the commercial homogeneity of the case, and examined the spatial characteristics and formation mechanism of the commercial homogenization of the ancient town tourism destination. The conclusions are as follows: 1) Spatially, the overall commercial homogeneity of Dali ancient city presents the characteristics of core-periphery distribution. The commercial homogenization degree of stores is high in the core tourism area, showing the characteristics of street-level distribution, while the commercial homogenization degree of service firms is high in the peripheral tourism area, showing the characteristics of city block-level distribution. 2) The distribution of tourism resources, planning and regulation, location conditions, and capital intervention are the main factors leading to commercial homogenization. Competition and spatial aggregation are the two leading mechanisms to form commercial homogenization. 3) Using computer vision and machine learning technologies to extract the shop sign text information in the street view images and taking the repetition number and agglomeration level of the same type of shops as indicators to build a model, combined with GIS spatial analysis method, we can realize the spatial measurement of the commercial homogeneity of the ancient town tourism destination.
Facility agricultural land (FAL) is an important spatial carrier of non-grain agricultural production. Under the current land use transition, the impact of regional arable and construction land scales on the scale of FAL and their spatial effects are unclear. Based on the data of the second (2008) and third (2018) national land surveys, this study used spatial autocorrelation analysis and land use transfer matrix to systematically analyze the spatial evolution characteristics of the FAL in Tai'an City and the key influencing factors, in an attempt to provide some theoretical support for the management of "non-grain" and "non-agricultural" transition of arable land and the spatial layout adjustment of FAL. The results show that: 1) During the decade between 2008 and 2018, the total area of FAL in Tai'an City was relatively stable, but the net change was dramatic, and arable land and construction land were the main sources and destinations for transferring FAL, respectively. 2) The FAL showed a spatial pattern of moving from the center of the counties/districts to the periphery, with an increasing trend of agglomeration in distant urban areas. 3) During the second national land survey period, the scale of arable land promoted the expansion of FAL, while during the third national land survey period, the scale of arable land inhibited the growth of FAL and the effect was more significant in townships far away from the county seats. 4) During both the second and the third national land surveys, construction land steadily promoted the expansion of facility agricultural land, and this effect was widespread in space.
Since the twenty-first century, small towns have become a key region of rapid urbanization in East Africa. In this study, the cities of two typical East African countries—Tanzania and Uganda—were classified and towns and small cities with less than 100000 people were identified as the research regions. Seven natural environment variables and six socioeconomic variables were selected and combined with urban data to construct a maximum entropy model. The average habitat suitability index (HSI) obtained from the model was used to discern the suitability of small town formation, classify the potential areas for development, and compare and analyze them with population density. It was found that: 1) Distance from regional major traffic arteries, distance from national major traffic arteries, normalized difference vegetation index (NDVI), and distance from large cities all have high contribution rates to town and small city development in the two countries; each country has its own high contribution variables specific to cities of different sizes. 2) As the size of cities increases, the contribution rate of traffic arteries decreases and the contribution rate of natural environment variables increases. 3) The HSI values in northern Tanzania are higher than those in the south overall. The towns in the high HSI area are clustered, and distribution of the small cities is in stripes. In Uganda, the HSI values are lower in the whole country, and the towns in the high HSI area are in a radial network distribution starting from Kampala, while the distribution of small cities is in a fragmented shape. The HSI high value areas in both countries are basically located near road networks and rivers and lakes. 4) Population density of Tanzania is generally lower than that of Uganda, while the total area of its potential development areas is larger than that of Uganda. The relationship between potential development areas and population density is divided into three main types: (1) larger than the surrounding area's population density, for areas with a long history, strong economic power, and close to large and medium-sized cities; (2) similar to the surrounding area's population density, for areas under rapid development; and (3) smaller than the surrounding area's population density, for areas with superior location conditions. These results fill the research gap of small towns in East Africa where information is scarce, and provide references for future urban construction in East African countries and investment cooperation between China and East Africa.
The spatiotemporal characteristics of Meiyu intensity index and different precipitation levels during the Meiyu period over the Yangtze-Huai River Basin are still unclear during recent 60 years under global climate change. This study used observed daily precipitation and temperature data from 239 meteorological stations over the Yangtze-Huai River basin from 1961 to 2020 combined with NCEP/NCAR reanalysis data to identify the Meiyu process and investigate the spatiotemporal characteristics of Meiyu intensity index, the number of rainy days, precipitation amount, precipitation incidence rate, and precipitation contribution rate of different precipitation levels during the Meiyu period, and calculate the contribution rate of urbanization to heavy precipitation indices during the Meiyu period. It aimed to provide references for early warning of rainstorm and flood events, flood and drought disaster prevention, and water resources regulation in the Yangtze-Huai River Basin during the Meiyu Period. The research results show that: The average Meiyu onset date and ending date were the earliest in area I (Jiangnan area), followed by area II (middle and lower reaches of the Yangtze River) and area III (Jianghuai area), and the length of the Meiyu period was 30 days, 30 days, and 24 days respectively. There was no obvious trend for onset date, ending date, and length of the Meiyu period. The average Meiyu rain intensity in area I was the highest, at 367.6 mm, followed by area II at 298.4 mm and area III at 253.5 mm; the Meiyu rain intensity index in area II showed a significant increasing trend in recent 60 years, and the average Meiyu intensity index was the highest in area Ⅱ. Violent Meiyu are most likely to occur in area II, and the inter-annual variation of the Meiyu intensity index was the largest in area III. Meiyu precipitation amount in the central part of areas Ⅰ and Ⅱ was relatively high, with the highest number of rainy days in area Ⅰ, followed by area Ⅱ and the lowest was found in area Ⅲ. During the Meiyu period, the number of light rain days was the largest and the incidence of precipitation was the highest, while the corresponding indices of moderate rain, heavy rain, and rainstorm decreased in turn. The trend of light rain days and moderate rain days was not obvious for most stations, but the number of heavy rain days and rainstorm days in the central and eastern parts of area II increased significantly. The trend of the incidence of heavy rain and rainstorm was not obvious for most stations, but the incidence of light rain and moderate rain for many sites in area II decreased significantly, which is the reason for the significant decrease of the incidence of precipitation during the Meiyu period in eastern area Ⅱ. Rainstorm amount accounted for the largest proportion of precipitation during the Meiyu period, the contribution rate of rainstorm was also the largest, and heavy rain, moderate rain, and light rain decreased in turn. The significant increasing trend of heavy rain and rainstorm precipitation at the eastern stations in areas I and II is the reason for the significant increasing trend of Meiyu precipitation in this area. The trend of precipitation contribution rates of different magnitudes of precipitation was not obvious for most stations, and only 17 stations in the central and eastern parts of area II showed a significant decreasing trend of the contribution rates of light rain and moderate rain. Urbanization aggravates the increasing trend of heavy precipitation, and the contribution rate of urbanization to R95P and R99P was 10.59% and 17.39%, respectively.
Snowfall is an important component of hydrological cycle, which could be used as an indicator of regional climate change. Identifying the variations of snowfall and its influencing factors is essential for snow disaster prevention and water resource management. Based on the daily data of the 72 meteorological stations in the south and north of the Qinling Mountains from 1970 to 2020, wet bulb temperature dynamic threshold method and empirical orthogonal function (EOF) were used to investigate the spatiotemporal variations in dominant modes of cold-season (from November in a given year to the following May) snowfall in the south and north of the Qinling Mountains. This study also explored the possible mechanism for the interdecadal change of dominant modes of snowfall. The results are as follows: 1) The contribution of the first two EOF leading vectors of the snowfall anomalies was 70.8% during the cold season in the south and north of the Qinling Mountains. The positive phase of the first leading mode (EOF1) was mainly characterized by positive snowfall anomalies in the whole study area. Spatially, areas with more anomalous snowfall were distributed in the Guanzhong Basin, as well as the eastern Qinling Mountains, the Daba Mountains, and the Hanjiang River Basin. In correspondence to the positive phase of the second leading mode (EOF2), decreased snowfall occurred in the Qinling and Daba Mountains, whereas increased snowfall occurred in the basins. It indicates that the response of snowfall anomalies to climate change was more sensitive in the mountainous areas. 2) For temporal variations, the EOF1 was primarily characterized by a decreasing tendency with inter-annual variation. After the mid-1990s, more years were in the negative phase, which implies less snowfall over the whole region. The EOF2 mainly exhibited decadal variations and a continuous declining pattern of snowfall in the mountainous areas after the mid-1990s. 3) From the perspective of circulation mechanism, the positive phase of the EOF1 was primarily affected by synoptic-scale wave activates in January over the midlatitudes of Europe-Asian continent. The variability of synoptic-scale wave activity was affected by the anomalous low over Siberia, which led to the consistently less anomalies of snowfall in the whole study area. The positive phase of the EOF2 revealed that snowfall anomalies were closely associated with the negative sea surface temperature anomalies in winter over the central and eastern Pacific. The findings highlight that the combined spatial pattern of snowfall anomalies and its circulation mechanism help explore the precursors of snowfall anomalies.
The securities of water, energy, and food are three sustainable development goals (SDGs) and have close interactions with other SDGs. Based on the recent studies of the theory, methodology, and application of the water-energy-food nexus (WEF nexus) system, this study analyzed the WEF nexus system in terms of its definition and composition, internal interaction processes, inputs and outputs, and influencing factors. In the process of analysis, the characteristics of the spatial and temporal scales of the research object were taken into account, and the inputs and outputs of the WEF nexus system were clarified from the perspective of the material, energy, and information flows. This study also illustrates the positive and negative impacts of climate change on the water, energy, and food subsystems and their interactions, as well as the impacts of human activities on the WEF nexus system. Furthermore, a research framework of the WEF nexus system covering research themes-disciplinary theories-technical methods-practical applications was proposed, according to the interactions of the WEF nexus system and other SDGs. The introduced framework illustrates three research topics: 1) Linkages within the WEF nexus system and the overall state. 2) The drivers of system change. 3) The influences of the system on socioeconomic development, ecological and environmental protection, and so on. At last, this study highlights the urgent need for interdisciplinary analysis of WEF nexus systems due to the insufficient research and application of nexus relationships and the diversity of spatial and temporal boundaries. The research perspectives based on comprehensive analysis indicators and calculation methods of nexus relationships are presented, and the necessity and ways of coupled application of multi-scale research results is introduced. This study provides a new insight into the research on the basic theory and application of the WEF nexus system, as well as some guidance on the analytical ideas and methods of global and regional sustainable development goals.
Accurate and timely warning is vital for the prevention and control of mountain flash flood disasters in small- and medium-sized basins, but it is the most challenging task. Focusing on the key issues of mountain flash flood warning, this study conducted a review on the spatial differences of mountain flash flood disaster characteristics in China, techniques and methods for flash flood warning, and development of probabilistic warning methods for mountain flash flood control. The review indicated that the temporal and spatial differences of the characteristics of mountain flash flood disasters are clear across China, thus it is necessary to develop suitable early warning systems in specific areas based on their special characteristics. The indicator of critical rainfall is an important basis of mountain flash flood warning in China. A fixed critical rainfall estimated by statistical methods or hydrological models, as commonly done in practice, cannot meet the needs because it does not perform well sometimes and cannot adequately address the uncertainty of warning results. Alternatively, probabilistic warning of mountain flash flood disasters, which can quantitatively evaluate the uncertainty of warning results, has theoretical advantages and potentially wide applications, and thus could be a more adaptive approach. In order to develop the probabilistic warning methods of mountain flash flood disasters, the following key issues should be addressed: 1) Mining detailed information from different sources of rainstorm and flash floods data, and developing effective methods for the probabilistic warning of mountain flash flood disasters. 2) Dealing with the nonstationarity issue commonly encountered in hydrological studies, and exploring its influences on the estimation of critical rainfall and the accuracy of probabilistic warning results. 3) Establishing an integrated flash flood warning system by considering both the occurrence probability of critical rainfall and its resulting probability of mountain flash flood disasters for the practical prevention and control of mountain flash flood disasters.
Multi-hazard risk assessment is the basis for formulating integrated risk governance strategies. Through examining the risk assessment practices in China and internationally, this study selected five authoritative global risk assessment reports, including the Global Assessment Report on Disaster Risk Reduction, Global Climate Risk Index, The Index for Risk Management Report, World Risk Report, and World Atlas of Natural Disaster Risk, to compare their objectives, contents, models, and results of assessment. The main conclusions are as follows: 1) The five risk assessment reports have different focuses in terms of objectives, and four of them regularly publish new reports to analyze the dynamic process of change that facilitates the identification of risks through continuous risk assessment. 2) The methods characterized by the synthesis of risk elements is easy to apply, but it is necessary to further improve the applicability of indicators and adopt more intuitive and practical risk representation methods. 3) The Belt and Road initiative countries have slightly higher risk levels than the global average. In the future, we need to deepen the research on the integrated risk assessment method of multi-hazards, strengthen the practice of natural disaster risk assessment in China, and explore the disaster risk management system of regional linkages. 4) On the whole, the five risk assessment reports all have their own advantages and disadvantages. In the future, we can combine the concepts of "multi-hazard additive losses" and "disaster chain losses" to enrich the models and methods, indicator system, and result representation of integrated risk assessment.