

全球气候模式(global climate models, GCMs)建立在系统的物理、化学和生物基础上,是对地球气候系统各个圈层相互作用和反馈过程的数学表达[1-2]。随着科学技术的不断进步和高性能计算机能力的不断提高,全球气候模式得到了迅速的发展。由世界气候研究计划(World Climate Research Programme, WCRP)耦合模拟工作组(Working Group on Coupled Modelling, WGCM)建立的国际耦合模式比较计划(Coupled Model Intercomparison Project,CMIP)是气候模式研究的里程碑,推动了国际学术界和社会各界对气候变化模拟和预估研究的高度重视[3]。CMIP的目标是更好地了解过去、现在和未来的气候变化,这些变化是由自然的、非强迫的变化引起的,或是在多模式背景下对辐射强迫变化的响应[4]。它强调共享、比较和分析全球气候模式结果以提供高质量气候信息的重要性,在模式试验制定、模式数据格式标准化、建立数据共享平台等方面发挥了至关重要的作用[5],并为气候评估和谈判提供依据。基于CMIP模式的研究结果为IPCC科学评估报告的撰写奠定了基础,包括对气候变化的理解和对未来气候变化及相关影响的预测,是认识气候变化机制和预估未来气候的有力工具。
图1
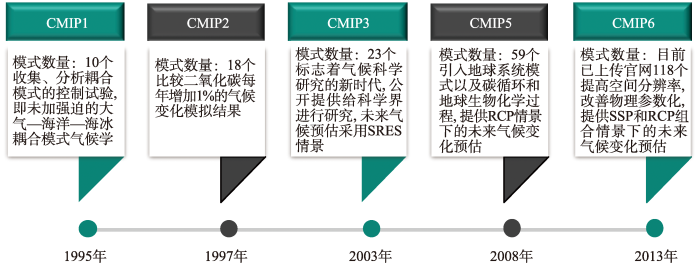
1 CMIP的发展历程
1.1 CMIP1和CMIP2:CMIP的开始
1.2 CMIP3和CMIP5:CMIP的发展
国际耦合模式比较计划第三阶段(CMIP3)标志着气候科学研究的一个新时代,它将最先进的气候变化模式首次公开提供给国际气候科学界进行研究,使全球气候模式之间的相互比较和分析达到了气候科学领域从未达到的国际协作水平。CMIP3包含了不同模拟试验下超过30 TB的开放性模式资料,共有来自12个国家的23个模式参与。与CMIP1和CMIP2相比,CMIP3的一个主要创新之处在于提供了气候变化情景试验数据,即在不同排放情景下预估未来的气候变化。CMIP3使用IPCC排放情景特别报告(Special Report on Emissions Scenarios, SRES)中的情景,包括历史气候模拟试验(20C3M)和21世纪情景试验(高温室气体排放SRES-A2、中等温室气体排放SRES-A1B、低温室气体排放SRES-B1等试验)[8]。CMIP3多模式数据集为数百篇气候变化研究论文提供了基础,并在IPCC第四次评估报告(AR4)中发挥了突出作用。在CMIP3之后,WGCM对CMIP3中进行的试验进行了补充,用于分离人为和自然强迫对20世纪气候的影响[2,8],但其影响力相对较小;并且为了同步CMIP和IPCC评估报告之间的编号系统,这一补充试验并未使用CMIP4进行命名。
IPCC第五次评估报告(AR5)主要依靠国际耦合模式比较计划第5阶段(CMIP5)多模式数据集合,帮助认识过去和现在的全球气候变化以及预估不同排放情景下未来气候的可能变化[9]。CMIP5官网提供了59个不同模式的输出结果,目标是评估模式模拟历史气候演变的能力,提供近期(到2035年左右)和长期(到2100年及以后)未来气候变化的预估,并了解一些引起模式预估差异的因素[10]。参与CMIP5的模式主要完成了3类数值试验:一是年代际气候变化预测试验,二是长期数值试验,三是高分辨率大气模式试验。在传统海气耦合模式的基础上,CMIP5首次引入了地球系统模式以及该模式中的全球碳循环过程和地球生物化学过程,用于模拟和预估人类活动碳排放对气候变化的影响[11]。相比较于CMIP3,CMIP5模式的水平分辨率有所提高,并且物理参数化方案更加合理。CMIP5采用了新的气候情景,考虑了大气中温室气体、气溶胶浓度和土地利用的影响,以及未来可能产生的排放不确定性,称为典型浓度路径(representative concentration pathways, RCP)[12]。与SRES排放情景相比,RCP涵盖了更广泛的可能性,包括了低排放情景(RCP2.6,2100年辐射强迫达2.6 W/m2)、2个中等排放情景(RCP4.5和RCP6.0,2100年辐射强迫分别达4.5 W/m2和6.0 W/m2)和高排放情景(RCP8.5,2100年辐射强迫达8.5 W/m2)[13]。
1.3 CMIP6:目前最先进的CMIP
CMIP在经历了以上阶段后,第六阶段国际耦合模式比较计划(CMIP6)于2013年正式启动。来自全球多个国家的高校及科研机构共享了设计试验更加完善的气候模式输出结果[4],截至2023年6月已有118个模式在官网发布。CMIP6的总体设计框架如图2所示,以WCRP的重大科学挑战为背景,CMIP6旨在解决3个关键科学问题:① 地球系统如何响应外强迫变化;② 造成模式系统偏差的原因和后果是什么;③ 如何在内部气候变率、可预测性和情景不确定性影响下预估未来气候变化[5,14-15]?与上一代CMIP5模式相比,CMIP6模式在空间分辨率、物理参数化等方面都进行了改进,并增加了额外的地球系统过程和组分,目的是能够更好地模拟未来气候的反馈(如陆地碳吸收及永久冻土过程的氮效应)[16]。经过长期和广泛的协商,CMIP6建立了一个新的、更加联合的结构,共由3个主要部分组成:一是常规试验,即DECK(diagnostic, evaluation and characterization of klima,klima为climate的希腊语)试验和CMIP历史气候模拟试验(1850—2014年),与以往阶段的CMIP保持连续性,并有助于记录CMIP不同阶段气候模式的基本特征;二是共同标准、协调、架构和文档,帮助分配模式输出和表征模式集合;三是CMIP批准的模式相互比较项目(CMIP-endorsed model intercomparison Projects,MIPs)集合,在DECK试验和历史模拟试验的基础上构建,以解决大量特定的科学问题并填补之前CMIP阶段的科学空白。DECK试验与历史模拟试验构成了参与CMIP6的“准入卡”,描述模式集合的特征,并根据与观测和气候变化响应的比较来评估其质量[17]。
图2
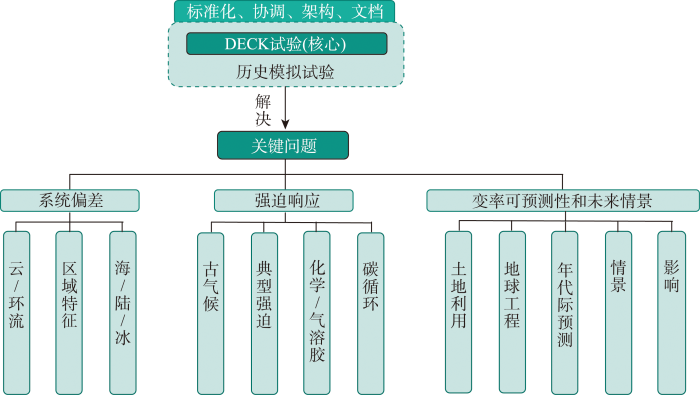
针对气候科学热点问题,自2015年开始, CMIP6已经开展了23个MIPs,并有超过100个模式组参与其中。情景模式比较计划(ScenarioMIP)是CMIP6的重要子计划之一,将不同共享社会经济路径(shared socioeconomic pathways,SSPs)与RCPs进行科学组合,旨在RCP情景中融入社会经济发展的影响,为未来气候变化机理研究以及气候变化减缓和适应研究提供关键的数据支持[18]。ScenarioMIP设计中强迫路径的确定分为2步:首先确定未来全球平均的辐射强迫水平,在保持CMIP5辐射强迫水平连续性的基础上,填补CMIP5强迫路径的空白;然后选择每种辐射强迫水平对应的社会经济情景[19]。SSP描述了没有气候政策影响下的未来社会发展情况,包括可持续发展(SSP1)[20]、中间发展(SSP2)[21]、局部发展(SSP3)[22]、不均衡发展(SSP4)[23]和常规发展(SSP5)[24] 5种。ScenarioMIP 计划依据试验先后优先级,将未来情景分为Tier 1核心试验和Tier 2 试验。Tier 1试验涵盖了延续RCP2.6、RCP4.5和RCP8.5辐射强迫水平的SSP1-2.6、SSP2-4.5和SSP5-8.5情景,以及一个新的辐射强迫情景(SSP3-7.0),代表了相对高的辐射强迫与高社会脆弱性的组合。
1.4 中国气候模式的发展
过去几十年来,中国的科研机构也积极参与到气候系统模式的研发工作中。CMIP1计划和CMIP2计划中,参与研发的模式为中国科学院大气物理研究所发展的GOALS2和GOALS4模式[25-26]。随后,中国科学院大气物理研究所继续参与了CMIP3计划,研发了FGOALS-g1.0模式[27]。中国参与CMIP5计划的气候模式明显增多,共有5个模式,除了中国科学院大气物理研究所以外,国家气候中心、北京师范大学和自然资源部第一海洋研究所也首次发布了他们的研究成果[28]。目前正在实施的CMIP6计划中,中国共有14个模式通过地球系统网格联盟(ESGF)正式发布,包括:国家气候中心研发的BCC-ESM1.0、BCC-CSM2-MR和BCC-CSM2-HR模式;中国气象科学研究院研发的CAMS-CSM1-0模式;中国科学院多个研究所合作研发的CAS-ESM2-0模式;清华大学牵头研发的CIESM模式;中国科学院大气物理研究所研发的FGOALS-f3-H、FGOALS-f3-L和FGOALS-g3模式;自然资源部第一海洋研究所研发的FIO-ESM-2-0模式;南京信息工程大学研发的NESM3模式;中国台湾研究机构研发的TaiESM1、TaiESM1-TIMCOM和TaiESM1-TIMCOM2模式。总体来看,从CMIP1到CMIP6,中国气候系统模式的研发工作在模式数量和参与机构体量等方面都有所提高[2]。
2 CMIP模式的模拟效果检验
基于陆续发布的CMIP1~CMIP6模式比较计划,研究者们对不同时空尺度的气候变化进行了大量研究。使用气候模式进行研究的最终目标是预测不同时空尺度下的气候变化,而评估模式再现“当前气候”和过去气候变化的能力是使用CMIP进行未来气候预估的一个重要前提。模式模拟能力的评估主要侧重3个方面:气候平均态、变率和趋势,一般将观测数据作为参考依据,计算模式模拟结果与观测的偏差、标准差之比、均方误差,以及线性变化趋势等来比较观测和模式模拟结果的一致性[29⇓-31]。在此基础上,还有一些研究通过分析模式对气候变化过程、现象和极值的模拟结果来检验模式的可靠性[32-33]。随着气候模式数量的不断扩增,使用多模式集合进行气候模拟与预估已经成为了一种常用的方法,研究表明,多模式集合平均结果提高了模式模拟的可靠性,并且能够减少模拟和预估中存在的不确定性[34-35]。
2.1 气温的模拟评估
地表气温是衡量全球气候变化的重要指标,国内外已有许多研究针对CMIP模式模拟全球和不同区域气温的表现进行了评价。基于纳什效率系数(Nash-Sutcliffe efficiency,NSE)的评估结果表明,CMIP3模式可以较好地表征年平均气温的空间分布规律,其模拟结果的NSE中值为0.97[36]。Kumar等[37]对19个CMIP5模式模拟20世纪气温趋势的能力进行分析,指出CMIP5模式能够合理地再现全球陆地平均气温的变化趋势。从多角度对CMIP6模式模拟全球地表平均气温的评估结果显示,大多数模式和多模式平均值都能模拟出历史全球气温的变暖趋势,但CMIP6模式对全球气温分布形态特征的模拟需要进一步加强[38-39]。在对单一阶段的CMIP模式进行评估的基础上,大量研究通过比较两代以上的CMIP模式对气温的模拟能力来反映全球气候模式的发展。如Reichler等[40]评估了CMIP1、CMIP2、CMIP3模拟气温平均态和长期趋势的性能,发现CMIP气候模式的性能随着时间的推移一直在稳步提高;Bock等[41]比较了CMIP3、CMIP5以及CMIP6模式与ERA5(the fifth generation ECMWF atmospheric reanalysis)数据的气温空间分布差异,发现所有阶段的CMIP模式均都能够合理地再现全球气温的空间分布特征,全球气温的平均偏差从-0.451 ℃(CMIP3)改善至0 ℃左右(CMIP5和CMIP6),均方根差(RMSD)也持续减小;但3个阶段的模式均在某些区域存在偏差,如高海拔地区和南大洋地区。另外,大量研究评估了CMIP模式对区域平均气温的模拟能力,例如北美洲、中亚、澳大利亚,发现虽然CMIP模式能够比较合理地表现出区域气温的时空变化特征,但对区域气温细节特征的模拟水平还有待提高,并且模式间不确定性较大[30,42-43]。
近些年来,气温极值作为气温模拟评估的一个重要内容,也受到诸多学者的关注。Sillmann等[44]基于日最高(最低)气温计算了极端气温指数,比较了CMIP3和CMIP5两个阶段的模式在模拟气温极值方面的表现,发现CMIP5模式集合在模拟极端气温时的模式间不确定性小于CMIP3模式集合;并且由于CMIP5的模式分辨率更高,CMIP5模式在网格单元尺度上对极端气温的模拟性能更好。Chen等[45]系统评估了CMIP5和CMIP6对气候变化检测和指数专家组(expert team on climate change detection and indices,ETCCDI)提出的极端气温指数的模拟能力,指出CMIP6模式在模拟极端气温及其趋势方面表现出了普遍的改进;并且CMIP6模式间的不确定性明显小于CMIP5模式,尤其是对于高纬度地区而言。
中国学者也评估了CMIP模式对中国气温变化的模拟能力[29,46⇓⇓-49]。其中,Yan等[50]比较了CMIP3模式和CMIP5模式对中国地表均温的模拟能力,发现尽管CMIP5模式较CMIP3模式在模拟中国均温变化趋势和空间分布方面的能力有所提高,但CMIP5模式仍然对中国气温气候态值存在低估,尤其是中国西部地区,模拟冷偏差约为2.8 ℃。Sun等[51]量化了中国8个子区域内观测日均气温以及日最高(最低)气温与CMIP模拟结果之间的概率密度函数(probability density function, PDF)匹配技能得分,发现CMIP3和CMIP5模式均能模拟出所有子区域的观测PDF分布特征;然而,大多数模式高估了气温低值的概率。与CMIP5模式相比,CMIP6模式对中国区域平均气温和极端气温的模拟能力均得到了一定程度的改善,如CMIP6模式集合平均结果显著降低了在模拟中国西北部分地区年最大日最高气温时存在的暖偏差[52]。目前,学者们还评估了CMIP6模式对中国华北平原、青藏高原、黄河上游、澜沧江流域等区域气温变化的模拟能力,均发现CMIP6模式能够较好地模拟出这些区域平均气温的空间分布格局与年际变化特征[53⇓⇓-56]。但不同阶段的CMIP模式对青藏高原平均气温和气温极值的模拟能力均存在大于4 ℃的冷偏差,特别是在寒冷的季节[52],使用综合评分指标的评估结果显示CMIP6模式对青藏高原气温的模拟能力优于CMIP5模式[57]。
2.2 降水的模拟评估
降水是描述全球水文过程的关键气候变量之一,由极端降水引起的自然灾害将造成严重的人员伤亡和经济损失。气候模式对降水变化的准确模拟可以为应对未来的自然灾害提供重要的参考依据。研究表明,CMIP气候模式对气温变化的模拟效果普遍优于对降水变化的模拟效果,尤其是对中小尺度而言[58]。Dai[59]评估了CMIP3模式对降水变化的模拟能力,指出大多数CMIP3模式均能模拟出全球降水的分布特征,例如赤道以北的狭窄最大降雨量带以及副热带高压带、北非和中东的干旱地区等,但在模拟区域性降水时还存在一些误差。针对CMIP5和CMIP6模式的评估结果同样显示,两代CMIP模式均可再现观测降水的空间分布特征[37,41]。随着CMIP模式的不断发展,其对降水空间变化的模拟能力也在不断提高,CMIP3、CMIP5和CMIP6模式模拟的年平均降水量与观测年平均降水量的空间相关系数分别为0.69~0.87、0.79~0.88和0.80~0.92;然而,不同阶段的CMIP模式对降水的模拟也存在一些系统偏差,例如所有阶段的模式均在热带地区显示出最大的偏差,约为3.5 mm/d[41]。从CMIP3到CMIP6,模式对夏季季风、双热带辐合带以及热带降水日循环的模拟偏差改善较小[60-61]。已有研究证明气候模式对热力学和动力学过程的模拟能力是影响区域降水模拟准确性的重要因素,而模式水平分辨率的提高则有助于改善此过程[62]。相较于CMIP3和CMIP5,CMIP6新增了高分辨率模式比较计划(HighResMIP),旨在评估水平分辨率提高后气候模式模拟性能的改进效果[63]。学者们基于HighResMIP提供的气候模式,比较了不同分辨率的CMIP6模式对全球不同地区降水变化的模拟能力,结果发现具有较高分辨率的模式对降水空间分布特征的模拟具有更好的表现,并且高分辨率模式对降水模拟的系统偏差也有所改善[58,64-65]。
从CMIP3开始,中国学者针对气候模式对中国地区降水变化的模拟能力展开了一系列的工作。基于CMIP3模式的降水评估结果显示,大多数模式能较好地模拟出中国区域降水变化的空间分布特征及其线性趋势,但CMIP3模式在青藏高原东侧、高原南部存在虚假的降水中心[68]。陈晓晨[11]基于多套观测资料评估了CMIP5模式对中国地区降水的模拟能力,发现多模式集合可以再现出与观测相似的降水空间分布特征,但CMIP5模式对青藏高原降水的高估没有得到明显的改善。由于在物理参数化方案、空间分辨率等方面的改善,CMIP6模式对中国区域降水变化的模拟结果较CMIP5有了一定程度的改进,表现为对降水空间分布特征和年循环变化特征的模拟等方面[58]。关于模式分辨率对模拟中国区域降水变化的影响,中国许多学者也开展了相关的研究。例如,黄子立等[69]探究了高分辨率CMIP6模式对中国西南地区夏季降水的改进程度,发现高分辨率模式与观测的空间相关系数均超过0.8,而低分辨率模式的模拟结果普遍为0.7左右,还指出提高分辨率对地形陡峭区的降水强度改善程度更为明显。对于青藏高原地区,CMIP6的高分辨率模式均能够减小降水模拟中存在的偏差,但模式依然高估了青藏高原地区降水量和降水频率,低估了降水强度[70]。CMIP模式对极端降水指数的模拟性能通常低于对极端气温指数的模拟性能,但与CMIP5相比,CMIP6模式对中国极端降水的模拟存在一些改进:CMIP5模式对中国南方降水的模拟普遍存在干偏差,而此类偏差在CMIP6模式中则大大减小,例如,CMIP6模式模拟强降水量的偏差比CMIP5模式降低了50%左右;虽然青藏高原东部强降水量和降水强度的湿偏差在CMIP6模式中仍然存在,但与CMIP5模式相比较小[52]。
2.3 其他气候变量的模拟评估
CMIP为气候变化相关研究提供了多种气候变量数据,除气温和降水2个基本气候变量外,国内外学者针对CMIP模式对其他气候变量的模拟性能也开展了广泛的评估工作。目前研究重点关注的变量有海表温度、风速、海平面气压、土壤湿度等。IPCC第六次评估报告(AR6)第一工作组报告使用中心化相关系数系统地比较了CMIP3、CMIP5和CMIP6三代模式对不同气候变量气候态的模拟能力(图3),结果表明:CMIP6模式除了对近地表气温和降水量的模拟能力优于CMIP5和CMIP3以外,对海平面气压、长(短)波辐射、高空温度、比湿和许多其他变量的模拟性能也有所改善[71]。当然,CMIP模式对其他气候变量的模拟也存在一定程度的偏差。例如,研究发现CMIP3和CMIP5两个阶段的模式结果均在很大程度上低估了地表太阳辐射通量的年代际变化[72]。对于海表温度变率,观测值和模式在北大西洋和南大洋存在较大的偏差,尤其是在较长的时间尺度上(5年滑动平均)[73]。Lee等[74]利用卫星测量的风应力数据评估了CMIP模式对风应力年平均值和季节周期的模拟效果,结果发现CMIP模式在赤道地区存在显著偏差,并且CMIP5相对于CMIP3的改进有限。Qiao等[75]比较了多个再分析土壤水分数据集和CMIP6模式模拟的全球土壤水分之间的一致性,指出CMIP6多模式集合平均值对全球土壤水分的气候态进行了合理的模拟,包括干湿中心、中高纬度地区融雪季节和低纬度地区雨季的土壤水分年峰值等,但在高海拔和高纬度地区,模式模拟的土壤水分和再分析数据结果的相关性较低(-0.6~0.3)。Bock[41]采用多个评价指标评估了来自CMIP3、CMIP5和CMIP6的不同模式对不同气候变量的模拟性能,指出模式性能因模式的差异和变量的差异而不同,但来自相同模式族的成员性能非常相似;从CMIP3到CMIP6,大部分模式对总云量、海平面气压、500 hPa位势高度、风场、辐射场等变量的模拟能力都存在明显的改进。
图3
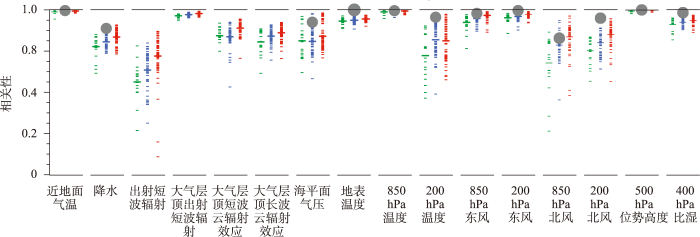
图3
1980—1999年模式年均气候态和观测年均气候态间的中心化相关系数
注:引自IPCC AR6第一工作组报告[71]。图中,每个模式仅使用一个集合成员(用短线表示),多模式集合平均值用长线表示(绿色为CMIP3、蓝色为CMIP5、红色为CMIP6;主要参考的观测数据从左到右依次为ERA5、GPCP-SG(Global Precipitation Climatology Project-Satellite Gauge)、CERES-EBAF(Clouds and the Earth's Radiant Energy System-Energy Balanced and Filled)、CERES-EBAF、CERES-EBAF、CERES-EBAF、JRA-55(the Japanese 55-year reanalysis)、ESACCI-SST(the European Space Agency Climate Change Initiative Sea Surface Temperature project)、ERA5、ERA5、ERA5、ERA5、ERA5、ERA5、AIRS(Atmospheric Infrared Sounder)和ERA5;灰色圆圈代表模式和其他观测数据集(从左到右依次为NCEP、GHCN、ERA5、HadISST、NCEP、NCEP、NCEP、NCEP、NCEP、NCEP、ERA5和NCEP)之间的相关性。
Fig.3
Centred pattern correlations between models and observations for the annual mean climatology over the period 1980-1999
近年来,中国学者在中国不同区域进行了多种变量的模式评估工作。例如,宋春阳等[76]基于观测和再分析资料评估了CMIP5模式对中国近海海温变化的模拟能力,发现多模式集合虽然能够再现海温的空间分布特征,但其量值上存在一定的低估,尤其是在渤海和黄海。针对模式对中国区域蒸散发的模拟能力,有研究发现CMIP5模式在中国大部分地区存在高估现象,这可能与CMIP5模式在气温模拟中的系统偏差相关[77]。Wu等[78]比较了CMIP5和CMIP6在模拟中国地面风速方面的能力,结果表明,CMIP6多模式集合平均值能够很好地再现地面风速的空间分布特征,并且CMIP6模式的模拟结果通常优于CMIP5模式;然而,两代模式均未能再现观测中国地面风速的下降趋势。为了解CMIP6土壤湿度数据在青藏高原地区的适用性,陈涛等[79]对CMIP6模式的土壤湿度数据进行评估,发现CMIP6模式高估了青藏高原的土壤湿度,并且模式间不确定性较大。胡桃等[80]利用CMIP6多模式结果,评估了模式对青藏高原冻土相关的变量(如积雪深度、雪水当量)的模拟能力,发现模式结果与观测数值在除青藏高原东南部以外的地区较为一致,但模式高估了青藏高原的积雪深度。
3 总结和展望
CMIP在国际层面上促进了气候科学领域前所未有的协调,取得了较大成功。随着世界上所有主要建模团体的参与,CMIP已经得到了科学界的广泛认可,其结果在IPCC报告中发挥了关键作用。本文回顾了CMIP的发展历程,并重点比较了CMIP3、CMIP5和CMIP6模式的模拟性能。从CMIP3到CMIP6,参与模式研发的队伍体量和模式数量不断增加;同时,模式的模拟性能也在不断提高,但模式模拟结果仍不可避免地存在一些不足:
(1) 不同阶段的模式模拟还存在一些系统性偏差,如双热带辐合带的异常现象。就中国区域而言,在青藏高原地形复杂以及观测站点稀疏的影响下,CMIP模式对青藏高原的模拟偏差存在放大现象,表现为对地表气温的低估和对降水的高估。即使CMIP6模式的分辨率较CMIP3和CMIP5模式有所改进,但其对高海拔区域(青藏高原)气候的系统性模拟偏差改善仍较小。
(2) 相比较于气候均值,CMIP模式对气候极值的模拟能力还有待进一步改善。具体表现为,模式普遍地高估了冷热极端气温的幅度,并且对热带和亚热带地区极端降水的模拟仍然存在较大的偏差。
(3) 尽管高分辨率模式近年来发展迅猛,但由于其面临计算机运算规模大及动力框架仍需完善等问题,CMIP模式对区域气候(尤其是地形复杂地区)特征的模拟还存在限制。
(4) 多模式集合模拟中还存在一定的不确定性,虽然不同模式均能够模拟出历史气候变化的总体趋势,但模式间比较依然存在很大的差异。
为了弥补CMIP模式在气候变化模拟及预测中的不足,可以从以下几个方面进行完善:
第一,未来有必要采取统计降尺度和动力降尺度方法开展进一步的研究。例如,世界气候研究计划(WCRP)于2009年主导并发起的国际间区域气候降尺度试验(Coordinated Regional Climate Downscaling Experiment, CORDEX),其基于CMIP5 和CMIP6的多模式、多情景预估结果,通过动力降尺度技术为全球不同区域提供精细尺度的气候变化预测数据[81]。
第二,应继续提高CMIP模式的水平和垂直分辨率,以利于提高模式对陆地降水变化和极端气候的模拟效果并减少模拟中存在的不确定性。但对于一些重要的小尺度特征,即使是高分辨率气候模式也无法完全合理地进行模拟。因此,建模机构仍需加强对地球系统各个圈层相互作用和反馈机制的认识,不断完善模式对地球系统细致结构的模拟能力以解释未明确认识的地球系统关键过程及特征。
第三,观测资料的质量提升和数据扩展也是提高CMIP模式模拟能力的重要基础,有助于更准确地表示气候系统各组成部分的初始状态,以便获得更准确的气候预测。
第四,气候模拟和预估可靠性的改进在很大程度上取决于可用的计算资源,因为分辨率的提高、运行时间的延长以及复杂参数化的应用均需要更大的计算成本。因此,提高计算能力对于改善未来的气候模拟和预测至关重要。
第五,对于模式模拟和预估中存在的不确定性,应从源头出发,完善气候系统机制理解,了解产生不确定性的原因,并发展最优多模式集合技术,以提供可靠的模式模拟及预估数据。
参考文献
气候模式
[J].
中国地球气候系统模式的发展及其模拟和预估
[J].
Development of climate and earth system models in China: Past achievements and new CMIP6 results
Climate model intercomparisons: Preparing for the next phase
[J].
Overview of the Coupled Model Intercomparison Project Phase 6 (CMIP6) experimental design and organization
[J].
DOI:10.5194/gmd-9-1937-2016
URL
[本文引用: 2]

. By coordinating the design and distribution of global climate model simulations of the past, current, and future climate, the Coupled Model Intercomparison Project (CMIP) has become one of the foundational elements of climate science. However, the need to address an ever-expanding range of scientific questions arising from more and more research communities has made it necessary to revise the organization of CMIP. After a long and wide community consultation, a new and more federated structure has been put in place. It consists of three major elements: (1) a handful of common experiments, the DECK (Diagnostic, Evaluation and Characterization of Klima) and CMIP historical simulations (1850–near present) that will maintain continuity and help document basic characteristics of models across different phases of CMIP; (2) common standards, coordination, infrastructure, and documentation that will facilitate the distribution of model outputs and the characterization of the model ensemble; and (3) an ensemble of CMIP-Endorsed Model Intercomparison Projects (MIPs) that will be specific to a particular phase of CMIP (now CMIP6) and that will build on the DECK and CMIP historical simulations to address a large range of specific questions and fill the scientific gaps of the previous CMIP phases. The DECK and CMIP historical simulations, together with the use of CMIP data standards, will be the entry cards for models participating in CMIP. Participation in CMIP6-Endorsed MIPs by individual modelling groups will be at their own discretion and will depend on their scientific interests and priorities. With the Grand Science Challenges of the World Climate Research Programme (WCRP) as its scientific backdrop, CMIP6 will address three broad questions: – How does the Earth system respond to forcing? – What are the origins and consequences of systematic model biases? – How can we assess future climate changes given internal climate variability, predictability, and uncertainties in scenarios? This CMIP6 overview paper presents the background and rationale for the new structure of CMIP, provides a detailed description of the DECK and CMIP6 historical simulations, and includes a brief introduction to the 21 CMIP6-Endorsed MIPs.\n
第六次国际耦合模式比较计划(CMIP6)评述
[J].
Commentary on the Coupled Model Intercomparison Project Phase 6 (CMIP6)
Global Coupled General Circulation Models
[J].
DOI:10.1175/1520-0477-76.6.951
URL
[本文引用: 1]
Major conclusions and recommendations regarding the status of global coupled general circulation models are presented here from a workshop convened by the World Climate Research Programme Steering Group on Global Coupled Modelling that was held from 10 to 12 October 1994 at the Scripps Institution of Oceanography, La Jolla, California. The purpose of the workshop was to assess the current state of the art of global coupled modeling on the decadal and longer timescales in terms of methodology and results to identify the major issues and problems facing this activity and to discuss possible alternatives for making progress in light of these problems. This workshop brought together representatives from nearly every group in the world actively involved in formulating and running such models. After presentations by workshop participants, four working groups identified key issues involving 1) initialization and model spinup, 2) strategies and techniques for coupling of model components, 3) flux correction/adjustment, and 4) secular drift and systematic errors. The participants concluded that improved communication between those engaged in this activity will be important to enhance further progress. Consequently, the World Climate Research Programme intends to continue the support of internationally coordinated activities in global coupled modeling.
Intercomparison makes for a better climate model
[J].
The WCRP CMIP3 multimodel dataset: A new era in climate change research
[J].
DOI:10.1175/BAMS-88-9-1383
URL
[本文引用: 2]
A coordinated set of global coupled climate model [atmosphere–ocean general circulation model (AOGCM)] experiments for twentieth- and twenty-first-century climate, as well as several climate change commitment and other experiments, was run by 16 modeling groups from 11 countries with 23 models for assessment in the Intergovernmental Panel on Climate Change (IPCC) Fourth Assessment Report (AR4). Since the assessment was completed, output from another model has been added to the dataset, so the participation is now 17 groups from 12 countries with 24 models. This effort, as well as the subsequent analysis phase, was organized by the World Climate Research Programme (WCRP) Climate Variability and Predictability (CLIVAR) Working Group on Coupled Models (WGCM) Climate Simulation Panel, and constitutes the third phase of the Coupled Model Intercomparison Project (CMIP3). The dataset is called the WCRP CMIP3 multimodel dataset, and represents the largest and most comprehensive international global coupled climate model experiment and multimodel analysis effort ever attempted. As of March 2007, the Program for Climate Model Diagnostics and Intercomparison (PCMDI) has collected, archived, and served roughly 32 TB of model data. With oversight from the panel, the multimodel data were made openly available from PCMDI for analysis and academic applications. Over 171 TB of data had been downloaded among the more than 1000 registered users to date. Over 200 journal articles, based in part on the dataset, have been published AMERICAN METEOROLOGICAL SOCIETY so far. Though initially aimed at the IPCC AR4, this unique and valuable resource will continue to be maintained for at least the next several years. Never before has such an extensive set of climate model simulations been made available to the international climate science community for study. The ready access to the multimodel dataset opens up these types of model analyses to researchers, including students, who previously could not obtain state-of-the-art climate model output, and thus represents a new era in climate change research. As a direct consequence, these ongoing studies are increasing the body of knowledge regarding our understanding of how the climate system currently works, and how it may change in the future.
Climate change 2013: The physical science basis
[M].
An overview of CMIP5 and the experiment design
[J].
DOI:10.1175/BAMS-D-11-00094.1
URL
[本文引用: 1]
The fifth phase of the Coupled Model Intercomparison Project (CMIP5) will produce a state-of-the- art multimodel dataset designed to advance our knowledge of climate variability and climate change. Researchers worldwide are analyzing the model output and will produce results likely to underlie the forthcoming Fifth Assessment Report by the Intergovernmental Panel on Climate Change. Unprecedented in scale and attracting interest from all major climate modeling groups, CMIP5 includes “long term” simulations of twentieth-century climate and projections for the twenty-first century and beyond. Conventional atmosphere–ocean global climate models and Earth system models of intermediate complexity are for the first time being joined by more recently developed Earth system models under an experiment design that allows both types of models to be compared to observations on an equal footing. Besides the longterm experiments, CMIP5 calls for an entirely new suite of “near term” simulations focusing on recent decades and the future to year 2035. These “decadal predictions” are initialized based on observations and will be used to explore the predictability of climate and to assess the forecast system's predictive skill. The CMIP5 experiment design also allows for participation of stand-alone atmospheric models and includes a variety of idealized experiments that will improve understanding of the range of model responses found in the more complex and realistic simulations. An exceptionally comprehensive set of model output is being collected and made freely available to researchers through an integrated but distributed data archive. For researchers unfamiliar with climate models, the limitations of the models and experiment design are described.
The next generation of scenarios for climate change research and assessment
[J].DOI:10.1038/nature08823 [本文引用: 1]
The representative concentration pathways: An overview
[J].DOI:10.1007/s10584-011-0148-z URL [本文引用: 1]
CMIP5 scientific gaps and recommendations for CMIP6
[J].
DOI:10.1175/BAMS-D-15-00013.1
[本文引用: 1]
The scientific gaps identified in the fifth phase of the Coupled Model Intercomparison Project (CMIP5) that guided the experiment for its next phase, CMIP6, are identified.
CMIP6的设计
[J].
Design of CMIP6
Taking climate model evaluation to the next level
[J].
DOI:10.1038/s41558-018-0355-y
[本文引用: 1]
Earth system models are complex and represent a large number of processes, resulting in a persistent spread across climate projections for a given future scenario. Owing to different model performances against observations and the lack of independence among models, there is now evidence that giving equal weight to each available model projection is suboptimal. This Perspective discusses newly developed tools that facilitate a more rapid and comprehensive evaluation of model simulations with observations, process-based emergent constraints that are a promising way to focus evaluation on the observations most relevant to climate projections, and advanced methods for model weighting. These approaches are needed to distil the most credible information on regional climate changes, impacts, and risks for stakeholders and policy-makers.
Progress in climate modelling
[J].DOI:10.1038/nclimate3398 URL [本文引用: 1]
The scenario model intercomparison project (ScenarioMIP) for CMIP6
[J].
DOI:10.5194/gmd-9-3461-2016
URL
[本文引用: 1]
. Projections of future climate change play a fundamental role in improving understanding of the climate system as well as characterizing societal risks and response options. The Scenario Model Intercomparison Project (ScenarioMIP) is the primary activity within Phase 6 of the Coupled Model Intercomparison Project (CMIP6) that will provide multi-model climate projections based on alternative scenarios of future emissions and land use changes produced with integrated assessment models. In this paper, we describe ScenarioMIP's objectives, experimental design, and its relation to other activities within CMIP6. The ScenarioMIP design is one component of a larger scenario process that aims to facilitate a wide range of integrated studies across the climate science, integrated assessment modeling, and impacts, adaptation, and vulnerability communities, and will form an important part of the evidence base in the forthcoming Intergovernmental Panel on Climate Change (IPCC) assessments. At the same time, it will provide the basis for investigating a number of targeted science and policy questions that are especially relevant to scenario-based analysis, including the role of specific forcings such as land use and aerosols, the effect of a peak and decline in forcing, the consequences of scenarios that limit warming to below 2 °C, the relative contributions to uncertainty from scenarios, climate models, and internal variability, and long-term climate system outcomes beyond the 21st century. To serve this wide range of scientific communities and address these questions, a design has been identified consisting of eight alternative 21st century scenarios plus one large initial condition ensemble and a set of long-term extensions, divided into two tiers defined by relative priority. Some of these scenarios will also provide a basis for variants planned to be run in other CMIP6-Endorsed MIPs to investigate questions related to specific forcings. Harmonized, spatially explicit emissions and land use scenarios generated with integrated assessment models will be provided to participating climate modeling groups by late 2016, with the climate model simulations run within the 2017–2018 time frame, and output from the climate model projections made available and analyses performed over the 2018–2020 period.\n
CMIP6情景模式比较计划(ScenarioMIP)概况与评述
[J].
Short commentary on CMIP6 scenario model intercomparison project (ScenarioMIP)
The shared socio-economic pathways: Trajectories for human development and global environmental change
[J].DOI:10.1016/j.gloenvcha.2016.10.009 URL [本文引用: 1]
The marker quantification of the shared socioeconomic pathway 2: A middle-of-the-road scenario for the 21st century
[J].DOI:10.1016/j.gloenvcha.2016.06.004 URL [本文引用: 1]
SSP3: AIM implementation of shared socioeconomic pathways
[J].DOI:10.1016/j.gloenvcha.2016.06.009 URL [本文引用: 1]
The SSP4: A world of deepening inequality
[J].DOI:10.1016/j.gloenvcha.2016.06.010 URL [本文引用: 1]
Fossil-fueled development (SSP5): An energy and resource intensive scenario for the 21st century
[J].DOI:10.1016/j.gloenvcha.2016.05.015 URL [本文引用: 1]
LASG全球海洋—大气—陆面系统模式(GOALS/LASG)及其模拟研究
[J].
Global ocean-atmosphere-land systemmodel of LASG (GOALS/LASG) and its performance in simulation study
Response of IAP/LASG GOALS model to the coupling of air-sea fresh water exchange
[J].DOI:10.1007/s00376-000-0037-2 URL [本文引用: 1]
A flexible coupled ocean-atmosphere general circulation model
[J].DOI:10.1007/s00376-002-0042-8 URL [本文引用: 1]
中国地球气候系统模式研究进展: CMIP计划实施近20年回顾
[J].
Development of earth/climate system models in China: A review from the Coupled Model Intercomparison Project perspective
CMIP5模式对西北干旱区典型流域气温模拟能力评估: 以开都—孔雀河为例
[J].
DOI:10.18402/resci.2019.06.13
[本文引用: 2]
西北干旱区水资源问题突出,全球变暖将进一步加剧其水资源短缺,研究未来气候变化对流域水资源合理分配和使用具有重要意义。本文利用CRU(Climate Research Unit)数据和DCHP(Downscaled CMIP3 and CMIP5 Climate and Hydrology Projections)提供的32个经BCSD降尺度的CMIP5(全球耦合模式比较计划第五阶段)模式气温数据,采用线性倾向估计、滑动平均、M-K(Mann-Kendall)检验及滑动T(MMT)等检验法,以西北干旱区典型流域开都-孔雀河流域为例,通过对1950—2005年的年平均气温、年平均最高气温与年平均最低气温3个指标的变化趋势及突变年份进行检测,评估各模式及模式集合平均对气温变化的模拟能力。研究结果表明:①12个模式能够准确模拟出1950—2005年流域内各气温指标的显著增加趋势,8个模式能够模拟出部分气温指标的增温趋势,但均低估了增温速率,集合平均也存在同样问题;②除FIO-ESM与MPI-ESM-MR能够准确模拟出气温突变时间外,绝大多数模式不能够准确模拟出。基于优选模式的集合平均PM-PLS和PM-EE对突变的模拟能力总体上优于单个模式,其中PM-PLS模拟能力更优;③对PM-PLS模式集合平均进一步评价,发现其能较好地再现流域气温线性趋势的时空变化总体特征,但仍存在增温速率低估的问题。采用气候模式进行未来气候预估仍需加强模式优选及多模式集合平均方法的深入研究。
Evaluation of air temperature of the typical river basin in desert area of Northwest China by the CMIP5 models: A case of the Kaidu-Kongqi River Basin
DOI:10.18402/resci.2019.06.13
[本文引用: 2]
Global warming will result in serve water shortage, aggravating the existing outstanding water problem in the Kaidu-Kongqi River Basin. Studies on the future climate change will contribute to the rational distribution and utilization of water in the basin. Based on the CRU(Climate Research Unit) dataset and 32 BCSD-downscaled CMIP5 model air temperature dataset from DCHP (Downscaled CMIP3 and CMIP5 Climate and Hydrology Projections), the paper assessed the simulation ability of both 32 models and multi-model ensemble mean through the test of long-term trend and abrupt change of annual average, maximum and minimum air temperature in the Kaidu-Kongqi River Basin over the period of 1950-2005 by using the methods of linear trend calculation, moving average, Mann-Kendall (M-K) test and moving T-test (MMT). Results show that (1) 12 of 32 models are capable of reproducing the significant warming trend of three temperature indicators during 1950-2005, 8 of 32 models can only simulate that of some temperature indicators, but all of them underestimate the warming rate, so does the multi-model ensemble mean. (2) Most models failed to simulate the time of abrupt change accurately except two, FIO-ESM and MPI-ESM-MR. The ensemble mean of preferred models, PM-PLS and PM-EE, are superior to the individual model in simulating abrupt change. Between them, PM-PLS is better. (3) The further evaluation indicates that the multi-model ensemble PM-PLS can better capture the linear trend of spatio-temporal characteristics, but the problem of underestimating the warming rate still exists. It appeals to strengthen the study of model optimum selection and multiple models assemble in the future climate prediction using climate models.
Evaluation of extreme temperatures over Australia in the historical simulations of CMIP5 and CMIP6 models
[J].
IPCC AR5全球气候模式对1996—2005年中国气温模拟精度评价
[J].
DOI:10.18306/dlkxjz.2015.10.003
[本文引用: 1]
本文利用中国660个站点逐日地面温度资料,评估了参与政府间气候变化专门委员会第五次报告(IPCC AR5)的9个全球气候模式(Global Climate Models, GCMs)及多模式集合(Multi-Model Ensemble, MME)对中国地区气温的模拟精度。结果表明:9个IPCC AR5全球气候模式和MME模拟的中国地区1996-2005年日平均气温与气象站点观测值的相关系数都大于0.86,表明相关性较好;气候模式模拟的中国东南部地区1996-2005年日平均气温的模拟精度较高,模拟值的偏差、平均相对误差、平均绝对误差和均方根误差都比较小;而西部地区的模拟效果较差,模拟精度较低。综合考虑模式模拟值与站点观测值的相关系数、偏差、平均相对误差、平均绝对误差和均方根误差发现,MME在中国地区的气温模拟精度优于大部分单个模式。
Assesment on precision of temperature simulated by the IPCC AR5 GCMs in China, 1996-2005
DOI:10.18306/dlkxjz.2015.10.003
[本文引用: 1]
This article evaluates the precision of the temperature simulated by nine IPCC AR5 (the Fifth Assessment Report of the Intergovernmental Panel on Climate Change) GCMs (Global Climate Models) and the multi-model ensemble (MME), based on the observed temperature of 660 stations in China from 1996 to 2005. The results show that the correlation coefficients between the average daily temperature simulated by GCMs and station observations in China during 1996-2005 were very high, all above 0.86. The precision of the simulated average daily temperature in the southeast by the 10 models was higher than that in the west, judged by the lower Biases, mean relative errors (MREs), mean absolute errors (MAEs), and root mean square errors (RMSEs) in the southeast as compared to those in the west. The precision of the simulated temperature by IPSL-CM5A-LR, MRI-CGCM3, and NorESM1-M was poorer than that of the others—specially, the Biases, MREs, and RMSEs of the simulation result by IPSL-CM5A-LR, the Biases and RMSEs of the simulation result by MRI-CGCM3, and MREs and RMSEs of the simulation result by NorESM1-M, were larger. Taken into account the Biases, MREs, MAEs, and RMSEs, the simulation precision of MME was the highest.
Eastern North Pacific tropical cyclone activity in historical and future CMIP5 experiments: Assessment with a model-independent tracking scheme
[J].DOI:10.1007/s00382-019-04830-0 [本文引用: 1]
Evaluation of ocean biogeochemistry and carbon cycling in CMIP earth system models with the International Ocean Model Benchmarking (IOMB) software system
[J].
Future surface temperatures over Europe according to CMIP6 climate projections: An analysis with original and bias-corrected data
[J].
Assessment of CMIP5 climate models and projected temperature changes over Northern Eurasia
[J].
Assessment of precipitation and temperature data from CMIP3 global climate models for hydrologic simulation
[J].
DOI:10.5194/hess-19-361-2015
URL
[本文引用: 1]
. The objective of this paper is to identify better performing Coupled Model Intercomparison Project phase 3 (CMIP3) global climate models (GCMs) that reproduce grid-scale climatological statistics of observed precipitation and temperature for input to hydrologic simulation over global land regions. Current assessments are aimed mainly at examining the performance of GCMs from a climatology perspective and not from a hydrology standpoint. The performance of each GCM in reproducing the precipitation and temperature statistics was ranked and better performing GCMs identified for later analyses. Observed global land surface precipitation and temperature data were drawn from the Climatic Research Unit (CRU) 3.10 gridded data set and re-sampled to the resolution of each GCM for comparison. Observed and GCM-based estimates of mean and standard deviation of annual precipitation, mean annual temperature, mean monthly precipitation and temperature and Köppen–Geiger climate type were compared. The main metrics for assessing GCM performance were the Nash–Sutcliffe efficiency (NSE) index and root mean square error (RMSE) between modelled and observed long-term statistics. This information combined with a literature review of the performance of the CMIP3 models identified the following better performing GCMs from a hydrologic perspective: HadCM3 (Hadley Centre for Climate Prediction and Research), MIROCm (Model for Interdisciplinary Research on Climate) (Center for Climate System Research (The University of Tokyo), National Institute for Environmental Studies, and Frontier Research Center for Global Change), MIUB (Meteorological Institute of the University of Bonn, Meteorological Research Institute of KMA, and Model and Data group), MPI (Max Planck Institute for Meteorology) and MRI (Japan Meteorological Research Institute). The future response of these GCMs was found to be representative of the 44 GCM ensemble members which confirms that the selected GCMs are reasonably representative of the range of future GCM projections.
Evaluation of temperature and precipitation trends and long-term persistence in CMIP5 twentieth-century climate simulations
[J].
DOI:10.1175/JCLI-D-12-00259.1
URL
[本文引用: 2]
The authors have analyzed twentieth-century temperature and precipitation trends and long-term persistence from 19 climate models participating in phase 5 of the Coupled Model Intercomparison Project (CMIP5). This study is focused on continental areas (60°S–60°N) during 1930–2004 to ensure higher reliability in the observations. A nonparametric trend detection method is employed, and long-term persistence is quantified using the Hurst coefficient, taken from the hydrology literature. The authors found that the multimodel ensemble–mean global land–average temperature trend (0.07°C decade−1) captures the corresponding observed trend well (0.08°C decade−1). Globally, precipitation trends are distributed (spatially) at about zero in both the models and in the observations. There are large uncertainties in the simulation of regional-/local-scale temperature and precipitation trends. The models’ relative performances are different for temperature and precipitation trends. The models capture the long-term persistence in temperature reasonably well. The areal coverage of observed long-term persistence in precipitation is 60% less (32% of land area) than that of temperature (78%). The models have limited capability to capture the long-term persistence in precipitation. Most climate models underestimate the spatial variability in temperature trends. The multimodel ensemble–average trend generally provides a conservative estimate of local/regional trends. The results of this study are generally not biased by the choice of observation datasets used, including Climatic Research Unit Time Series 3.1; temperature data from Hadley Centre/Climatic Research Unit, version 4; and precipitation data from Global Historical Climatology Network, version 2.
Global surface air temperatures in CMIP6: historical performance and future changes
[J].Surface air temperature outputs from 16 global climate models participating in the sixth phase of the coupled model intercomparison project (CMIP6) were used to evaluate agreement with observations over the global land surface for the period 1901–2014. Projections of multi-model mean under four different shared socioeconomic pathways were also examined. The results reveal that the majority of models reasonably capture the dominant features of the spatial variations in observed temperature with a pattern correlation typically greater than 0.98, but with large variability across models and regions. In addition, the CMIP6 mean can capture the trends of global surface temperatures shown by the observational data during 1901–1940 (warming), 1941–1970 (cooling) and 1971–2014 (rapid warming). By the end of the 21st century, the global temperature under different scenarios is projected to increase by 1.18 °C/100 yr (SSP1-2.6), 3.22 °C/100 yr (SSP2-4.5), 5.50 °C/100 yr (SSP3-7.0) and 7.20 °C/100 yr (SSP5-8.5), with greater warming projected over the high latitudes of the northern hemisphere and weaker warming over the tropics and the southern hemisphere. Results of probability density distributions further indicate that large increases in the frequency and magnitude of warm extremes over the global land may occur in the future.
Robustness of CMIP6 historical global mean temperature simulations: Trends, long-term persistence, autocorrelation, and distributional shape
[J].
How well do coupled models simulate today's climate?
[J].DOI:10.1175/BAMS-89-3-303 URL [本文引用: 1]
Quantifying progress across different CMIP phases with the ESMValTool
[J].
CMIP5 and CMIP6 model projection comparison for hydrological impacts over North America
[J].
Evaluation of CMIP5 climate models using historical surface air temperatures in central Asia
[J].Using historical data compiled by the Climate Research Unit, spatial and temporal analysis, trend analysis, empirical orthogonal function (EOF) analysis, and Taylor diagram analysis were applied to test the ability of 24 Coupled Model Intercomparison Project Phase 5 (CMIP5) climate models to accurately simulate the annual mean surface air temperature in central Asia from the perspective of the average climate state and climate variability. Results show that each model can reasonably capture the spatial distribution characteristics of the surface air temperature in central Asia but cannot accurately describe the regional details of climate change impacts. Some of the studied models, including CNRM-CM5, GFDL-CM3, and GISS-E2-H, could better simulate the high- and low-value centers and the contour distribution of the surface air temperature. Taylor diagram analysis showed that the root mean square errors of all models were less than 3, the standard deviations were between 8.36 and 13.45, and the spatial correlation coefficients were greater than 0.96. EOF analysis showed that the multi-model ensemble can accurately reproduce the surface air temperature characteristics in central Asia from 1901 to 2005, including the rising periods and the fluctuations of the north and south inversion phases. Overall, this study provides a valuable reference for future climate prediction studies in central Asia.
Climate extremes indices in the CMIP5 multimodel ensemble: Part 1. Model evaluation in the present climate
[J].DOI:10.1002/jgrd.v118.4 URL [本文引用: 2]
Comparison of CMIP6 and CMIP5 models in simulating climate extremes
[J].DOI:10.1016/j.scib.2020.05.015 PMID:36747394 [本文引用: 1]
基于CMIP6的中国主要地区极端气温/降水模拟能力评估及未来情景预估
[J].
Projection and evaluation of extreme temperature and precipitation in major regions of China by CMIP6 models
CMIP6全球气候模式对中国年平均日最高气温和最低气温模拟的评估
[J].
Evaluation on CMIP6 global climate model simulation of the annual mean daily maximum and minimum air temperature in China
IPCC-AR4全球气候模式在华东区域气候变化的预估能力评价与不确定性分析
[J].
Simulation evaluation and uncertainty analysis for climate change projections in east China made by IPCC-AR4 Models
DOI:10.11820/dlkxjz.2010.07.007
[本文引用: 1]
<p>In this paper, the climate change projections in East China made by the climate models in the IPCC-AR4 were assessed by simulation evaluation and uncertainty analysis. By comparing individual simulation of the 21 IPCC AR4 models with the observations and with each other as well, it is demonstrated that the simulation abilities of different models vary widely. Only models of NCAR-CCSM3 and MRI-CGCM2.3.2 have small root mean square errors for both temperature and precipitation simulations in East China. It has been shown that, under the scenario A1B, multi-model ensemble mean can fairly well illustrate the spatial patterns of annual mean temperature and precipitation. Nevertheless, it can hardly reflect local fine structure of the distributions because of their low spatial resolutions. Moreover, there is a significant systematic deviation in multi-model ensemble mean for temperature projection. It underestimates the annual mean temperature by more than 1.6℃, and the difference between simulation and observation exceeds the extent of the uncertainty which is defined by one-fold standard deviation of inter-models’ simulations. The standard deviation of annual precipitation is up to 26.7% of the multi-model ensemble mean. Therefore it would be quite questionable if IPCC-AR4 multi-model ensemble means of temperature and precipitation in East China are directly used as climate change projection.</p>
CMIP5全球气候模式对中国黄河流域气候模拟能力的评估
[J].
Assessing CMIP5 climate simulations and objective selection of models over the Yellow River Basin
Surface air temperature simulations over China with CMIP5 and CMIP3
[J].DOI:10.3724/SP.J.1248.2013.145 URL [本文引用: 1]
Comparative analysis of CMIP3 and CMIP5 global climate models for simulating the daily mean, maximum, and minimum temperatures and daily precipitation over China
[J].DOI:10.1002/2014JD022994 URL [本文引用: 1]
Does CMIP6 inspire more confidence in simulating climate extremes over China?
[J].DOI:10.1007/s00376-020-9289-1 [本文引用: 3]
CMIP6模式对青藏高原气候的模拟能力评估与预估研究
[J].
DOI:10.7522/j.issn.1000-0534.2021.zk003
[本文引用: 1]
利用国际耦合模式比较计划第六阶段(CMIP6)模拟试验数据, 首先评估了45个全球气候模式对1985 -2014年青藏高原地表气温和降水的模拟能力, 表明CMIP6模式能合理地模拟地表气温的空间分布, 但大部分模式对年和季节平均地表气温的模拟值偏低, 年均偏冷2.1 ℃, 冷偏差在冬季和春季相对更大。CMIP6模式对青藏高原降水的模拟能力较为有限, 尽管它们能模拟出年均降水东多西少的空间分布特征, 但普遍存在高估, 尤其是在春季和夏季, 年均降水较观测偏多397.8 mm·a<sup>-1</sup>。基于模拟性能较好的模式, 相比于1995 -2014年, 在共享社会经济路径(SSPs)中等偏低情景SSP2-4.5下, 青藏高原年均地表气温在21世纪90年代上升2.5 ℃, 2015 -2100年的线性趋势平均为0.28 ℃·(10a)<sup>-1</sup>, 其中秋季和冬季增幅更大, 高海拔区增暖幅度高于低海拔区。年均降水在21世纪90年代将增加12.8%, 2015 -2100年的线性趋势平均为1.56%·(10a)<sup>-1</sup>, 其中春季增幅最大, 高原北部边界区为降水增加的大值区。相较SSP2-4.5情景, SSP5-8.5情景下青藏高原地表气温和降水增幅更大, 21世纪90年代年均地表气温升高5.1 ℃, 降水增加30.2%, 两者在2015 -2100年的线性趋势平均分别为0.64 ℃·(10a)<sup>-1</sup>和3.80%·(10a)<sup>-1</sup>。整体上, 模式对地表气温和降水预估结果的不确定性均随时间增大。
Evaluation and projection of CMIP6 models for climate over the Qinghai-Xizang (Tibetan) Plateau
基于CMIP6模式的黄河上游地区未来气温模拟预估
[J].
DOI:10.7522/j.issn.1000-0240.2022.0028
[本文引用: 1]
利用第六次国际耦合模式比较计划(CMIP6)提供的5个气候模式,并结合基于地面气象站的CN05.1气象资料,评估了CMIP6模式对黄河上游地区1961—2014年气温变化的模拟能力。基于7个共享社会经济路径及代表性浓度路径(SSP-RCP)组合情景,结合多模式集合平均预估了2015—2100年黄河上游地区年均气温和季平均气温的时空变化规律。结果表明:多模式集合平均能较好地模拟黄河上游地区历史平均气温的空间分布格局与年变化。7个未来情景一致表明,2015—2100年黄河上游地区年平均气温呈现波动上升趋势[0.03~0.82 ℃?(10a)<sup>-1</sup>]。其中,低辐射强迫情景下(SSP1-1.9、SSP1-2.6及SSP4-3.4)气温先呈现增加趋势,21世纪中期到达增幅峰值,之后增温呈现放缓趋势;而中、高辐射强迫情景下(SSP2-4.5、SSP3-7.0、SSP4-6.0及SSP5-8.5)气温表现为持续上升态势。空间上,未来气温增幅显著的区域位于黄河上游西部地区;时间上,呈现夏季增温快,春季增温慢。四季增温的空间分布呈现出一致特征,表现为西部增温强于东部,北部增温强于南部。研究结果可为黄河流域水资源管理及气候变化的适应性研究提供科学依据。
Simulation and estimation of future air temperature in upper basin of the Yellow River based on CMIP6 models
DOI:10.7522/j.issn.1000-0240.2022.0028
[本文引用: 1]
Five global climate models from the latest released Coupled Model Intercomparison Project Phase 6 (CMIP6) and CN05.1 meteorological data are applied to evaluate annual air temperature variations in upper basin of the Yellow River from 1961 to 2014. This study focuses on characterizing the spatiotemporal and annual variations of air temperature across upper basin of the Yellow River under seven future scenarios, combing the shared socioeconomic pathways and the representative concentration pathways (SSP1-1.9, SSP1-2.6, SSP2-4.5, SSP3-7.0, SSP4-3.4, SSP4-6.0 and SSP5-8.5). The simulation capability of CMIP6 outputs are evaluated during the historical period (1961—2014). We find that: Multi-model ensemble mean provides good results in characterizing spatial distribution and annual variations of air temperature dynamics across the study area. The average air temperature shows a significant upward trend [0.03~0.82 ℃?(10a)-1] under all seven scenarios during 2015—2100. Air temperature increased and reached the peak till the middle 21st century, and showed a slowly increasing trend till the end of the century, under the low forcing scenarios (SSP1-1.9, SSP1-2.6 and SSP4-3.4). Under the mid and high forcing scenarios (SSP2-4.5, SSP3-7.0, SSP4-6.0 and SSP5-8.5), the annual mean air temperature showed a continuous rising trend. Regions featured with highest temperature increasing located in western part of upper basin of the Yellow River. Air temperature in summer will rise in a relatively fast speed, while that in spring is slower. Patterns of seasonal air temperature rising shows an obvious spatial distribution, relatively fast in west and slow in east, fast in north and slow in south. In the context of global warming, a reasonable estimation of the future air temperature changes in upper basin of the Yellow River is crucial for the water resources management and study on adaptions to climate change.
基于CMIP6气候模式的华北平原极端气温指数评估和预测
[J].
Evaluation and projection of extreme temperature indices in the North China Plain based on CMIP6 models
Assessment of GCMs simulation performance for precipitation and temperature from CMIP5 to CMIP6 over the Tibetan Plateau
[J].DOI:10.1002/joc.v41.7 URL [本文引用: 1]
CMIP6不同分辨率全球气候模式对中国降水模拟能力评估
[J].
Evaluation on the performance of CMIP6 global climate models with different horizontal resolution in simulating the precipitation over China
Precipitation characteristics in eighteen coupled climate models
[J].
DOI:10.1175/JCLI3884.1
URL
[本文引用: 1]
Monthly and 3-hourly precipitation data from twentieth-century climate simulations by the newest generation of 18 coupled climate system models are analyzed and compared with available observations. The characteristics examined include the mean spatial patterns, intraseasonal-to-interannual and ENSO-related variability, convective versus stratiform precipitation ratio, precipitation frequency and intensity for different precipitation categories, and diurnal cycle. Although most models reproduce the observed broad patterns of precipitation amount and year-to-year variability, models without flux corrections still show an unrealistic double-ITCZ pattern over the tropical Pacific, whereas the flux-corrected models, especially the Meteorological Research Institute (MRI) Coupled Global Climate Model (CGCM; version 2.3.2a), produce realistic rainfall patterns at low latitudes. As in previous generations of coupled models, the rainfall double ITCZs are related to westward expansion of the cold tongue of sea surface temperature (SST) that is observed only over the equatorial eastern Pacific but extends to the central Pacific in the models. The partitioning of the total variance of precipitation among intraseasonal, seasonal, and longer time scales is generally reproduced by the models, except over the western Pacific where the models fail to capture the large intraseasonal variations. Most models produce too much convective (over 95% of total precipitation) and too little stratiform precipitation over most of the low latitudes, in contrast to 45%–65% in convective form in the Tropical Rainfall Measuring Mission (TRMM) satellite observations. The biases in the convective versus stratiform precipitation ratio are linked to the unrealistically strong coupling of tropical convection to local SST, which results in a positive correlation between the standard deviation of Niño-3.4 SST and the local convective-to-total precipitation ratio among the models. The models reproduce the percentage of the contribution (to total precipitation) and frequency for moderate precipitation (10–20 mm day−1), but underestimate the contribution and frequency for heavy (&gt;20 mm day−1) and overestimate them for light (&lt;10 mm day−1) precipitation. The newest generation of coupled models still rains too frequently, mostly within the 1–10 mm day−1 category. Precipitation intensity over the storm tracks around the eastern coasts of Asia and North America is comparable to that in the ITCZ (10–12 mm day−1) in the TRMM data, but it is much weaker in the models. The diurnal analysis suggests that warm-season convection still starts too early in these new models and occurs too frequently at reduced intensity in some of the models. The results show that considerable improvements in precipitation simulations are still desirable for the latest generation of the world’s coupled climate models.
Simulated tropical precipitation assessed across three major phases of the Coupled Model Intercomparison Project (CMIP)
[J].
DOI:10.1175/MWR-D-19-0404.1
URL
[本文引用: 1]
The representation of tropical precipitation is evaluated across three generations of models participating in phases 3, 5, and 6 of the Coupled Model Intercomparison Project (CMIP). Compared to state-of-the-art observations, improvements in tropical precipitation in the CMIP6 models are identified for some metrics, but we find no general improvement in tropical precipitation on different temporal and spatial scales. Our results indicate overall little changes across the CMIP phases for the summer monsoons, the double-ITCZ bias, and the diurnal cycle of tropical precipitation. We find a reduced amount of drizzle events in CMIP6, but tropical precipitation occurs still too frequently. Continuous improvements across the CMIP phases are identified for the number of consecutive dry days, for the representation of modes of variability, namely, the Madden–Julian oscillation and El Niño–Southern Oscillation, and for the trends in dry months in the twentieth century. The observed positive trend in extreme wet months is, however, not captured by any of the CMIP phases, which simulate negative trends for extremely wet months in the twentieth century. The regional biases are larger than a climate change signal one hopes to use the models to identify. Given the pace of climate change as compared to the pace of model improvements to simulate tropical precipitation, we question the past strategy of the development of the present class of global climate models as the mainstay of the scientific response to climate change. We suggest the exploration of alternative approaches such as high-resolution storm-resolving models that can offer better prospects to inform us about how tropical precipitation might change with anthropogenic warming.
Added value of CMIP6 over CMIP5 models in simulating Indian summer monsoon rainfall
[J].
Evaluation of CMIP6 HighResMIP models in simulating precipitation over Central Asia
[J].DOI:10.1016/j.accre.2021.09.009 URL [本文引用: 1]
CMIP6高分辨率模式比较计划(HighResMIP)概况与评述
[J].
Short commentary on CMIP6 High Resolution Model Intercomparison Project (HighResMIP)
Monsoonal precipitation over Peninsular Malaysia in the CMIP6 HighResMIP experiments: the role of model resolution
[J].
DOI:10.1007/s00382-021-06033-y
[本文引用: 1]
This study investigates the ability of 20 model simulations which contributed to the CMIP6 HighResMIP to simulate precipitation in different monsoon seasons and extreme precipitation events over Peninsular Malaysia. The model experiments utilize common forcing but are run with different horizontal and vertical resolutions. The impact of resolution on the models’ abilities to simulate precipitation and associated environmental fields is assessed by comparing multi-model ensembles at different resolutions with three observed precipitation datasets and four climate reanalyses. Model simulations with relatively high horizontal and vertical resolution exhibit better performance in simulating the annual cycle of precipitation and extreme precipitation over Peninsular Malaysia and the coastal regions. Improvements associated with the increase in horizontal and vertical resolutions are also found in the statistical relationship between precipitation and monsoon intensity in different seasons. However, the increase in vertical resolution can lead to a reduction of annual mean precipitation compared to that from the models with low vertical resolutions, associated with an overestimation of moisture divergence and underestimation of lower-tropospheric vertical ascent in the different monsoon seasons. This limits any improvement in the simulation of precipitation in the high vertical resolution experiments, particularly for the Southwest monsoon season.
Projected future changes in tropical cyclones using the CMIP6 HighResMIP multimodel ensemble
[J].
Evaluation of precipitation and temperature simulation performance of the CMIP3 and CMIP5 historical experiments
[J].DOI:10.1007/s00382-015-2938-x URL [本文引用: 1]
Evaluation of the CMIP6 multi-model ensemble for climate extreme indices
[J].
全球气候模式对中国降水分布时空特征的评估和预估
[J].
Assessment and projection for spatial-temporal distribution of precipitation in China based on global climate models
CMIP6模式水平分辨率对模拟我国西南地区夏季极端降水的影响评估
[J].
DOI:10.7522/j.issn.1000-0534.2021.zk010
[本文引用: 1]
我国西南地区的地形地貌非常复杂, 当前的气候模式对该地区降水状况特别是极端降水的模拟技巧是比较低的。本文基于台站和卫星观测的逐日降水资料以及欧洲中心第五代再分析(ERA5)降水资料, 通过与CMIP6高分辨率模式比较计划(HighResMIP)中的12个模式高、 低分辨率模拟结果的对比分析, 评估了当前气候模式对西南地区夏季降水的模拟性能特别是模式水平分辨率对极端降水模拟的影响。结果表明: (1)在夏季降水气候态方面, 各HighResMIP模式模拟与台站观测之间的空间相关系数均超过0.75, 总体性能较CMIP5有明显提升, 但仍有超过半数模式明显低估了四川盆地降水。模式分辨率提高使横断山脉地形陡峭区的降水空间分布和强度更接近观测和ERA5资料, 但对四川盆地降水的改进效果不佳。(2)在夏季极端降水方面, HighResMIP模式对极端降水频率和强度模拟差异较大。CNRM-CM6、 FGOALS-f3、 GFDL和HadGEM-GC31等4个模式对极端降水的各项指标模拟总体较好, 但受气候态模拟偏差影响, 前三者模拟的极端降水在四川盆地偏弱, 而HadGEM-GC31在广西明显偏强。ECMWF-IFS、 EC-Earth3P、 IPSL-CM6A、 MPI-ESM1-2和MRI-AGCM3-2等5个模式中极端降水发生频率明显偏低。提高分辨率可以一定程度改进降水强度的模拟, 主要体现在提高地形陡峭区的降水强度, 但对地形平坦区如四川盆地降水强度改进不大。
An evaluation for impacts of the horizontal resolution of CMIP6 models on simulating extreme summer rainfall over Southwest China
DOI:10.7522/j.issn.1000-0534.2021.zk010
[本文引用: 1]
Due to complex topography in Southwest China (SWC), state-of-the-art climate models cannot capture sufficiently the distribution and intensity of summer precipitation, especially extreme rainfall (ER) over SWC.Thus, this study is to evaluate how well the current climate models could reproduce the climate mean summer precipitation and to what extend the horizontal resolutions might impact the ER simulations over SWC, based on daily rain-gauge station-observed, satellite-observed and ERA5-reanalysed rainfall datasets and 12 models available from CMIP6 High-Resolution Model Inter-comparison Project (HighResMIP).Each HighResMIP model contains one high-resolution and one low-resolution simulation with the same suite of physical processes and external forcing.Results show that almost all models can reproduce the climate-mean state of summer rainfall over SWC, with an area correlation coefficient (ACC) greater than 0.75 between the rain-gauge observed rainfall and simulated rainfall by each model.Over, the performance of CMIP6 HighResMIP models is better than that of CMIP5 models, but over half of the CMIP6 HighResMIP models still underestimate the summer rain amount over the Sichuan Basin.As the model resolution increased, the intensity and spatial pattern of the simulated summer rainfall over the Hengduan mountains are much closer to the observational dataset, especially to the ERA5 reanalysis.However, the underestimating biases over Sichuan Basin are not improved obviously with a higher horizontal resolution.In terms of ER, large spreads exist in the ER intensity and occurrence frequency over SWC among CMIP6 HighResMIP models.The four models, including CNRM-CM6、 FGOALS-f3、 GFDL-CM4 and HadGEM-GC31, exhibit better performances in capturing ER days and percentage.Even so, the first three of the above four models underestimate the ER days over SWC, but HadGEM-GC31 overestimates ER intensity over Guangxi Province.In contrast, the ER frequency is much lower than that of observation in the models ECMWF-IFS, EC-Earth3P, IPSL-CM6A, MPI-ESM1-2 and MRI-AGCM3-2.The higher resolution simulations can improve the simulation in the rainfall intensity to a certain degree, manifesting mainly in enhancing the rainfall intensity over the mountainous region rather than the flat-terrain area such as the Sichuan Basin.
Climate change 2021: The physical science basis
[M].
Assessing surface solar radiation fluxes in the CMIP ensembles
[J].
DOI:10.1175/JCLI-D-14-00503.1
URL
[本文引用: 1]
Earth system models are indispensable tools in climate studies. The Coupled Model Intercomparison Project (CMIP) is a coordinated effort of the Earth system modeling community to intercompare existing models. An accurate simulation of surface solar radiation fluxes is of major importance for the accuracy of simulations of the near-surface climate in Earth system models. The present study provides a quantitative assessment of the accuracy and multidecadal changes of surface solar radiation fluxes for model results from two phases of CMIP. The entire archives of phase 5 of CMIP (CMIP5) and its predecessor phase 3 (CMIP3) are analyzed for present-day climate conditions. A relative model ranking is provided, and its uncertainty is quantified using different global observational records. It is shown that the choice of an observational dataset can have a major influence on relative model ranking between CMIP models. However the multidecadal variability of surface solar radiation fluxes, also known as global “dimming” or “brightening,” is largely underestimated by the CMIP models.
An evaluation of the CMIP3 and CMIP5 simulations in their skill of simulating the spatial structure of SST variability
[J].DOI:10.1007/s00382-014-2154-0 URL [本文引用: 1]
Evaluation of CMIP3 and CMIP5 wind stress climatology using satellite measurements and atmospheric reanalysis products
[J].
DOI:10.1175/JCLI-D-12-00591.1
URL
[本文引用: 1]
Wind stress measurements from the Quick Scatterometer (QuikSCAT) satellite and two atmospheric reanalysis products are used to evaluate the annual mean and seasonal cycle of wind stress simulated by phases 3 and 5 of the Coupled Model Intercomparison Project (CMIP3 and CMIP5). The ensemble CMIP3 and CMIP5 wind stresses are very similar to each other. Generally speaking, there is no significant improvement of CMIP5 over CMIP3. The CMIP ensemble–average zonal wind stress has eastward biases at midlatitude westerly wind regions (30°–50°N and 30°–50°S, with CMIP being too strong by as much as 55%), westward biases in subtropical–tropical easterly wind regions (15°–25°N and 15°–25°S), and westward biases at high-latitude regions (poleward of 55°S and 55°N). These biases correspond to too strong anticyclonic (cyclonic) wind stress curl over the subtropical (subpolar) ocean gyres, which would strengthen these gyres and influence oceanic meridional heat transport. In the equatorial zone, significant biases of CMIP wind exist in individual basins. In the equatorial Atlantic and Indian Oceans, CMIP ensemble zonal wind stresses are too weak and result in too small of an east–west gradient of sea level. In the equatorial Pacific Ocean, CMIP zonal wind stresses are too weak in the central and too strong in the western Pacific. These biases have important implications for the simulation of various modes of climate variability originating in the tropics. The CMIP as a whole overestimate the magnitude of seasonal variability by almost 50% when averaged over the entire global ocean. The biased wind stress climatologies in CMIP not only have implications for the simulated ocean circulation and climate variability but other air–sea fluxes as well.
Evaluation of soil moisture in CMIP6 simulations
[J].
DOI:10.1175/JCLI-D-20-0827.1
URL
[本文引用: 1]
This study employs multiple reanalysis datasets to evaluate the global shallow and deep soil moisture in Coupled Model Intercomparison Project phase 6 (CMIP6) simulations. The multimodel ensemble mean produces generally reasonable simulations for overall climatology, wet and dry centers, and annual peaks in the melt season at mid- to high latitudes and the rainy season at low latitudes. The simulation capability for shallow soil moisture depends on the relationship between soil moisture and the difference between precipitation and evaporation (P − E). Although most models produce effective simulations in regions where soil moisture is significantly related to the P − E (e.g., Europe, low-latitude Asia, and the Southern Hemisphere), considerable discrepancies between simulated conditions and reanalysis data occur at high elevations and latitudes (e.g., Siberia and the Tibetan Plateau), where cold-season processes play a driving role in soil moisture variability. These discrepancies reflect the lack of information concerning the thaw of snow and frozen ground in the reanalyzed data and the inability of models to simulate these processes. The models also perform poorly in areas of extreme aridity. On a global scale, the majority of models provide consistent and capable simulations owing to the minimal variability in deep soil moisture and limited observational information in reanalysis data. Models with higher spatial resolution do not exhibit closer agreement with the reanalysis data, indicating that spatial resolution is not the first limiting factor for CMIP6 soil moisture simulations.
CMIP5模式对中国近海海表温度的模拟及预估
[J].
Evaluation and projection of SST in the China seas from CMIP5
Systematic land climate and evapotranspiration biases in CMIP5 simulations
[J].[1] Land climate is important for human population since it affects inhabited areas. Here we evaluate the realism of simulated evapotranspiration (ET), precipitation, and temperature in the CMIP5 multimodel ensemble on continental areas. For ET, a newly compiled synthesis data set prepared within the Global Energy and Water Cycle Experiment-sponsored LandFlux-EVAL project is used. The results reveal systematic ET biases in the Coupled Model Intercomparison Project Phase 5 (CMIP5) simulations, with an overestimation in most regions, especially in Europe, Africa, China, Australia, Western North America, and part of the Amazon region. The global average overestimation amounts to 0.17 mm/d. This bias is more pronounced than in the previous CMIP3 ensemble (overestimation of 0.09 mm/d). Consistent with the ET overestimation, precipitation is also overestimated relative to existing reference data sets. We suggest that the identified biases in ET can explain respective systematic biases in temperature in many of the considered regions. The biases additionally display a seasonal dependence and are generally of opposite sign (ET underestimation and temperature overestimation) in boreal summer (June-August).
Evaluation and projection of surface wind speed over China based on CMIP6 GCMs
[J].
青藏高原CMIP6土壤湿度适用性评估
[J].
Applicability evaluation of soil moisture from CMIP6 in Tibetan Plateau
CMIP6模式对青藏高原多年冻土变化的分析预估
[J].DOI:10.7522/j.issn.1000-0534.2022.00009 [本文引用: 1]
Analysis and prediction of permafrost changes in Qinghai-Xizang Plateau by CMIP6 climate models
DOI:10.7522/j.issn.1000-0534.2022.00009 [本文引用: 1]
Regional dynamical downscaling and the CORDEX initiative
[J].DOI:10.1146/energy.2015.40.issue-1 URL [本文引用: 1]
