国际耦合模式比较计划及其模拟能力研究进展
Coupled Model Intercomparison Project and its research progress in simulation performance
注:引自IPCC AR6第一工作组报告[
国际耦合模式比较计划及其模拟能力研究进展 |
| 范雪薇, 缪驰远, 苟娇娇, 吴怡, 张棋 |
|
Coupled Model Intercomparison Project and its research progress in simulation performance |
| FAN Xuewei, MIAO Chiyuan, GOU Jiaojiao, WU Yi, ZHANG Qi |
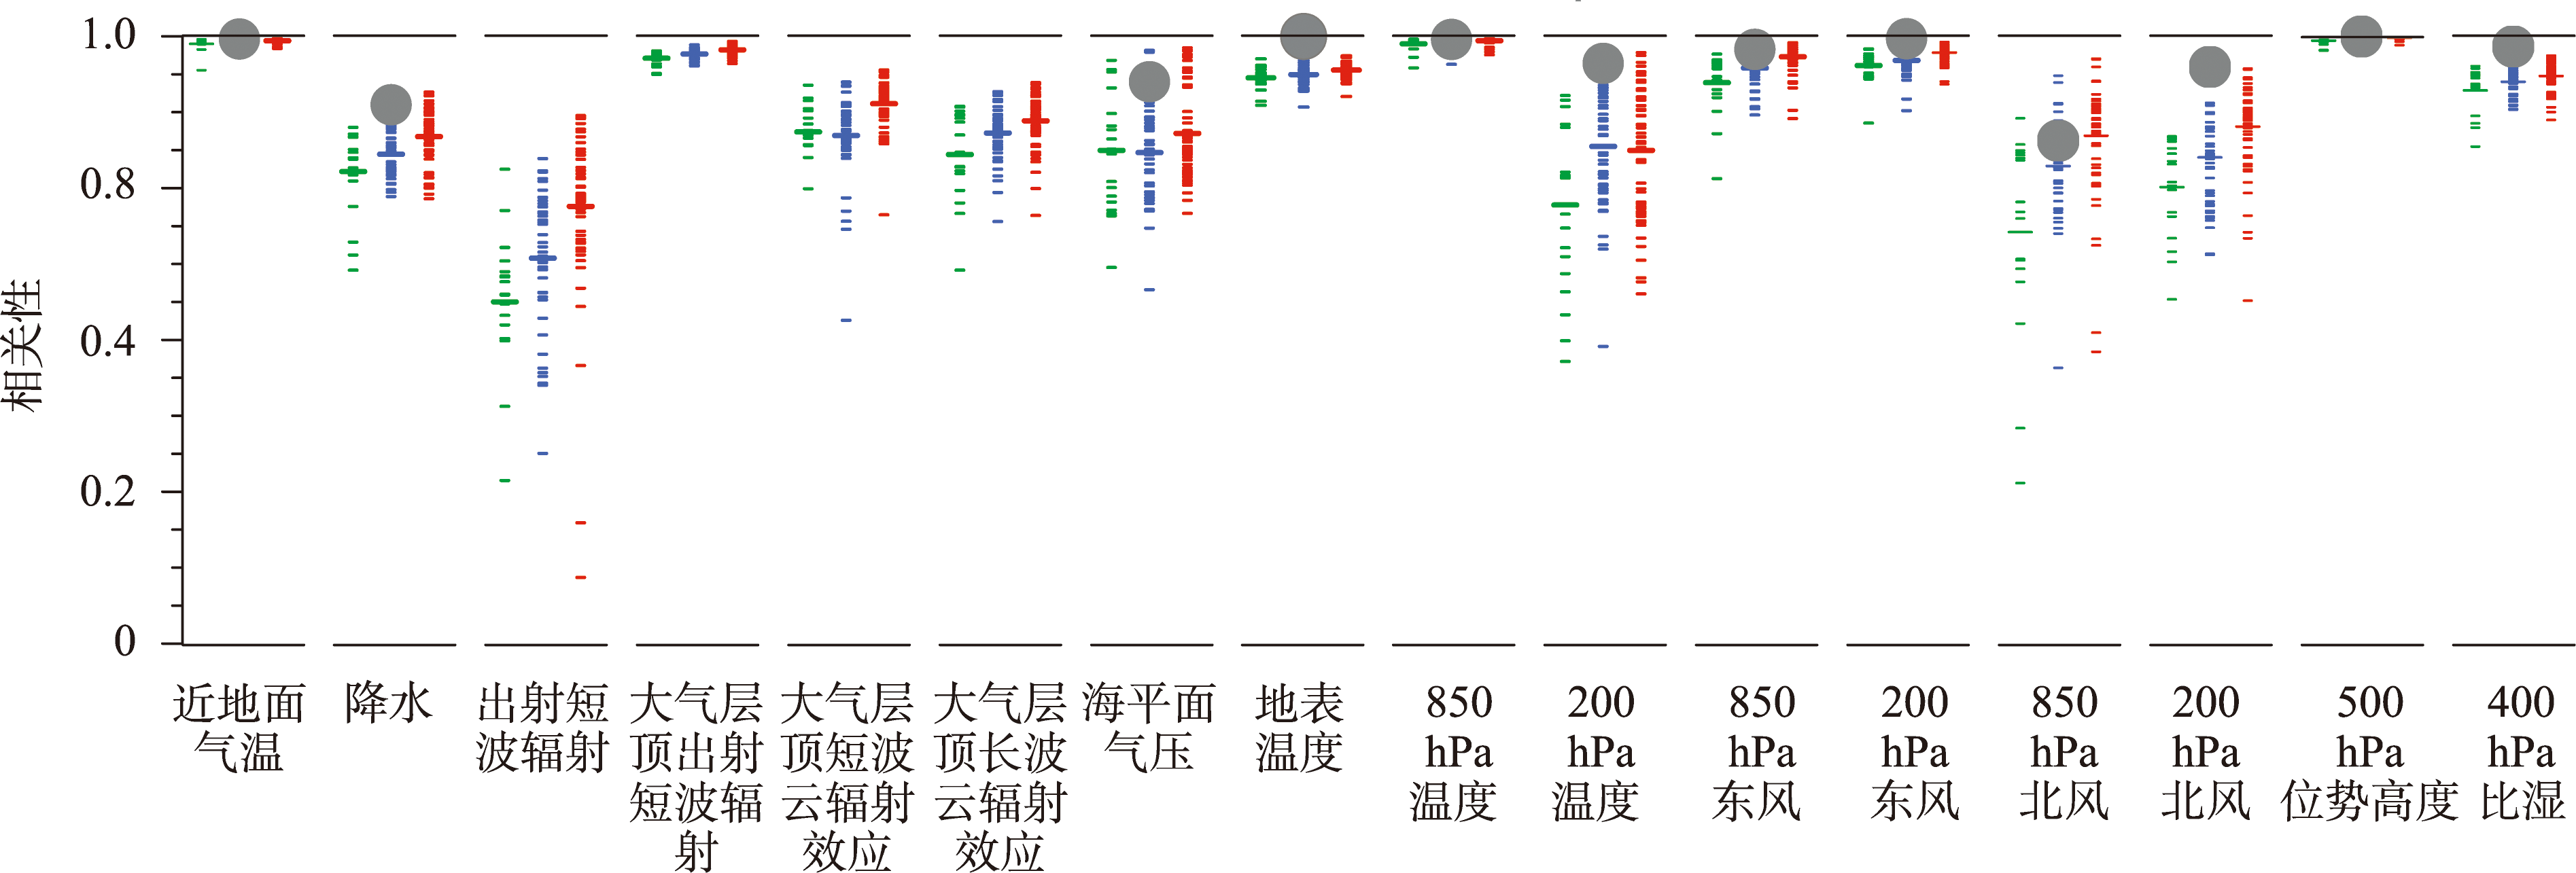
| 图3 1980—1999年模式年均气候态和观测年均气候态间的中心化相关系数 注:引自IPCC AR6第一工作组报告[ |
| Fig.3 Centred pattern correlations between models and observations for the annual mean climatology over the period 1980-1999 |
|
|