

2021年9月习近平总书记在中央人才工作会议强调“深入实施新时代人才强国战略,全方位培养、引进、用好人才,加快建设世界重要人才中心和创新高地”,人才已经成为中国科技创新和经济高质量增长的核心生产要素。为抢抓经济转型和人才红利的先机,2017年初以来,全国70%的城市密集出台了人才政策[1],吸引大专及以上学历的青年高等学历教育阶层是“抢人大战”的突出特征[2-3]。然而,许多城市仍不明确与自身产业结构、科技创新模式相匹配的需求人才类型[4],不同规模等级城市的人才引进类型高度趋同,很多中小城市引才工作存在随意性和盲目性的问题,引进人才政策对标超大城市、特大城市等经济发达城市,追求引才“高大上”,投入大量财政资金旨在引进硕士和博士等顶尖学历人才[5]。同时,面向不同学历人才的引进措施大同小异,主要集中在直接落户,以及随学历提升而阶梯式增加的安家费、生活补贴等[6]。人才集聚或流动本质上是一个经济因素和公共服务等资源配置的市场化过程,厘清中国城市不同学历人才集疏的空间分布态势,以及不同学历人才分布的影响机理的差异性,对于优化不同规模等级城市的经济高质量发展格局以及制定因类而异的人才政策具有重要意义。
人才区位选择的影响因素是人才地理学或人才经济学的主要研究领域,相关理论不断完善并呈现出多元化的趋势。早期的新古典迁移理论指出迁移是个人理性计算收入和就业机会等经济成本收益的产物[7],人才倾向迁移至高收入和就业机会充足的区域[8⇓-10]。随后,19世纪70年代Graves[11]提出了舒适性(amenities)影响人口增长和人口迁移的经典理论,认为除了收入、就业机会等经济因素,气候舒适性也是区域吸引人口的重要内在优势,并且随着收入水平的提高,家庭迁移过程中对舒适性的需求不断增加[12]。如今舒适性的涵义得到了广泛拓展,从一种身体感知上的舒适性扩充至有具体形态的人造服务设施,如学校、医院等教育医疗公共服务设施[13-14],以及咖啡厅、酒吧、电影院、图书馆等文化娱乐服务设施[15-16]。21世纪初,Florida[17]的创意阶层理论将区域人才集聚完全视为舒适性决定的过程,忽略了经济因素对人才集聚的重要作用。然而,相关理论研究仍存在两方面问题。第一,舒适性对吸引人才集聚的作用仍有待进一步讨论。一些美国和西欧学者发现人才仍主要向就业机会丰富的区域集聚,而非气候舒适宜居和文化休闲设施完善的城市[18⇓-20],中国21世纪初期的一些实证研究也表明社会服务设施及自然环境舒适性并未显著促进人才流入[9-10,21]。第二,舒适性因素框架有待进一步完善。2011年后中国局部地区开始爆发空气污染问题,一些研究表明孟加拉国等发展中国家的空气污染是其人才迁移至发达国家的重要原因[22],而空气环境质量舒适性对中国人才分布的影响仍不得而知。
20世纪末期,Birdsall等[23]提出了人力资本梯度的概念,将人力资本划分成初、中、高阶三级梯度,分别对应于小学、中学和高等教育文化程度的阶层[24⇓-26],本质上人力资本梯度就是指劳动力学历水平的高低分异,人力资本梯度升级就是劳动力受教育程度提高而导致的低阶人力资本向高阶人力资本的跃迁过程[24,26]。而具有高等学历的人才则属于人力资本梯度中的高阶人力资本,内部也存在着大专、本科、硕士和博士四级由低到高的学历梯度分异。不同学历梯度的人才具有知识技能的高低分化,产业是劳动力就业的蓄水池,产业附加值的高低分化就在劳动力市场上产生了对不同学历人才的需求差异,供需匹配的市场机制异质性形成了不同学历人才迁移决策需求偏好的差异性,进而塑造出人才地理景观的学历梯度分异特征。然而,现有大多数研究还是把高等学历人才视为一个整体[9-10,21,27⇓⇓-30],关注大专及以上学历人才的时空分布格局及其区位选择的动力机制,对不同学历人才集疏格局及影响机理差异性的研究相对薄弱。
综上,本文聚焦人才学历梯度分异的研究视角,利用中国2005、2010和2015年人口抽样调查数据资料,从地级尺度上揭示2005—2015年中国大专、本科及研究生学历人才分布的时空格局特征差异,采用空间计量模型解释不同学历人才时空分布差异的影响机理。主要回答2个问题:(1) 随着人才学历的提升,不同学历人才的时空分布格局特征有何异同点?(2) 随着人才学历的提升,不同学历人才区位选择的影响机理有何异同点?
1 研究方法和数据来源
1.1 测度指标
(1) 变异系数
式中:
(2) 全局空间自相关指数(Global Moran's I)
式中:xi、xj为地级以上行政区i、j的不同学历(大专、本科及研究生)的人才比重;wij表示第i个空间单元和第j个空间单元的位置关系;n为地级以上行政区数量;I的取值范围为[-1, 1]。若I大于0,表示人才比重分布空间正相关;若I小于0,表示人才比重分布空间负相关;若I等于0,则表示人才比重呈随机分布。Global Moran's I的显著性可以通过标准化值表达。本文中全局空间自相关指数主要用来确定不同学历人才比重分布是否具有空间依赖性,从而判定不同学历人才比重分布影响因素的计量模型选择。
1.2 计量模型
地理要素的空间依赖性导致传统OLS回归的估计有偏甚至无效,因此,本文采用空间面板模型来揭示中国不同学历人才分布的影响机理。空间面板模型主要选择空间滞后面板模型(SAR)和空间误差面板模型(SEM),对于2个模型来说,主要包括联合OLS、空间固定效应模型、时间固定效应模型以及时空固定效应模型4种模型。
空间滞后面板模型可以设定为:
式中:i为横截面维度(地级以上行政区),j为表征与i空间位置关系的地级以上行政区,i, j=1, 2, …, N; t为时间维度(本文为3);
空间误差面板模型可以设定为:
式中:
选择一般面板模型、空间滞后面板模型(SAR)和空间误差面板模型(SEM)是模型判断的重点。除了全局自相关指数检验,本文主要选用常用的LM检验[36]和稳健LM检验[37]来判断最优模型的选择。具体可以通过对比空间滞后项的LM检验统计值LM(lag)、稳健LM检验统计值R-LM(lag)、空间误差自相关的LM检验统计值LM(error)和稳健LM检验统计值R-LM(error)的显著性和大小来判定合适的模型。首先是一般面板模型和空间面板模型的选择,若LM(lag)和R-LM(lag)统计显著,表明可以拒绝一般面板模型,选择空间滞后面板模型(SAR)。若LM(error)和R-LM(error)统计显著,表明可以拒绝一般面板模型,选择空间误差面板模型(SEM)。其次是SAR和SEM的比选,若LM(error) 和R-LM(error)的统计显著性及统计值均分别高于LM(lag)和R-LM(lag),则应该选择空间误差面板模型(SEM);反之,选择空间滞后面板模型(SAR)。本文中的计量模型主要通过Elhorst的MATLAB面板模型和空间面板模型代码来运行。
1.3 数据来源
人才比重的数据处理方法如下:第一,2005年地级以上行政区的大专、本科及研究生学历劳动力数据主要来源于各省份2005年1%人口抽样调查和全国2005年1‰人口抽样调查微观数据,由于湖北、湖南、吉林、云南和西藏5个省份未公布2005年1%人口抽样调查数据资料,该5省份地级以上行政区的大专、本科及研究生学历劳动力数据主要来源于2005年1‰人口抽样调查微观数据,分别采用微观数据库中地级以上行政区的大专、本科及研究生学历劳动力样本数占劳动力总样本数的比重来代表不同学历人才的占比。但由于微观数据抽样调查比更低,加之西藏抽样调查样本数量少,那曲、林芝等西藏一些地级以上行政区的大专、本科及研究生学历劳动力样本数量为零。此外就业市场中受教育程度最高的研究生学历劳动力规模最小,加之微观数据抽样调查比率较低,进而微观数据库中5省份的一些地级以上行政区的研究生学历劳动力样本数量也为零,上述地区的相应学历的人才比重数据均做缺失处理。其余26省份的不同学历劳动力数据主要来源于各省份2005年1%人口抽样调查数据资料,与微观数据库类似,由于研究生学历劳动力总样本数最少,在1%人口抽样调查中也出现了玉树、广安等少数地级以上行政区的研究生学历劳动力样本数为零的现象,这些地区的研究生学历人才比重数据也做缺失处理。第二,2010年地级以上行政区的大专、本科及研究生学历劳动力数据主要来源于各省份2010年人口普查10%长表户抽样调查数据资料,由于抽样比相对较高,地级以上行政区不同学历劳动力数据相对最为齐全。第三,2015年地级以上行政区的大专、本科及研究生学历劳动力数据主要来源于各省份的2015年1%人口抽样调查数据资料,由于西藏未公布2015年1%人口抽样调查数据资料,西藏的地级以上行政区的大专、本科及研究生学历劳动力数据均做缺失处理。
自变量数据中,各地级以上城市的人口、产业、职工薪资、教育、医疗、交通、绿化和财政等数据主要来源于2005、2010和2015年中国城市统计年鉴,空气环境PM2.5数据来源于加拿大达尔豪斯大学大气成分分析组2004、2009和2014年的PM2.5栅格数据(
2 不同学历人才分布的时空格局
2.1 人才比重的静态分布时空格局
2.1.1 研究生学历人才
中国研究生学历人才高度集聚在直辖市、省会城市和计划单列市。如图1a1~a3所示,2005、2010和2015年北京、上海等直辖市,南京、武汉和西安等省会城市,以及厦门和大连等计划单列市均具有较高的研究生学历人才比重,3个时期研究生学历人才比重的前30位中分别有93.33%、96.67%和96.67%的区域为直辖市、省会城市和计划单列市。其中:(1) 华东、华北和西北地区的直辖市、省会城市的研究生学历人才集聚优势比较突出,上海、南京和杭州等华东城市,北京和太原等华北城市,以及西安和兰州等西北城市的研究生学历人才比重整体上要高于华中、华南和西南地区。(2) 北京市的研究生学历人才比重远高于其他城市。2005—2015年,北京研究生学历人才比重分别是第二位城市(2005年为南京,2010和2015年为上海)的1.74倍、1.99倍和2.00倍,北京与其他城市的研究生学历人才集聚优势在不断拉大。首都北京不仅是中国的政治和经济中心,也拥有最为发达的高等教育,对研究生学历人才拥有最强的吸引力。
图1
图1
2005—2015年中国研究生、本科及大专学历人才空间分布
注:本图基于自然资源部标准地图服务网站下载的审图号为GS(2019)1823号标准地图绘制,底图无修改。下同。
Fig.1
Spatial distribution of China's talents with graduate, undergraduate and college degrees during 2005-2015
研究生学历人才分布的不均衡度最高,且随时间有所缓解,但缓解的程度最低。如图2所示,中国研究生学历人才比重的变异系数均远高于大专和本科学历人才,表明研究生学历人才主要集聚在直辖市、省会城市及计划单列市的不均衡态势最为突出。然而,尽管2010—2015年,研究生学历人才比重的变异系数稳中有升,但2015年相比于2005年仍降低了12%,意味着中国研究生学历人才分布的不均衡态势有所改善。同时,2015年研究生学历人才比重的变异系数为2005年的88.00%,本科及大专学历人才分别为76.98%和74.24%,表明研究生学历人才分布的不均衡态势的缓解程度最低,本科其次,大专学历人才最高。
图2
图2
2005—2015年中国研究生、本科及大专学历人才占比的变异系数
Fig.2
Coefficient of variation of the share of China's talents with graduate, undergraduate and college degrees during 2005-2015
2.1.2 本科学历人才
本科学历人才仍主要分布在直辖市、省会城市等高行政等级城市,少数西北地区的资源型城市开始呈现出本科学历人才集聚的优势,且其集聚的不均衡程度也逐渐下降。与研究生学历人才类似,如图1b1~b3所示,直辖市、省会城市和计划单列市也拥有较高的本科学历人才比重,3个时期本科学历人才比重的前30位中分别有80.00%、83.33%和76.66%的区域为直辖市、省会城市和计划单列市。北京仍旧拥有最高的本科学历人才比重,但相对于其他城市的本科学历人才集聚优势并没有研究生学历人才突出,3个时期其本科学历人才比重分别是第二位城市的1.01、1.46和1.33倍。然而,与研究生学历人才不同,西北地区的少数资源型城市或矿产资源富集区域也具有一定的本科学历人才集聚优势,如克拉玛依和包头等资源型城市①(①资料来源:国家发改委印发的全国资源型城市名单(2013年)。),以及阿拉善盟、嘉峪关市和博尔塔拉蒙古自治州等矿产资源富集区域。3个时期本科学历人才比重的前30位中分别有16.67%、13.33%和20%的区域为资源型城市或矿产资源富集区域。类似地,武荣伟等[29]发现个别资源型城市的本科及以上学历人才比重较高,本文进一步证实这种现象主要是本科学历人才而非研究生学历人才地理集中所致。此外,2005—2015年,本科学历人才比重的变异系数也逐渐下降(图2),本科学历人才分布呈现出分散化的趋势。
2.1.3 大专学历人才
大专学历人才也主要分布在直辖市和省会城市等高行政等级城市,且西北地区资源型城市具有显著的大专学历人才集聚优势。如图1c1~c3所示,高行政等级城市也拥有较高的大专学历人才比重,3个时期大专学历人才比重的前30位中分别有43.33%、60.00%和63.33%的区域为直辖市、省会城市和计划单列市。同时,与本科学历人才相比,西北地区具有大专学历人才集聚优势的资源型城市范围进一步扩大,基本涵盖包头市、鄂尔多斯市和阿拉善盟等内蒙古西部地区,以及阿勒泰地区、哈密地区和克拉玛依等新疆北部地区,3个时期大专学历人才比重的前30位中分别有46.66%、36.67%和26.67%的区域为资源型城市或矿产资源富集区域。一方面,这些因资源而兴而起的区域,石油化工、钢铁冶金等资源型部门是当地经济和劳动力市场的支柱产业,需要一定数量的技术型高等学历劳动力,尤其是大专学历,加之人口和经济集聚规模低,使得较小规模的大专学历劳动力在整个劳动力市场中仍占有相对较高的份额,转化成了人力资本的相对优势。另一方面,国家西部大开发战略实施管理干部、科技人才支援新疆②(②资料来源:
尽管大专学历人才空间分布与研究生、本科学历人才存在一定差异,尤其是与研究生学历人才,但总体上3类人才空间分布比较接近。3个时期,大专与本科学历人才比重间的相关系数均在0.9左右,而大专与研究生学历人才比重间的相关系数均在0.6左右,本科与研究生学历人才比重间的相关系数保持在0.8左右。此外,大专学历人才比重的变异系数也逐渐减少(图2),大专学历人才空间分布也呈一定的分散化趋势。
2.2 人才比重的动态分布格局
直辖市、省会城市和计划单列市依旧是不同学历人才比重增长幅度较高的地区,而一些西北地区的资源型城市也拥有相对较快的本科及大专学历人才的动态集聚速度。如图3a所示,研究生学历人才比重增加幅度较高的地区主要集中在直辖市、省会城市和计划单列市,其中,北京研究生学历人才比重增幅最大,是第二位上海的1.96倍。而本科学历人才比重增幅较高的地区也主要是直辖市和省会城市等高行政等级城市,以及阿拉善盟等少数内蒙古西部的资源型城市(图3b)。大专学历人才比重增幅较高的地区既有合肥、兰州、成都、济南和青岛等省会城市和计划单列市,也有乌海、鄂尔多斯、东营等资源型城市(图3c)。此外,经济增长乏力的东北地区及部分西部省会城市周边的城市,存在着人力资本收缩的问题,如黑龙江省的鸡西、七台河研究生学历人才比重负增长,四平、绥化、伊春和白城等地大专学历人才比重负增长,同时,由于省会城市对顶尖学历人才的虹吸作用,兰州、西安和南京等周边地区的研究生学历人才比重也呈缩减态势。
图3
图3
2005—2015年中国研究生、本科及大专学历人才比重变化的空间分布
Fig.3
Spatial distribution of changes in the proportion of China's talents with graduate, undergraduate and college degrees during 2005-2015
人才动态集聚呈现出显著的马太效应,且马太效应的强度随学历的下降而逐渐减弱。如图4a所示,2005—2015年研究生学历人才比重变化幅度与2005年研究生学历人才比重间线性拟合函数中的弹性系数统计上高度正向显著,解释程度R2高达0.7707,即初期研究生学历人才占比越高的地区,期间研究生人才比重的增幅越大,并且弹性系数的数值为所有学历中最高,初期研究生学历人才比重每提高1%,期间研究生学历人才比重的变化幅度会相应提高153.8%,研究生学历人才动态集聚的这种马太效应强度最高。而较研究生学历人才,2005—2015年本科学历人才比重变化幅度与2005年本科人才比重线性拟合间在统计上也正向显著(图4b),表明本科学历人才动态集聚也存在一定的马太效应,但本科学历人才比重变化幅度线性拟合的弹性系数仅为研究生学历人才的一半左右,解释程度R2降至0.3889,可见,本科学历人才动态集聚的马太效应的强度及显著性均有所下降。然而,2005—2015年大专学历人才比重变化幅度与2005年大专学历人才比重间并无显著的统计正相关关系(图4c),大专学历人才动态集聚未显示出马太效应的特征。
图4
图4
研究生、本科及大专学历人才比重与人才比重变化幅度间的统计关系
Fig.4
Statistical relationship between the proportion of talents with graduate, undergraduate, and college degrees and the change of the proportion
3 不同学历人才分布的影响机理
3.1 解释框架
解释框架重点分析经济因素、社会舒适性及环境舒适性对中国不同学历人才比重空间分布的影响(表1)。经济因素主要包括收入水平和产业就业机会,选取职工平均工资(wag)来表征收入水平,服务业快速增长是创造服务业就业机会的动力源泉,选择第三产业增加值占GDP的比重(tez)来表征产业就业发展。社会舒适性因素主要包括教育、医疗和交通出行3个方面[27],选用中学生师比(sta),即中学在校生与专业教师数量的比值来表征教育服务设施舒适性,选用每万人执业医生数(doc)来表征医疗服务设施舒适性,选取人均道路面积(roa)来表征交通出行的便捷舒适性。自然环境舒适性因素分为居住体感、休憩绿化环境和空气环境舒适性。海拔高度一直是中国人口分布格局的重要影响因素[39-40],高海拔地区空气稀薄、气温和气压低,身体生理机能感觉舒适性差,因而选用海拔高度(dem)来表征居住体感舒适性;选取绿化覆盖率(gre)来表征休憩绿化环境舒适性[41];选取年均PM2.5浓度(pm)表征空气环境舒适性[42]。此外,本文还将万人高等院校在校生数(edu)、财政支出中的科技支出和教育支出占比(sef)和人口密度(den)纳入计量模型中,以分别控制高等教育人才培养、政府人才财政投入和市场集聚效应对不同学历人才空间分布的影响[27,29]。为控制内生性,所有自变量(除海拔高度)均滞后一期处理,数据年限分别对应2004、2009和2014年。同时,为控制变量的异方差影响,所有自变量和因变量均做对数处理。
表1 解释变量的描述
Tab.1
| 类型 | 变量 | 描述 |
|---|---|---|
| 经济因素 | tez | 各城市第三产业增加值占GDP的比重(%) |
| wag | 各城市城镇在岗职工平均工资(元) | |
| 社会舒适性因素 | sta | 各城市中学生师比(人/人) |
| doc | 各城市每万人执业医生数(人/万人) | |
| roa | 各城市市辖区人均道路面积(m2/人) | |
| 自然环境舒适性因素 | gre | 各城市市辖区建成区绿化覆盖率(%) |
| pm | 各城市年均PM2.5浓度(μg/m3) | |
| dem | 各城市海拔高度(m) | |
| 控制变量 | edu | 各城市万人高等院校在校生数(人/万人) |
| sef | 各城市财政支出中的科技支出和教育支出占比(%) | |
| den | 各城市人口密度(人/km2) |
3.2 影响因素
表2 不同学历劳动力占比的全局自相关指数
Tab.2
| 指标 | 2005年 | 2010年 | 2015年 | |||||
|---|---|---|---|---|---|---|---|---|
| Moran's I | Z值 | Moran's I | Z值 | Moran's I | Z值 | |||
| 研究生学历劳动力占比 | -0.009 | -0.243 | 0.002 | 0.243 | 0.006 | 0.406 | ||
| 本科学历劳动力占比 | 0.170*** | 6.960 | 0.140*** | 5.808 | 0.138*** | 5.556 | ||
| 大专学历劳动力占比 | 0.312*** | 12.322 | 0.226*** | 8.888 | 0.143*** | 5.622 | ||
注: ***表示通过了1%的显著性水平检验;P<0.01显著水平下的Z值临界值是2.58。
表3 回归结果
Tab.3
| 变量 | 研究生 | 本科 | 大专 | ||||||
|---|---|---|---|---|---|---|---|---|---|
| OLS | SAR | SEM | OLS | SAR | SEM | OLS | SAR | SEM | |
| tez | 0.529*** | 0.529*** | 0.533*** | 0.253*** | 0.247*** | 0.270*** | 0.141*** | 0.137*** | 0.156*** |
| (4.439) | (4.451) | (4.452) | (3.788) | (3.719) | (4.028) | (2.841) | (2.778) | (3.149) | |
| wag | 0.607*** | 0.605*** | 0.701*** | 0.476*** | 0.468*** | 0.557*** | 0.160*** | 0.160*** | 0.220*** |
| -4.884 | (4.775) | (5.426) | (6.834) | (6.671) | (7.637) | (3.093) | (3.112) | (4.074) | |
| sta | -0.309** | -0.306** | -0.276** | -0.256*** | -0.222*** | -0.221*** | -0.122** | -0.103* | -0.132** |
| (-2.291) | (-2.251) | (-2.003) | (-3.385) | (-2.915) | (-2.854) | (-2.165) | (-1.827) | (-2.314) | |
| doc | 0.340*** | 0.339*** | 0.337*** | 0.211*** | 0.207*** | 0.221*** | 0.199*** | 0.192*** | 0.197*** |
| (4.084) | (4.090) | (4.035) | (4.526) | (4.482) | (4.728) | (5.730) | (5.572) | (5.696) | |
| roa | 0.194*** | 0.194*** | 0.198*** | 0.175*** | 0.172*** | 0.176*** | 0.156*** | 0.153*** | 0.157*** |
| (4.657) | (4.670) | (4.776) | (7.458) | (7.388) | (7.630) | (8.964) | (8.883) | (9.217) | |
| gre | -0.064 | -0.064 | -0.07 | 0.009 | 0.007 | 0.005 | -0.029 | -0.031 | -0.035 |
| (-1.025) | (-1.035) | (-1.132) | (0.259) | (0.197) | (0.156) | (-1.112) | (-1.201) | (-1.383) | |
| pm | -0.006 | -0.006 | -0.024 | -0.116*** | -0.103** | -0.127*** | -0.075** | -0.062** | -0.077** |
| (-0.079) | (-0.082) | (-0.300) | (-2.807) | (-2.480) | (-2.757) | (-2.426) | (-1.997) | (-2.224) | |
| dem | 0.022 | 0.023 | 0.021 | -0.005 | 0.004 | -0.004 | 0.002 | 0.008 | 0.0001 |
| (1.013) | (1.001) | (0.900) | (-0.449) | (0.280) | (-0.279) | (0.276) | (0.862) | (-0.005) | |
| edu | 0.525*** | 0.525*** | 0.516*** | 0.223*** | 0.223*** | 0.206*** | 0.122*** | 0.123*** | 0.112*** |
| -16.195 | (16.189) | (15.955) | (12.274) | (12.317) | (11.387) | (9.058) | (9.153) | (8.449) | |
| sef | -0.407*** | -0.407*** | -0.380*** | -0.193*** | -0.190*** | -0.183*** | -0.124*** | -0.127*** | -0.148*** |
| (-3.973) | (-3.992) | (-3.610) | (-3.351) | (-3.332) | (-3.085) | (-2.897) | (-2.986) | (-3.375) | |
| den | 0.037 | 0.038 | 0.052 | -0.088*** | -0.078*** | -0.074*** | -0.097*** | -0.089*** | -0.093*** |
| (0.867) | (0.885) | (1.181) | (-3.658) | (-3.217) | (-2.962) | (-5.412) | (-4.968) | (-5.033) | |
| ρ | 0.022 | 0.315** | 0.370*** | ||||||
| (0.112) | (2.195) | (2.780) | |||||||
| γ | 0.584*** | 0.727*** | 0.830*** | ||||||
| (3.881) | (6.972) | (12.399) | |||||||
| R2 | 0.732 | 0.736 | 0.735 | 0.738 | 0.740 | 0.741 | 0.688 | 0.687 | 0.691 |
| Log-likelihood | -658.406 | -658.404 | -655.316 | -243.436 | -241.965 | -237.592 | -30.916 | -29.519 | -18.921 |
| Durbin-Watson | 1.651 | 1.598 | 1.471 | ||||||
| LM(lag) | 0.011 | 3.528* | 2.766* | ||||||
| R-LM(lag) | 5.505** | 0.118 | 5.760** | ||||||
| LM(error) | 6.407** | 12.380*** | 33.041*** | ||||||
| R-LM(error) | 11.901*** | 8.970*** | 36.035*** | ||||||
| N | 717 | 717 | 717 | ||||||
注:括号中为t统计量;*、**、***分别表示通过10%、5%、1%的显著性水平检验。表中模型均为基于时间固定效应的模型。
从变量的影响系数大小及其统计显著性上看,每组模型中的一般面板模型、空间滞后面板模型(SAR)和空间误差面板模型(SEM)结果相对比较一致,表明结果的稳定性较好。此外,研究生和本科学历人才模型R2超过了0.7,大专学历人才模型R2接近0.7,说明构建的自变量体系整体解释效果较好。LM检验结果表明(表3),3组模型中LM(error)和R-LM(error)统计显著性及统计值均远高于LM(lag)和R-LM(lag),表明应拒绝一般面板模型及空间滞后面板模型(SAR),选择空间误差面板模型(SEM)。最终本文选择基于时间固定效应的SEM模型来解释中国不同学历人才比重空间分异的影响机理。
3.2.1 经济因素
薪资待遇在中国不同学历人才地理集中的过程中扮演着最为重要的作用,并且随着人才学历梯度的提升,高薪资待遇对不同学历人才地理集中的促进作用逐渐增加。如表3所示,3组SEM模型中职工薪资待遇与不同学历人才比重均呈显著的正相关关系,且其影响系数均为所有变量中最高,反映出2005—2015年处于经济快速增长阶段的中国的不同学历人才空间分布均属于收入为主的经济驱动型。而恰恰这一阶段中国区域经济发展差距的缩小是不同学历人才空间分布不均衡化程度下降的主要原因,2000年后中国区域协调发展政策的实施一定程度上削弱了经济增长的区域差距[45-46],中国地级以上城市间城镇职工平均工资的变异系数由2004年的0.325,逐渐降至2009年的0.257和2014年的0.237④(④数据来源于中国城市统计年鉴。),进而区域收入差距的逐渐缩小促使着该阶段中国大专、本科及研究生学历人才空间分布的不均衡化态势均有所缓和。此外,从研究生到大专学历人才,薪资水平的正向影响系数依次下降(表3),表明其在人才空间分布上的学历梯度分异作用,这也是研究生、本科和大专学历人才高度集聚在直辖市、省会城市等经济发达城市的不均衡程度依次递减的根源。
服务业增长在促进人才集聚上的作用上也呈现出随学历下降而下降的梯度分异规律。服务业增加值占GDP的比重与研究生、本科及大专学历人才比重均呈现出显著的正相关关系(表3),服务业无疑是集聚不同学历人才的支柱产业。同时,随着学历水平的下降,3组SEM模型中服务业的影响系数也呈依次递减的特征(表3),表明服务业增加值占GDP的比重对研究生、本科及大专学历人才集聚的拉动作用呈依次递减的规律。这主要是由于服务业对不同学历劳动力就业的吸纳作用分异所致,2015年全国服务业吸纳的大专、本科及研究生学历劳动力分别占相应学历劳动力规模的57.48%、72.05%、79.56%⑤(⑤数据来源于2015年全国1%人口抽样调查。)。直辖市、省会城市等经济发达城市拥有相对发达的服务业,进而也导致了研究生、本科和大专学历人才在这些地区高度集聚的不均衡程度依次递减。
经济因素驱动作用的学历梯度分异特性也是不同学历人才空间溢出效应差异的原因。研究生、本科及大专学历人才集聚的地区经济发达,本地区通过资本、产业等要素的辐射扩散效应带动周边邻近地区的经济发展,进而提升周边地区的人力资本水平。然而邻近地区与本地区间仍存在着经济发展差距,加之经济因素对人才集聚的学历梯度分异作用,学历越低的人才,这种经济发展差距在其区位选择中的重要性越低,越可能在发达城市的临近地区集聚,学历较高的研究生,更倾向于经济最发达的地区集聚。从而要素的辐射扩散效应对邻近地区大专学历人才比重的提升作用最为突出,本科其次,研究生最弱,因而人才集聚空间溢出效应的强度表现出因学历依次下降而依次递增的特征。
3.2.2 社会舒适性因素
社会舒适性对研究生、本科和大专学历人才区位选择的吸引力呈现出依次递减的规律。如表3所示,城市的中学生师比越低、万人执业医师数量越高、人均道路面积越大,研究生、本科和大专学历人才比重也越高,表明不同学历人才的区位选择均重视子女教育、医疗条件和交通出行等社会舒适性。同时,随着人才学历水平的下降,中学生师比、万人执业医师和人均道路面积影响系数的绝对值均呈现出依次降低的特征(表3),反映出学历越高的人才,区位选择过程中对社会舒适性的关注越强。迁移消费理论指出收入水平提高导致舒适性这种正常甚至高端产品的社会需求在家庭迁移决策中扮演着愈加重要的作用[12],而由于劳动力市场需求的稀缺性差异,研究生、本科和大专学历人才的收入水平大致依次降低[47],因而学历越高的人才,对社会舒适性的需求愈加旺盛。而不同学历人才对社会舒适性的需求整体要弱于对经济因素,研究生SEM模型中,经济因素变量影响系数绝对值的均值是社会舒适性变量影响系数绝对值的均值的2.28倍,本科及大专人才SEM模型则分别为2.01倍和1.17倍,经济因素在中国人才区位选择中扮演的作用要明显强于社会舒适性。
3.2.3 环境舒适性因素
环境舒适性总体上并未显著促进不同学历人才集聚。如表3所示,绿化覆盖率、海拔高度对研究生、本科和大专学历人才比重的影响均不显著,绿化休憩环境与居住体感舒适性并未影响不同学历人才的地理集中。而空气环境舒适性PM2.5浓度仅与本科、大专学历人才比重间呈显著的负相关关系,与研究生学历人才比重间相关关系并不显著,这可能是大专和本科学历劳动力比重相对较高的新疆北部及内蒙古西部等西北地区PM2.5浓度相对较低所致[48]。类似地,武荣伟等[29]和古恒宇等[27]也观察到绿化覆盖率、气候等环境舒适性并未影响中国高学历人才的地理集中。从影响系数的显著性上看,环境舒适性对中国高等学历人才区位选择的影响要明显低于社会舒适性。子女教育和医疗服务是城市基本公共服务体系中的核心环节,关系到人才的家庭幸福和生活健康,社会舒适性属于一种基本性的物质需求,而绿意盎然、体感舒适的居住环境则属于更高层次的物质需求,加之中国基本公共服务供给存在着发展不平衡不充分的问题,因而不同学历的人才对社会舒适性的需求均显著强于对环境舒适性的需求。
3.2.4 控制变量分析
控制变量中,高等教育对研究生、本科和大专学历人才集聚的推进作用也呈现出依次降低的特征,加大财政支出中的科技和教育支出以及提升人口密度并未有效促进人才集聚。如表3所示,每万人高等学校在校生与研究生、本科和大专学历人才比重间均呈显著的正相关关系,并且其影响系数随着人才学历水平下降而依次降低,反映了高等教育对人才本地化供给的学历梯度作用。这可能是中国高校不同学历学生的扩招政策差异所致,2004—2014年,中国大专、本科及研究生在校生增速分别为69%、109%和125%⑥(⑥数据来源于中国教育统计年鉴。),扩招速度最快的研究生招生政策使得高等教育体系中研究生毕业生的本地化培养能力最强,进而导致高等教育对研究生学历人才比重的拉动作用最为突出。其次,与预期不一致的是,3组模型财政支出中的科技支出和教育支出占比与人才比重均呈显著负相关关系,人口密度与本科、大专学历人才占比间显著负相关(表3)。类似,一些研究也发现中国城市人均财政支出中科技支出和教育支出占比、人口密度与高等学历人才集聚度间并未呈显著正相关关系[27]。财政支出的负向作用可能是一些经济发达城市的科教文卫财政支出占比较低所致,如2014年上海、深圳和广州等城市的财政支出中科技支出和教育支出占比仅位居全国地级以上城市的中游⑦(⑦数据来源于2015年中国城市统计年鉴。)。而人口密度的负向作用也可能是大专和本科学历劳动力比重相对较高的新疆北部及内蒙古西部等西北地区的人口稀疏所致。
3.3 影响机理
中国发达城市过高的房价及人才购房意愿的学历梯度性共同造就了经济因素对中国人才集聚影响的学历梯度分异作用。中国的房价收入比位居世界前列,甚至超过了美国等发达国家[49],2014年中国35个直辖市、省会城市和计划单列市的房屋总价与居民家庭年收入比值的平均值为8.7[50]。即使是收入水平和学历水平均最高的研究生,在北京、上海、深圳、杭州和天津等直辖市和省会城市的房价也远远超过了其薪资水平。同时,随着学历的提高,人才的购房比例不断增加[47],收入水平最高的群体,购房意愿也最为强烈,相比之下,大专学历人才在直辖市、省会城市和计划单列市等超大、特大城市购房意愿相对较低。从而在人才购房意愿的学历梯度分化作用下,超大和特大城市的高房价形成了收入水平为主导的经济因素对人才集聚影响的学历梯度分异作用(图5)。
图5
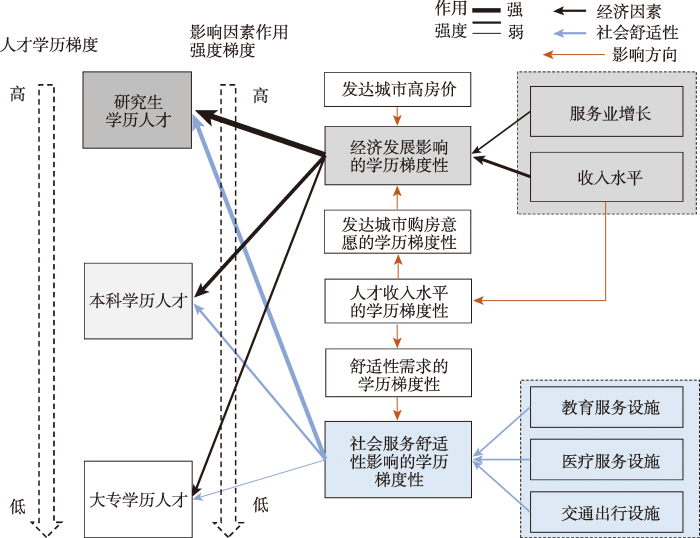
图5
中国不同学历人才分布时空分异的影响机理
Fig.5
Driving mechanism of the spatial and temporal distribution of China's talents with different educational attainments
4 结论与讨论
4.1 结论
现有人才集聚影响机理的理论研究主要集中在高等学历人才总体的层面,不同学历人才区位选择的成因关注不足。然而,人才内部存在着受教育程度由低到高的学历梯度,不同学历人才迁移决策的需求偏好不尽一致,从而产生了不同学历人才地理分布景观的差异性。据此,本文聚焦人才学历梯度分异的研究视角,利用中国2005、2010和2015年人口抽样调查数据资料,从地级尺度上揭示2005—2015年中国大专、本科及研究生学历人才分布的时空格局特征差异,采用空间计量模型解释不同学历人才时空分布差异的影响机理。主要结论如下:
(1) 中国不同学历人才的空间分布高度不均衡,研究生、本科及大专学历人才主要集聚在直辖市、省会城市和计划单列市。而本科及大专学历人才在内蒙古西部和新疆北部等西北地区资源型城市也呈现出一定的集聚优势,并且大专学历人才的集聚优势要强于本科学历人才。横向比较来看,人才集聚的不均衡度随着学历提升而依次递增;纵向演化上看,研究生、本科及大专学历人才集聚的不均衡程度均随时间而有所缓解,但缓解程度呈现出随学历提升而依次递减的规律。
(2) 人才动态集聚呈现出初期人才比重越高、期间人才比重增幅越大的马太效应,直辖市、省会城市和计划单列市依旧是不同学历人才比重增长幅度较高的主要地区,而一些西北地区的资源型城市也拥有相对较快的本科及大专学历人才的动态集聚速度。少数经济增长乏力的东北地区以及西部省会城市周边的城市,存在着人力资本水平负增长的问题。随着人才学历水平的逐渐提升,人才动态集聚的马太效应强度逐渐增强。
(3) 中国研究生、本科及大专学历人才集聚均主要为经济主导型,薪资待遇是不同学历人才集聚的最重要影响因素,中国区域间薪资水平差距的缩小是不同学历人才分布不均衡态势缓解的主要原因。服务业快速增长,中学教育、医疗条件和交通出行等社会舒适性,以及发达的高等教育也会促进不同学历人才的集聚,海拔高度及绿化休憩等环境舒适性整体上并未显著促进中国高等学历人才的集聚。随着人才学历的逐渐提高,经济及社会舒适性因素对人才集聚的促进作用均呈逐渐增加的趋势。中国发达城市过高的房价及人才购房意愿的学历梯度性共同造就了经济因素对中国人才集聚影响的学历梯度分异作用,而人才收入水平的学历梯度性导致了社会舒适性因素对中国人才集聚影响的学历梯度分异特征。
4.2 讨论
许多研究都发现,中国人才区位选择是传统的经济要素驱动型,经济因素是中国人才区位选择的第一性要素[27,30],新古典迁移模型对中国人才区位选择仍具有最佳的解释力。本文则进一步证实了该观点,即使是对学历最高的研究生,经济因素仍是其集聚的首要因素。同时,尽管影响作用不及经济因素,但舒适性在中国人才区位选择中仍发挥着重要作用[27,29-30],Graves[11]的舒适性理论一定程度上也适用于解释中国的人才分布。此外,本文进一步发现舒适性对中国人才集聚的影响作用主要体现在教育、医疗等社会服务设施的舒适性上,社会舒适性在中国人才区位选择上扮演的作用要强于海拔高度和绿化环境等自然环境舒适性。相比于已有研究,本文的主要理论贡献是探究经济因素和舒适性对不同学历人才区位选择的异质性影响。总体上看,分别作为第一性和第二性驱动要素的经济发展及社会舒适性,对中国人才集聚的影响呈现出显著的学历梯度分异规律,经济因素和舒适性对研究生、本科及大专学历人才分布的影响均分别呈依次递减的规律,学历越高的人才,区位选择决策中对经济因素和社会舒适性的重视程度越高。
政策启示上,首先,中国不同规模等级城市的人才引进类型要与不同学历人才集疏的时空分布格局规律相适应。当前中国不同学历人才均高度集聚在直辖市、省会城市和计划单列市等超大城市、特大城市,尤其是受教育程度最高的研究生学历人才,在这些超大城市和特大城市又呈现出显著的动态集聚马太效应。而目前很多中小城市人才引进过度追求“高大上”,投入大量用于安家费和生活补贴的财政资金来引进硕士和博士等顶尖学历人才,一定程度上不符合研究生学历人才集疏格局的市场化规律。相反,一些西北地区的资源型中小城市凭借小而精的产业特色,具有突出的大专学历人才集聚优势,加之大专学历人才也不存在动态集聚的马太效应,因而中小城市的人才引进类型可以主要下沉到大专学历人才,人才政策的财政投入有的放矢。其次,人才集聚本质上还是经济因素主导的市场化过程,加快产业转型来发挥服务业在吸引人才上的基础性作用,建立因产引才的长效性机制,服务业高度发达的城市,可加大政策配套力度来提升对硕士和博士研究生学历人才的引进力度,服务业发展缓慢的城市,要适当调低人才引进预期,精准引进大专学历人才。最后,筑牢公共服务设施配套在吸引人才上的辅助性作用,加快完善中小学教育、医院医疗条件和交通道路等公共服务设施,提升城市的教育服务、医疗服务及交通出行服务等领域的社会舒适性,同时,人才引进政策中可实施学历阶梯式的公共服务设施配套,学历越高的人才,引进政策中越要加大优质教育、医疗等公共服务资源的供给力度。
本文也存在一些不足。首先,本文只关注了经济、社会和环境等宏观因素对不同学历人才时空分布的作用机制,探究年龄、性别、家庭及户口等人口学特征,尤其是户籍对不同学历人才区位选择的影响差异,是未来研究工作的一大重点方向。其次,本文并未研究2020年中国不同学历人才的时空格局分异,未来随着分省份第七次人口普查年鉴的陆续公布,需要进一步提升研究的数据时效性。
参考文献
城市“抢人大战”的政策特征、效力测度及优化建议
[J].
effectiveness measurements and optimization suggestions of the city's "talent competition"
城市“引才大战”的内在逻辑与效应
[J].
The inner logic and effect of the city's attracting talent competition
我国城市人才争夺战的比较与思考
[J].
A comparison of the wars for talents among the cities in China and some reflections
如何制定全面的人才政策
[N].
How to formulate a comprehensive talent policy
中小城市人才引进策略研究
[J].
Research on talent introduction strategies in small and medium-sized cities
新一轮“人才争夺战”的工具导向和价值反思: 基于政策文本分析的视角
[J].
Instrumental orientation and value reflection in new round of "talents war": Under the perspective of policy text analysis
The costs and returns of human migration
[J].DOI:10.1086/258726 URL [本文引用: 1]
Do institutions play a role in skilled migration? The case of Italy
[J].DOI:10.1080/00343404.2013.835799 URL [本文引用: 1]
Spatial patterns and determinants of skilled internal migration in China, 2000-2005
[J].DOI:10.1111/pirs.12014 URL [本文引用: 3]
Jobs or amenities? Location choices of interprovincial skilled migrants in China, 2000-2005
[J].DOI:10.1002/psp.1803 URL [本文引用: 3]
A reexamination of migration, economic opportunity, and the quality of life
[J].DOI:10.1111/jors.1976.16.issue-1 URL [本文引用: 2]
Household migration: Theoretical and empirical results
[J].
Creative class concentrations in Shanghai, China: What is the role of neighborhood social tolerance and life quality supportive conditions?
[J].DOI:10.1007/s11205-016-1347-9 URL [本文引用: 1]
Creative class agglomeration across time and space in knowledge city: Determinants and their relative importance
[J].DOI:10.1016/j.habitatint.2016.12.010 URL [本文引用: 1]
The role of 'hard' and 'soft' factors for accommodating creative knowledge: Insights from Dublin's 'creative class'
[J].DOI:10.1080/00750770902815620 URL [本文引用: 1]
Cultural scenes, the creative class and development in Spanish municipalities
[J].
DOI:10.1177/0969776412448188
URL
[本文引用: 1]

In addition to human capital and creativity, cultural consumption opportunities play an important role in explaining local development and growth. They promote the attraction of visitors, as well as the attraction of the creative class, improving local income and wages. This paper analyses the relative importance of cultural consumption opportunities, as cultural scenes, explaining income differences among Spanish municipalities. Indices to measure talent, creative class, and different kinds of opportunities for cultural consumption at the local level are proposed, using multivariate regression analysis to show their complementary impact on local income. In addition to human capital and the creative class, the main results show that different kinds of opportunities for cultural consumption (cultural scenes) have an independent impact on local income.
Jobs or amenities? Destination choices of migrant engineers in the USA
[J].DOI:10.1111/pirs.2010.89.issue-1 URL [本文引用: 1]
The attraction and retention of the 'creative class' in Launceston, Tasmania
[J].DOI:10.1080/00049180903535642 URL [本文引用: 1]
Skilled and less-skilled interregional migration in China: A comparative analysis of spatial patterns and the decision to migrate in 2000-2005
[J].
Environmental influences on skilled worker migration from Bangladesh to Canada
[J].DOI:10.1111/cag.v62.3 URL [本文引用: 1]
Asset inequality matters: An assessment of the World Bank's approach to poverty reduction
[J].
人力资本梯度升级的经济增长效应
[J].
The analysis of economic growth based on structural upgrade of human capital
长期经济增长过程中的人力资本结构: 兼论中国人力资本梯度升级问题
[J].
The structure of human capital in the long-term economic growth: Also on the gradient upgrading of human capital in China
人力资本梯度升级视野下的我国研究生教育供给侧改革
[J].
Reform of the supply side of China's graduate level of education: From the perspective of the gradient of human capital
中国高学历人才的空间演化特征及驱动因素
[J].
DOI:10.11821/dlxb202102006
[本文引用: 7]
人才是推动地区创新发展的核心动力,也是未来城市竞争的关键。基于第六次全国人口普查和2015年全国1%人口抽样调查数据,运用集聚度、基尼系数等空间统计分析以及负二项回归模型方法,对2010—2015年中国城市高学历人才的空间演化特征及驱动因素展开研究。结果发现:① 人才呈现出高度集中且不平衡的空间分布格局,但不平衡的趋势有所缓解,分布方向为“东北—西南”走向。人才分布的空间溢出效应显著,城市群是人才集聚的高地。② 经济机会是影响中国高学历人才集聚的主导力量,其中工资是核心驱动因素,地区的发展水平、产业结构同样产生显著影响。③ 控制经济机会的影响后,以教育和医疗等基础公共服务、交通可达性和城市消费设施为核心的地方品质变量在高学历人才的空间集聚过程中发挥重要作用。④ 城市群与非城市群人才驱动因素存在显著差异:经济机会是城市群和非城市群人才集聚的主要驱动力;教育、消费、交通以及自然环境等地方品质变量对城市群人才集聚的影响更为显著。本研究为城市和区域人才政策和区域发展政策的制定提供借鉴与参考。
Spatial evolution characteristics and driving forces of Chinese highly educated talents
DOI:10.11821/dlxb202102006
[本文引用: 7]
Talents are the core driving force for regional innovation and development, and they are also the key to urban competition in the future. Based on the data of the sixth population census and the national 1% population sampling survey in 2015, this paper uses the concentration index (CI), Gini index (GI) and several related spatial analysis methods to examine the spatial patterns of highly educated talents across China and the drivers behind these patterns from 2010 to 2015. The results are as follows: (1) Talents show highly concentrated and unbalanced spatial distribution patterns at the city level over the five years, but the trend of concentration and imbalance has gradually eased. Results from standard deviation ellipse (SDE) indicate that the distribution direction of highly educated people is "NE-SW". Furthermore, there is a significant spatial spillover effect in the distribution of talents, with three major urban agglomerations of China as the highlands. (2) Economic opportunities are the dominant drivers for the distribution of highly educated talents in China. Among them, wages are the core driver, and gross GDP and industrial structure of each city also exert a significant impact. (3) After controlling the impacts of economic opportunities, local quality variables represented by basic public services (e.g., education and medical care), transportation accessibility and urban consumption facilities play an important role in the distribution of highly educated talents. (4) There are significant differences between the driving factors for talents in urban agglomerations and non-urban agglomerations: economic opportunities are the main driving force for the distribution of talents in both urban agglomerations and non-urban agglomerations, while local qualities including education, consumption, transportation and natural environment have a more significant impact on the distribution of talents in urban agglomerations. This study provides references for the formulation of urban and regional talent policies and regional development policies.
1995—2015年中国省际人口迁移网络的演化特征: 基于异质性劳动力视角
[J].
DOI:10.11821/dlyj020200507
[本文引用: 1]
自户籍制度放宽以来,中国经历了大规模的人口迁移。其中,异质性劳动力(高技能劳动力、普通劳动力)在迁移过程中表征出不同的空间格局和网络组织特征,对地区经济发展产生各异的影响。本研究基于人口普查和抽样调查微观抽样数据,使用复杂网络理论对1995—2015年中国异质性劳动力迁移的时空格局和网络演化展开分析,并分析了格局背后的可能成因。研究发现:① 省际高技能和普通劳动力迁移均呈现出持续高度不平衡的空间集聚特征,承载大量人口的迁移流主要由中国中西部地区指向东部沿海地区,但这种空间不平衡特征呈现出一定的减弱趋势。高技能劳动力的平均迁移距离比普通劳动力更长;② 两类劳动力迁移网络中均呈现明显的“小世界”特性,但普通劳动力迁移网络的迁移强度和关联程度均高于高技能劳动力迁移网络;③ 两类劳动力迁移网络均呈现出以北京、上海、广东为主要核心节点的网络结构。高技能劳动力网络结构呈现相对稳定的特征,而普通劳动力网络结构则呈现出变化的趋势;④ 地区经济差异、路径依赖效应、异质性劳动力在就业市场上的差异性以及劳动力市场对异质性劳动力需求的差异是导致两类劳动力迁移格局差异性的重要成因。
Evolution patterns of China's interprovincial migration networks between 1995 and 2015: Based on labour heterogeneity
DOI:10.11821/dlyj020200507
[本文引用: 1]
With the loosing of the household registration (hukou) system, China has witnessed massive volumes of interregional migration. Among all kinds of migration, skilled migration and less-skilled migration present differential spatial patterns and network characteristics over time and may exert distinguished impacts on regional development and innovation. However, due to limited data availability, prior studies only adopted cross-sectional data analysis and examined the patterns of skilled and less-skilled migrations before 2005, whereas few have been done on related topics after 2005. Drawing on previous studies, the present paper uses micro-level datasets from population censuses and sample surveys to assess the spatial evolution patterns of China's skilled and less-skilled internal migrations between 1995 and 2015. Besides, several complex network analysis methods have been employed, together with the network visualization technique. The results of the paper are listed as follows. First, there were spatial clustering and uneven patterns in both skilled and less-skilled internal migrations over the 20 years of 1995-2015, where migration flows containing a large percentage of skilled and less-skilled migrants originated from inland western and central regions to the eastern coastal areas of China. However, the degree of spatial unevenness in the migration patterns has been slightly weakened. In addition, the average migration distance of skilled migration was farther than that of less-skilled migration in the same period. Second, both of the two migration networks have presented a “small-world” property over the 20 years. In comparison, the intensity and connection degree of less-skilled migration networks have prevailed over that of the skilled migration networks. Third, results from the community detection have revealed that both skilled and less-skilled migrations exhibited a network structure where Beijing, Shanghai, and Guangdong served as the core nodes. Skilled migration presented a more stable network structure during the 20 years, while less-skilled migrations showed a persistently changing pattern. Fourth, the paper suggested that regional economic disparity, path dependence effect, the heterogeneity of different labour forces in the job market, and the differences in labour market demand for different labour forces were underpinning factors shaping the spatial evolution pattern and network structure of the two types of migration from 1995 to 2015.
2000—2015年中国高学历人才分布格局及其影响机制
[J].
DOI:10.13249/j.cnki.sgs.2020.11.007
[本文引用: 5]
基于2000年、2010年中国人口普查分地级及以上行政区数据和2015年中国各省份1%人口抽样调查数据,采用变异系数、泰尔系数、基尼系数测度中国高学历人才比重分布的空间不均衡程度,并采用面板数据Tobit随机效应模型,识别影响高学历人才比重空间分布的主要因素。结果表明:① 中国的人才比重分布表现出极大的不均衡性,人才比重的高低与城市等级密切相关,主要表现在直辖市、省会城市、计划单列市等行政区吸引了大量人才,而普通地级城市人才比重相对较低;② 10 a间人才比重的变异系数、基尼指数和泰尔指数均有所下降,表明人才比重分布的空间不均衡程度有所下降;③ 平均工资水平、生活成本、城市等级、每万人高校在校学生数、每万人医院卫生院床位数、人均科学事业、教育事业经费与人才比重呈正相关,中学生师比、万人互联网用户数与人才比重呈负相关,失业率、单位面积二氧化硫排放量、绿地率对人才比重没有影响。
Spatial pattern and determinants of highly educated talents in China, 2000-2015
DOI:10.13249/j.cnki.sgs.2020.11.007
[本文引用: 5]
Based on the data from the 2000 and 2010 China censuses by prefecture level and above, and the 2015 1% population sample survey data of Chinese provinces, this article studies the spatial pattern evolution of the distribution of highly educated talents and its influence mechanism in China. The coefficient of variation, Theil coefficient and Gini coefficient are used to measure the spatial imbalance of the highly educated talents proportion. The panel data Tobit model is used to identify the main factors affecting the spatial distribution of the proportion of the highly educated talents. The results show that: 1) The distribution of the highly educated talents proportion in China shows a great imbalance, closely related to the city level, which is highlighted in administrative regions such as municipality, provincial capitals, and city specifically designated in the state plan, to which a large number of talents are attracted, while the talents proportion in ordinary prefecture-level cities is relatively low; 2) In the past 15 years, the coefficient of variation, Gini coefficient and Theil coefficient of the talents proportion have all declined, indicating that the spatial imbalance of the talents proportion has decreased; 3) Average wage level, cost of living, city hierarchy, students enrollment of regular institutions of higher education per 10 000 people, the number of hospital beds per 10 000 people, expenditure for education per capita, expenditure for science and technology per capita are positively correlated with talents proportion; The ratio of middle school students to teachers and the number of internet users per 10 000 people are negatively correlated with talents proportion; Unemployment rate, green rate, sulfur dioxide emissions per unit area have no significant impact on the talents proportion.
2000—2015年中国高学历人才省际迁移的演化格局及影响机理
[J].
DOI:10.11821/dlyj020201191
[本文引用: 4]
经济快速增长和社会转型促使中国人才迁移的地理景观正涌现出一些新特征和新趋势。利用中国2005年、2010年和2015年千分之一人口抽样调查微观数据,揭示2000—2005年、2005—2010年和2010—2015年全国高学历人才省际迁移格局的演化趋势,选用零膨胀负二项回归模型解释高学历人才省际迁移格局的演化机理。结果发现:① 中国高学历人才跨省流动性呈先增后减的演化趋势,人才省际迁移规模的空间分布开始趋于均衡化。② 东部发达省市人才净流入活跃,中部、东北和河北等地区人才净迁出活跃,2010年后发达地区的人才高强度净流入及欠发达地区的人才高强度净流失问题均开始缓解。③ 高学历人才由中西部流动至东部地区的主要迁移模式比较稳定,但东部向中西部地区的高学历人才迁移规模持续上升。④ 从影响因素的演化趋势上看,全国人才省际迁移主要为经济驱动型,但收入在人才迁移决策中的重要性开始减弱,产业转型、购房成本、教育服务舒适性及气候舒适性对人才跨省流动性的影响开始增强。⑤ 全国人才跨省流动性的演化机制具有一定的阶段分异性,前期,城镇居民收入差距的扩大是人才跨省流动性升高的主要动因;之后人才跨省流动性的减弱主要受城镇居民收入差距的缩小、发达地区过高的购房成本及小学教育服务设施短缺等因素影响。
Evolution pattern and its driving forces of China's interprovincial migration of highly-educated talents from 2000 to 2015
DOI:10.11821/dlyj020201191
[本文引用: 4]
The rapid economic growth and social transition in China brings about some new trends of skilled migration. Based on microdata of China's 2005, 2010 and 2015 one-thousandth population sample survey, this paper analyzes the evolution pattern of China's interprovincial migration of highly-educated labors in the periods of 2000-2005, 2005-2010 and 2010-2015, and employs zero inflation negative binomial regression models to explain the evolution mechanism of the interprovincial migration of highly-educated talents. Results show that: (1) the interprovincial mobility of China's highly-educated workers rose first and then declined from 2000 to 2015, and the spatial distribution of migration volume of highly-educated talents tended to be balanced. (2) The net inflow rate of highly-educated talents was high in the eastern developed provinces, while the net out-flow rates were high in the central region, northeastern region and Hebei Province; the high-intensity net inflow of highly-educated talents in developed areas as well as high-intensity net outflow in less-developed areas began to ease after 2010. (3) Highly-educated individuals mainly migrated from central and western regions to eastern coastal areas, while the sizes of highly-educated labors migrating from eastern regions to central and western regions continuously increased. (4) From the perspective of the evolution trend of influencing factors, China's interprovincial migration of highly-educated talents was mainly driven by economic factors, but the importance of income in the decision-making of skilled migration tended to weaken, and the impact of industrial transformation, housing price income ratio, education service facility, and climate on the interprovincial mobility of talents began to increase. (5) The evolution mechanism of the interprovincial mobility of highly-educated talents in China varied in development stages. In the early stage, the widening urban residents' income gap was the main driver for the increase of the interprovincial mobility of highly-educated talents. After that, the decrease of the interprovincial mobility of highly-educated talents was mainly affected by the narrowing urban residents' income gap, the high housing price income ratio and the shortage of primary education service facilities in developed areas.
Inside the black box of regional development: Human capital, the creative class and tolerance
[J].DOI:10.1093/jeg/lbn023 URL [本文引用: 1]
Talent, creativity and regional economic performance: The case of China
[J].DOI:10.1007/s00168-008-0282-3 URL [本文引用: 1]
粤港澳大湾区人才集聚的演化格局及影响因素
[J].
DOI:10.11821/dlyj020200575
[本文引用: 3]
知识经济时代人才是建设粤港澳大湾区世界级城市群的重要生产要素。本研究采用2005年、2010年和2015年广东省人口普查和1%抽样调查数据,以及香港和澳门对应口径的统计数据,以县市为基本单元,提出从受教育程度和职业技能两个口径测度人才集聚水平,系统解析粤港大湾区高学历与高技能人才集聚的演化格局及影响因素。结果表明:① 粤港澳大湾区作为中国经济高度发达地区,人才集聚优势高度集中在香港、澳门,内地珠三角城市群的人才集聚水平低于京津冀城市群和长三角城市群。② 2005—2015年,粤港澳大湾区高学历人才集聚持续均衡化,而高技能人才集聚优势仍然体现在香港、澳门,内地因为发展教育提升的高学历人力资本尚未完全有效转化为高技能人力资本。③ 香港人才集聚水平处于绝对领先,澳门、广州、珠海和深圳次之,而外围县市相对处于人才洼地,特别是制造业发达的佛山、东莞人才集聚水平相对偏低。④ 面板模型表明,服务业对高技能人才集聚的拉动效应强于高学历人才,而制造业的拉动作用并不突出。高等教育对高技能人才集聚的带动作用要弱于高学历人才。高薪资待遇有利于促进高学历人才集聚,但对高技能人才集聚的促进作用有限。新时期,亟需推动粤港澳三地管理制度衔接、产业转型升级和优质高等教育建设,推动粤港澳大湾区建设国际创新中心。
Talents concentration in the Guangdong-Hong Kong-Macao Greater Bay Area, China: Evolution pattern and driving factors
DOI:10.11821/dlyj020200575
[本文引用: 3]
In the era of knowledge economy, talents concentration plays a key role in the development of a world-class urban agglomeration of Guangdong-Hong Kong-Macao Greater Bay Area (GHM). Based on the population census of Guangdong Province in 2010, the 1% population sampling survey in 2005 and 2015, and employment statistics in Hong Kong and Macao, this study measures the level of talents concentration from two perspectives of educational attainment and occupation on the county scale, and analyzes the evolution pattern and motivations of talents concentration in the GHM. The results show that: (1) GHM is one of the highly developed economic areas in China, and there is the absolute advantage of talents concentration in Hong Kong and Macao, while the level of talents concentration in the Pearl River Delta urban agglomeration is lower than that in the Beijing-Tianjin-Hebei and Yangtze River Delta urban agglomerations. (2) From 2005 to 2015, the spatial distribution of highly-educated talents in the GHM tends to be balanced, and there is also the advantage of the concentration of highly-skilled talents in Hong Kong and Macao. The increasing human capital defined by educational attainment in the mainland, which is caused by the expansion of college enrollment in China, has not been fully and effectively transformed into the advantage of human capital defined by occupation. (3) The level of talents concentration in Hong Kong plays an absolute leading role, followed by Macao, Guangzhou, Zhuhai and Shenzhen, while the counties and cities on the periphery of GHM have a low level of talents concentration. In particular, although Foshan and Dongguan have some developed manufacturing industries, their talents concentration level is relatively low. (4) The panel model shows that the service industry has a greater promoting impact on the concentration of highly-skilled workers than that of highly-educated labors, and manufacturing industry does not influence the talents concentration. Higher education plays a less important role in promoting the agglomeration of highly-skilled workers than that of highly-educated labors. High salary helps promote the concentration of highly-educated workers, while it does not boost the concentration of highly-skilled labors. In the new era, it is urgent to promote the cohesion of management systems in Guangdong, Hong Kong and Macao, the industrial transformation and upgrading, and the establishment of high-quality higher education, ultimately, building GHM into an international innovation center.
Recasting the creative class to examine growth processes in rural and urban counties
[J].DOI:10.1080/00343400600928285 URL [本文引用: 1]
中国高技能劳动力与一般劳动力的空间分布格局及其影响因素
[J].
DOI:10.11821/dlyj020180391
[本文引用: 1]
基于2000和2010年全国人口普查分县数据和地级行政单元数据,采用不均衡指数和空间自相关分析等方法,刻画中国高技能劳动力和一般劳动力的空间分布格局及其变化,并采用空间滞后模型,识别高技能劳动力与一般劳动力空间分布的决定因素及其变化。结果表明:① 两类劳动力总体的空间特征均为东南密集,西北稀疏;② 2000—2010年,高技能劳动力在空间分布上呈集中化的趋势,而一般劳动力呈分散化的趋势;③ 十年间高技能劳动力集聚区虹吸作用加强,其分布越发集中于沿海特大城市群,而一般劳动力集聚区回波作用加强,其分布越发均衡;④ 空间回归分析结果表明,职工平均工资、是否直辖市或省会、每万人在校高校学生、是否沿海城市、常住人口数和空间溢出效应在十年中一直都是决定高技能劳动力和一般劳动力空间分布的主要因素,而失业率、中学生师比、二氧化硫排放量和绿地率在2010年也成为影响两类劳动力空间分布的主要因素。对比两类劳动力的模型结果可得,高技能劳动力的空间分布受行政因素、高校因素和地区生活舒适度的影响更大,而一般劳动力的空间分布受劳动力市场因素的影响更大。
The spatial pattern and determinants of skilled laborers and lessskilled laborers in China: Evidence from 2000 and2010 censuses
Simple diagnostic tests for spatial dependence
[J].DOI:10.1016/0166-0462(95)02111-6 URL [本文引用: 1]
我国人才集聚与三次产业集聚关系研究
[J].
The research on the relationship between talent agglomeration and industrial agglomeration in China
2000—2020年中国人口分布格局演变及影响因素
[J].
DOI:10.11821/dlxb202202008
[本文引用: 1]
基于第五、六、七次全国人口普查数据,本文分析了2000—2020年中国人口分布的空间格局、集散态势和影响因素。结果表明,中国人口分布依然保持东密西疏的基本格局,胡焕庸线两侧的自然地理环境差异性决定了这一格局的长期稳定性;人口空间集中化趋势在21世纪初的10年内主要发生在东南半壁,但在2010—2020年间成为各区域的共同特征。省会城市的人口集聚能力持续增强,2010—2020年的优势更加凸显,但这种行政力量主导的首位度提升效应将随着全省发展阶段的演进而逐渐弱化。人口变动的区域分化明显:沿海城市群的空间连绵化逐渐形成了强吸引力、高承载力的沿海人口增长带,东北地区几乎转向全面的人口收缩,中部各省依托省会展开的人口竞争依然激烈,川渝黔地区普遍实现了人口的止降回增,西北地区则面临人口收缩风险。此外,区域人口增长的驱动因素逐渐从经济要素主导转为经济要素和舒适性要素并重,各地区舒适性的差异可能将成为影响未来人口空间格局变化的重要因素。
China's changing population distribution and influencing factors: Insights from the 2020 census data
DOI:10.11821/dlxb202202008
[本文引用: 1]
Using data of the latest three decennial censuses, this paper systematically analyzes the overall spatial pattern, changing trends, and influence mechanisms of China's population distribution since 2000. The study reveals that the general population distribution pattern of "dense east and sparse west" in China has not changed, which is determined by the differences in natural geographic environments on the two sides of Hu Line. In the first decade of the century, population concentration was mainly found in the southeastern area, but it has been observed in all regions in the recent decade. Provincial capitals have become the winners of population competition and the advantages of population growth of provincial capitals have been further strengthened in the recent decade compared with 2000-2010. However, the administrative power-led effects of the increasing dominance of provincial capitals will gradually weaken with the development of their provinces. The regional differentiation of population changes is also apparent: coastal region gradually forms a dense belt of population and towns with solid population attraction based on the development of urban agglomerations; the northeast region almost turns to a complete population shrinking status; central provinces still compete fiercely for population based on their capitals; the population of Sichuan, Chongqing, and Guizhou has stopped the decline and returned to growth; and the northwest region faces the risk of population loss. In addition, this paper finds that the driving factors of regional population growth have gradually changed from economic factors to both economic and amenity factors, and the difference of amenities among regions may become an important factor for future changes in China's population geography.
中国中西部地区就近城镇化空间分异格局及机理
[J].
DOI:10.11821/dlxb202112009
[本文引用: 2]
就近城镇化是中国中西部地区破除异地城镇化模式弊端、推进新型城镇化健康发展的现实路径选择。通过构建就近城镇化率、贡献力和贡献势指标,从本省、本县和本镇3个城镇化尺度,系统分析2000—2015年中国中西部地区就近城镇化空间分异特征,并深入剖析其驱动机制。研究发现:① 2000—2015年中西部地区就近城镇人口总数从1.96亿增加到3.47亿,就近城镇化率从28.16%上升到46.89%。② 从贡献力看,中西部地区就近城镇化的主要来源是本镇户籍人口,但本镇贡献力呈下降趋势,本县贡献力波动上升,本省贡献力变化不大。③ 从贡献势看,本县贡献势>本省贡献势>本镇贡献势,县域尺度是中西部大部分地区就近城镇化的优势空间单元。④ 中西部地区就近城镇化空间分异是自然环境背景、经济增长和非农产业发展、城市公共服务供给、交通运输条件和地方行政力量等多重因素的综合作用结果。
Spatial differentiation and influencing mechanism of nearby urbanization in central and western China
DOI:10.11821/dlxb202112009
[本文引用: 2]
Considering the new-type urbanization background, the nearby urbanization model provides a practical approach toward eliminating the disadvantage of trans-regional urbanization and promoting urbanization. This study establishes the indexes of the nearby urbanization rate (NU), contribution to nearby urbanization (CNU) and trend of contribution to nearby urbanization (TNU), to analyze the spatial differentiation features of nearby urbanization in central and western China from 2000 to 2015. Moreover, this study explores the determinant factors and influencing mechanism of the spatial differentiation of nearby urbanization in the study region. Results show that: (1) From 2000 to 2015, the population of nearby urbanization increased from 196 million to 347 million and the NU increased from 28.16% to 46.89%. (2) Based on the analysis of the CNU, we found that the main source of nearby urbanization was the population registered in the local town, but the contribution of local town to nearby urbanization (CNUt) gradually declined over the study period. The areas with high CNUt were widely distributed in central and western China in 2000, but by 2015, they were restricted to Sichuan province. Meanwhile, the contribution of local county to nearby urbanization (CNUc) increased and the contribution of local province to nearby urbanization (CNUp) varied slightly. Most areas with high CNUp were provincial capital cities, resource-based cities or pastural cities. (3) Based on the analysis of the TNU, the trend of the contribution of local county to nearby urbanization (TNUc) exceeded the trend of the contribution of local province to nearby urbanization (TNUp), while the trend of the contribution of local town to nearby urbanization (TNUt) exhibited the least influence. Therefore, examining nearby urbanization based on the county-level spatial unit was advantageous in most regions; however, in the northwestern border regions and provincial capital cities, the provincial level was more applicable. (4) The spatial differentiation of nearby urbanization was determined based on the integrated results of various influencing factors, including natural environment, economic development, non-agricultural industries, urban public services, transportation accessibility, and the influence of local administration.
长江三角洲人口分布演变、偏移增长及影响因素
[J].
DOI:10.18306/dlkxjz.2020.12.009
[本文引用: 1]
在长江三角洲区域一体化上升为国家战略背景下,论文运用核密度、重心、集中指数和偏移—分享等方法,研究2000—2018年长江三角洲人口时空演变规律,并采用定量方法探讨人口偏移增长影响因素。结果表明:① 部分城市主导下的人口集散趋势转变,并未显著改变区域人口不均衡格局,且集中度呈现稳步增长态势。② 基于偏移—分享法的研究发现,人口增长格局转变主要表现为部分欠发达地区人口增速加快,如三省一市上安徽省转变为正偏移增长、城市尺度上核心发达城市为主的正偏移增长向部分欠发达城市为主的正偏移增长转变、县域尺度上正偏移市辖区由核心区向边缘区的转移,但人口向少数大城市、市辖区集聚的态势显著,而多样化的人口偏移增长态势表征了未来城市发展策略的差异化需求。③ 经济因素、社会发展和财政水平等是长江三角洲人口偏移增长的重要驱动力,而影响因素的时空演变表明,未来人口均衡化政策的制定不仅要因地制宜,更要与时俱进。
Change in distribution and growth shifts of population in the Yangtze River Delta and influencing factors
DOI:10.18306/dlkxjz.2020.12.009
[本文引用: 1]
Population distribution is an important indicator of regional development patterns. Also, regional coordinated development is closely related to the balanced distribution of the population. In the context of the regional integration of the Yangtze River Delta as a national strategy, the population distribution across the Yangtze River Delta has undergone significant changes. Using Kernal density analysis, gravity center analysis, concentration index, and shift-share analysis methods, this study examined the spatio-temporal change characteristics of the population in the Yangtze River Delta from 2000 to 2018, and explored the influencing factors as well as internal mechanisms of population growth shifts by utilizing quantitative methods. The main conclusions are as follows: 1) The shift in the population distribution trend led by some cities did not significantly change the imbalanced pattern of regional population distribution, and the increase in the concentration index indicates that the regional population concentration showed a steady growth trend. 2) The research based on shift-share analysis found that the shift in population growth pattern was mainly manifested in the acceleration of population growth in some underdeveloped areas. For example, Anhui Province was transformed into positive growth shift at the provincial scale. On the city scale, the positive growth shift dominated by core developed cities has changed to the positive growth shift dominated by some less developed cities. The spatial distribution of positive growth shift of municipal districts changed from the core areas to the peripheral areas. However, the population was still attracted to a few large cities and municipal districts. The diversified population growth shift trend characterizes the differentiated demands for future development strategies. 3) Economic factors, social development, and financial resources were important driving forces of population growth shift in the Yangtze River Delta. However, the temporal and spatial change of influencing factors shows that the formulation of future population balancing policies not only needs to be adapted to local conditions, but also should evolve through time. This research not only provides a reference for the formulation of relevant population policies, but also enriches the empirical findings on the spatial and temporal change of population.
PM2.5污染对中国人口死亡率的影响: 基于346个城市面板数据的实证分析
[J].
DOI:10.18306/dlkxjz.2022.06.007
[本文引用: 1]
中国生态文明建设和“健康中国”战略强调切实治理影响人口健康的环境问题,建设健康人居环境。论文基于2000年和2010年中国人口普查资料以及2005年和2015年各省级行政单元1%人口抽样调查等数据资料,论文使用探索性空间分析方法刻画中国城市人口死亡率的时空变化特征,并采用空间回归方法,揭示城市PM<sub>2.5</sub>的平均浓度对人口死亡率的影响及其空间溢出效应,以及社会经济因素对PM<sub>2.5</sub>—人口死亡率关联的调节效应。结果表明:① 中国城市人口死亡率的空间分布特征呈现明显的异质性,高死亡率地区早期集聚分布于西南地区,2005年后在西南地区、华北地区、华东地区和华中地区呈现逐渐集聚分布态势。低死亡率地区长期集中分布于西北地区、东北地区、长三角地区、珠三角地区和京津两市。② 人口死亡率的分布存在空间关联性,高—高类型地区早期集中分布于西南地区,后期向东扩展;低—低类型地区主要分布于北疆、内蒙古西部和广东省及其周边地区。③ 城市PM<sub>2.5</sub>浓度对人口死亡率具有显著的正向影响,并且对邻近地区的人口死亡率具有显著的空间溢出效应。④ 中国城市PM<sub>2.5</sub>浓度对人口死亡率的影响存在学历差异和城乡差异,地区高学历人群集聚可降低PM<sub>2.5</sub>的健康风险,城镇化发展进程缓慢则会加重PM<sub>2.5</sub>的健康风险。研究旨在为防范空气污染暴露导致的健康风险、建设健康人居环境提供科学依据。
Effects of PM2.5 concentration on mortality in China: A study based on city-level panel data
中国县域国土空间集约利用计量测度与影响机理
[J].
DOI:10.11821/dlxb201412001
[本文引用: 1]
土地利用问题日益成为中国经济发展的重要约束力之一。快速城镇化背景下城镇和乡村的快速扩张吞噬了宝贵的土地资源,粗放非集约的利用方式更加剧了土地资源的浪费。从国土空间集约利用的影响机理出发分析中国县域国土空间集约的影响机理对指导集约利用实践以及宏观集约利用政策瞄准和政策矫正都具有特殊意义。综合运用OLS模型、空间面板滞后模型和空间面板自相关模型以GIS和Matlab为技术平台,构建中国县域发展基础数据库 (1992-2010年),定量刻画中国2286个县级单元的空间集约利用度时空变化格局,计量分析社会经济发展、自然环境本底、区位交通地理、宏观战略政策和历史基础5大类变量17项具体因素的影响机理。研究结果表明,空间面板数据模型的整体显著性和可信度检验略高于一般面板数据OLS模型;在固定相关效应后对各因素的影响机制进行了检验,表明工业化、城镇化、经济发展水平、区位、交通和宏观战略政策等因素对县域国土空间集约利用的影响较为明显。自然环境因素弱于社会经济因素。被忽略的历史因素对县域国土空间集约利用具有极显著的影响。未来县域国土空间集约利用应因势利导,强化有利因素,减小不利因素影响。提高工业化和城镇化发展水平和质量。发挥市场的主导作用,完善土地市场和运行机制。优化国土空间集约利用调控政策和管治手段,制定差别化的空间集约利用政策。以资源环境承载力为基础和约束最大限度地提高投入和产出水平。
Quantitative measure and influencing mechanism of land intensive use in China at the county level
DOI:10.11821/dlxb201412001
[本文引用: 1]
Land use issue is an important constraining force for economic sustainable development of China. Urban and rural rapid expansion depletes valued land resources under the background of rapid urbanization. An extensive use pattern might cause a serious waste of land resources. The study on influencing mechanism of land intensive use (LIU) in China at the county level is an important tool for effective LIU practice and policy-making. This paper uses OLS model, Spatial Panel Lagged model and Spatial Panel Error model to characterize the influencing mechanisms of five class factors and 17 variables supported by GIS (Geographic Information System) and MATLAB. And a comprehensive data set, including physical geography attributes and socio-economic information with 2286 counties, was developed. Meanwhile, the spatiotemporal pattern of LIU has been discussed by means of GIS. The results show that Spatial Panel Data models are slightly superior to OLS model in terms of significance and confidence level. Regression results of these models indicate that industrialization, urbanization, economic development level, location, transportation and policy have significant impact on LIU of counties. The variables of physical geography are less significant than socio-economic variables. An ignored variable of historical factor, however, became the most significant factor. In the future, the LIU at the county level should enhance favorable factors and reduce disadvantageous ones, which can be acquired by improving the entire level and quality of industrialization and urbanization. We argued that an efficient and complete land market and operating system should be built to reflect market-oriented activities at the first place. Then, according to regional differences, differential LIU regulation policies and measurements should be optimized. Meanwhile, we should pay close attention to the carrying capacity of local resources and environments when conducting LIU practices.
中国建设用地扩张对景观格局演化的影响
[J].
DOI:10.11821/dlxb201912011
[本文引用: 1]
探索建设用地扩张对景观格局变化的影响机理是理解人类活动对生态系统功能、格局和过程变化影响机制的关键。但中国全国尺度建设用地扩张过程对景观格局演化的影响研究明显不足。基于此,突破传统行政区划单元的分析方法,以覆盖全国的10 km格网为基本单元,基于1975-2014年建成区比率数据来表征建设用地扩张水平,运用同期土地利用数据计算相应的景观指数,定量刻画了建设用地扩张及景观格局的时空演化过程,并运用空间计量经济模型定量解析了建设用地扩张过程对景观格局演化的影响效应。同时,基于全样本、不同时间点、不同规模城市和不同区域城市的对比揭示建设用地扩张过程对景观格局演化影响的时空差异性。研究结果表明:40年间建成区比率值增长了3倍,高于同期的人口城镇化增长水平,东、中和西部间呈现出显著的梯度差异性,而且差异程度逐步增加,大、中、小城市之间的差异也较为显著。1975-1990年、1990-2000年和2000-2014年3个时间段的年均增速分别为5.87%、2.32%和2.32%。景观格局总体上也经历了显著变化,优势景观类型的主导性逐步降低,景观格局趋于破碎化,复杂度增强,邻近度趋于离散,聚集度逐步降低,结合度渐高,景观多样性和均匀度均有所提高。随着建设用地扩张水平的提高,景观越来越趋于破碎化,人类活动对景观的干扰强度和频率也不断增强。例如,建设用地扩张水平每提高1%将导致景观斑块数量提高0.45%左右。但是建设用地扩张水平与景观复杂度的变化在空间上存在错位。建设用地扩张水平的提高在一定程度上使同类型斑块间的距离变近,景观聚集度出现降低趋势,景观越来越呈现多种要素的密集格局,斑块聚合和集群性增强,相应的结合度也越来越高,景观均衡化趋势和均匀分布越来越明显。同时发现,不同规模城市和不同区域的影响差异显著,除地理区位因素差异性不显著外,其他控制要素也对景观格局演化具有差别化的影响。
Impacts of construction land expansion on landscape pattern evolution in China
DOI:10.11821/dlxb201912011
[本文引用: 1]
Exploring the impact mechanisms of construction land expansion on landscape pattern changes is one of the critical tactics to understanding how human activities affect ecosystem function, pattern, and process change. However, the lack of macro-scale data and spatial analysis methods on construction land expansion and landscape has hindered China's national scale study. In response to this, here we use the recently available built-up area ratio data and the corresponding land use data to characterize the spatiotemporal process of construction land expansion and landscape metrics between 1975 and 2014 based on the 10 km grids at the national scale. And the spatial econometric model was adopted to quantitatively investigate the influence mechanism of construction land expansion process on landscape pattern evolution. At the same time, the spatial-temporal heterogeneity of the influence of construction land expansion process on the evolution of landscape pattern is examined based on the comparisons, different scale cities and different regions of China. The study found that the value of built-up area ratio has increased by threefold in the past 40 years, which is higher than the growth level of demographic urbanization in the same period. The construction land expansion has significant gradient differences between the eastern, the central and the western regions, and the gradation of difference is gradually increasing. Average annual growth rates are 5.87%, 2.32% and 2.32%, respectively, in periods 1975-1990, 1990-2000 and 2000-2014. Meanwhile, the differences between large, medium-sized and small cities are also significant. Owing to the effects of frequent human activities, the landscape pattern has also experienced significant changes. For example, the dominance of leading type has gradually decreased, the landscape pattern has become fragmented, the complexity has increased, the proximity has become more discrete, the contagion has gradually decreased, the cohesion has increased, and landscape diversity and evenness have increased. With the improvement of construction land expansion level, the landscape is becoming more and more fragmented, and the intensity and frequency of human interference to the landscape are also increasing. Every 1% increase in the expansion of construction land, for example, caused a 0.45% increase in the number of patches. However, the changes in construction land expansion level and landscape complexity are spatially mismatched. To the extent that the improvement of the level of construction land expansion has brought the distance between the same types of patches and the contagion index has decreased, and the landscape became more and more dense and aggregating, and the corresponding cohesion degree is also getting higher and higher, and the landscape equalization and even distribution are more and more obvious. At the same time, it is found that the influences of different time periods, different scale cities and different regions are significant for impact mechanisms of construction land expansion on landscape pattern changes. Besides geographical location, the other control factors have different influences on the evolution of landscape pattern.
中国区域协调发展态势与政策调整思路
[J].
China's trends in regional coordinated development and ideas on policy adjustment
我国区域经济协调发展的趋势及特征分析
[J].
A study on the tendencies and features of the coordinated development of regional economy in China
城市“抢人大战”政策再定位: 聚焦青年流动人才的分析
[J].
Re-orientation of the policy of robbing people to fight in city: An analysis of focusing on young floating talents
基于GWR模型的中国城市雾霾污染影响因素的空间异质性研究
[J].
DOI:10.11821/dlyj020181389
[本文引用: 1]
基于全国城市的PM<sub>2.5</sub>监测数据,识别PM<sub>2.5</sub>的时空分布特征,并着重利用地理加权回归模型分析自然和社会经济因素对PM<sub>2.5</sub>影响的空间异质性。结果显示:2015年全国PM<sub>2.5</sub>的年均浓度为50.3 μg/m3,浓度变化呈现冬高夏低,春秋居中的“U型”特征;PM<sub>2.5</sub>的空间集聚状态明显,其中京津冀城市群是全国PM<sub>2.5</sub>的污染重心。地理加权回归结果显示:影响因素除高程外,其余指标均呈现正负两种效应,且影响程度具有显著的空间差异性特征。从回归系数的贡献均值来看,自然因素对城市PM<sub>2.5</sub>浓度影响强度由高到低依次是高程、相对湿度、温度、降雨量、风速、植被覆盖指数;各类社会经济指标对城市PM<sub>2.5</sub>浓度影响强度排名依次是人口密度、研发经费、建设用地比例、产业结构、外商直接投资、人均GDP。由于各指标对城市PM<sub>2.5</sub>浓度变化的影响程度存在着空间异质性,因此在制定大气治理对策时可以考虑不同指标影响程度的空间差异,从而使得治霾对策更具针对性。
Spatial heterogeneity of driving factors of urban haze pollution in China based on GWR model
DOI:10.11821/dlyj020181389
[本文引用: 1]
Based on the PM2.5 monitoring data of China's cities, we identified the spatial and temporal distribution characteristics of PM2.5 concentrations, and used the geographically weighted regression (GWR) model to analyze emphatically the spatial heterogeneity of the influence of natural factors and socio-economic factors on PM2.5 concentrations. The results showed that: in 2015, the average annual concentrations of PM2.5 in China was 50.3 μg/m 3, and the monthly concentration change presented a "U-shaped" pattern with a higher level in autumn and winter while a lower one in spring and summer. In addition, PM2.5 concentrations were high in cities of eastern and northern China, but low in cities of southern and western China. Beijing-Tianjin-Hebei urban agglomeration was the center of PM2.5 pollutions in China. The results of geographically weighted regression showed that: (1) in terms of natural factors, elevation had a negative correlation with the urban PM2.5 concentrations, while positive and negative correlations exist for other indexes, and negative correlation effect dominated, which is conducive to reducing PM2.5 concentrations in most cities. Thus it can be seen that the influence indexes of PM2.5 concentrations have significant spatial difference characteristics. From the mean contribution of the regression coefficient, the ranking of the influence intensity of natural indexes on PM2.5 concentrations were: digital elevation model, relative humidity, temperature, rainfall, wind speed, normalized difference vegetation index. (2) In terms of socio-economic factors, all the indicators showed positive and negative effects, with significant spatial heterogeneity. Among them, the build-up and GDP per capita were conducive to reducing PM2.5 concentrations in most cities, while population density, foreign direct investment, industrial structure and research and development expenditure can aggravate the air pollution in regions. The ranking of the influence intensity of socio-economic factors on PM2.5 concentrations were: population density, research and development expenditure, built-up, industrial structure, foreign direct investment, GDP per capita. (3) Due to the spatial heterogeneity of the influence of various factors on urban PM2.5 concentrations, the spatial difference of the influence of various indexes can be taken into account in the formulation of atmospheric governance countermeasures. Moreover, although natural factors have a more significant influence on PM2.5 concentrations, since it is difficult to change the natural conditions of cities artificially, specific strategies should be proposed from the perspective of social and economic factors in tackling haze.
中美房价比较分析: 基于Numbeo国际房价统计数据库的实证研究
[J].
A comparative analysis of house prices between China and America: An empirical study based on Numbeo international house price statistics database
