

城市活力的测度方式多样,因其关注点不同而存在差异。从表征形式来看,已有研究主要从经济、社会和文化等维度评价城市活力[7-8]。而更多学者则关注城市活力的微观表现,即城市中人口和活动的空间分布[9⇓-11]。传统研究主要基于活动日志或调查问卷等实地调查法,仅限于小范围的城市活力测度,其样本量较小,难以反映更大范围(城市尺度)的活力特征。随着大数据的普及和信息技术的发展,城市活力的精细化和规模化测度成为可能。移动位置数据、手机信令数据及GPS等多源大数据更多地应用于城市活力的测度。因此,本文使用百度慧眼的人口热力数据对武汉市主城区586个交通小区(traffic analysis zone,TAZ)的城市活力进行精细化测度,以期为武汉市主城区城市规划设计提供依据。交通小区根据城市主要道路和社区边界调整划分,从城市中心向外由密到疏。由于居民活动的时空约束不同,已有研究表明,城市活力时空特征及其建成环境影响在工作日与双休日存在差异[12]。部分学者指出,工作日的日常必要性活动(如上班)对城市活力测度造成影响,而在双休日相对充裕的可支配时间下,居民更有可能产生自发性活动[13⇓-15]。
目前,大量研究讨论了城市建成环境与城市活力的关系,从定性和定量的角度构建城市建成环境指标体系并分析其对城市活力的影响。2008年,Cervero等[16]构建“3D”建成环境量化体系,包括密度(density)、混合度(diversity)、设计(design)3个维度;随后,Ewing等[17]补充了目的地可达性(destination accessibility)和到公交站距离(distance to transit),完善为更全面的“5D”建成环境量化体系,为国内外建成环境测度提供强有力的依据。在此基础上,学者们对城市建成环境与城市活力的关系关注的视角也存在差异。如钮心毅等[18]更多地关注建成环境对街道活力影响的时空特征,塔娜等[19]等侧重于从多个尺度分析城市活力空间结构特征,司睿等[15]在测度三维建成环境的基础上关注其对街道活力的影响,王波等[12]则是关注二者之间关系的时空异质性,郭鑫等[20]区分了建成环境对不同年龄群体的活力影响。
在当前讨论周末城市活力的建成环境变量时,居住人口密度是最基本的变量,显然人口密度越大,可能潜在产生“位置服务”的数量越多,其成为居住区周边活力的被动影响因素,只有少部分人口密集区存在活力较低问题[19,21]。在公共空间的活力测度中,应更多地关注吸引居民主动地离开居住地出行的因素。建成环境包括交通、街道建筑设计、区位、土地利用及商业类型等与城市活力联系较为紧密[22]。交通便捷性和商业类型是广泛被讨论的变量,许多学者发现两者对城市活力影响较为显著,健全的交通设施建设和良好的可达性,特别是地铁站出入口的数量和可达性,被认为对城市活力产生积极影响[18,23]。在商业类型上,学者们意见不一致。如王娜等[14]认为POI密度对城市活力的提升最明显,而有学者认为商业类型不同时其对城市活力的影响并非平稳,如:刘彤等[24]认为周末城市活力与教育设施、餐饮设施和交通设施呈正相关,与金融设施和公共服务设施呈负相关;王波等[12]发现休闲设施密度、居住设施密度、交通设施密度和其他设施密度对城市活力具有显著的正相关效应。也有学者发现了商业类型影响的时间非平稳性,如司睿等[15]发现商业类型的高混合度在大部分时间内促进城市活力但在中午至晚间时段对活力的正向影响不显著。另外,行政中心、商业中心和大型综合体对城市活力起调节作用,CBD集聚大规模居民就业和休闲活动[25]。
梯度提升决策树(gradient boosting decision tree, GBDT)是机器学习的一种形式,通过集成多个决策树并组合这些决策树的结果作为最终结果输出。GBDT模型弥补了传统多元线性回归模型的一些缺陷:不遵循任何假设,且异常值影响较小,更好地解决多重共线性问题,更为精确地提供预测结果[28];同时,该模型输出的是因变量与自变量之间潜在的非线性关系,可以得到每个自变量作用的阈值[29],从而更好地揭示建成环境影响城市活力的最有效范围。同时,相较于普通的非线性模型,SHAP (Shapley additive explanations)方法具有很好的解释能力,可以用来解决机器学习的黑箱问题,可视化城市建成环境与城市活力之间真实的非线性影响。基于此,本文引入基于梯度提升决策树的SHAP可解释性模型(gradient boosting decision tree-Shapley additive explanations, GBDT-SHAP),探究建成环境特征对城市活力的影响及其非线性效应。
武汉作为中国中部最大的新兴城市,其经济、社会、文化建设呈现高速、高质发展趋势。随着社会经济发展的转型,城市建成环境剧烈变化对城市活力产生复杂多变的影响,探究武汉市城市活力、建成环境的空间特征及其影响机制,对感知城市发展现状,改善城市居民生活质量,激发城市空间活力具有重要价值。因此,本文基于百度慧眼的人口热力数据,以武汉市主城区586个交通小区为基本单元,度量其城市活力并量化空间特征。在此基础上,选择12个指标构建“5D”指标体系测度城市建成环境,运用GBDT-SHAP模型,探究武汉市主城区建成环境对城市活力的影响机制及其非线性效应,为城市的规划实践提供分析支撑。
1 研究区域、数据与方法
1.1 研究区概况
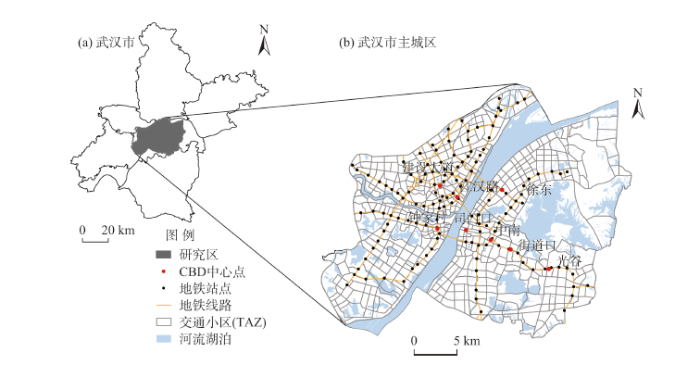
武汉市是湖北省省会城市,位于湖北省东部、长江与汉江的交汇地带,地跨113°41′~115°05′E、29°58′~31°22′N。作为中国中部地区的经济和交通枢纽,其常住人口在2021年已达到1364万人,经济高速发展的同时也带来了城市建成环境的剧烈变化。截至2018年底,已有9条地铁线路投入运营。作为城市人口主要聚集地的主城区,其面积为863 km2,容纳全市总人口的51.1%。因此,研究主城区建成环境与城市活力的影响机制对于优化武汉发展质量、提升其发展水平有重要意义。考虑到百度人口热力数据的覆盖率在社区层面支撑性不足,并且街道尺度各街道面积过大不能细化显示差异,而栅格单元则会将具有同质性的片区割裂,本文以交通小区为研究单元,结合路网和武汉城市规划单元进行调整,最终得到586个交通小区,平均面积为0.962 km2(图1)。交通小区作为依据一定原则和方法划定的、在交通和城市研究领域广泛应用的基本空间单元,能够尽可能地保留相似片区的同质性并细化城市内部的差异。
图1
1.2 数据来源及处理
本文基础数据主要包括人口热力数据、街景图像、土地利用数据、POI数据、公交地铁站点数据、道路网络数据。其中,人口热力数据来源于百度,具有连续性、动态性等优势。土地利用数据来源于第三次全国国土调查,本文中的商服用地数据与土地利用现状中的商服用地相对应(地类代码05)。POI数据来自于高德地图Web API接口,数据量较大、分类全面,在表征功能多样性时更有优势。公交地铁站点、道路网络数据来源于武汉市地理国情监测,该数据来源于武汉市测绘研究院,实行年度动态更新,在监测过程中数据校验与核对工作精细,数据可信度高。本文使用的数据为2019年末更新数据。街景图像来源于百度地图(
1.3 研究方法
1.3.1 城市活力测度
本文使用人口热力数据来表征城市活力,人口热力数据从百度慧眼接口(
1.3.2 建成环境指标测度
参照Ewing等[17]提出的“5D”指标体系,从密度、多样性、设计、可达性和与交通设施距离5个维度,综合考虑已有研究构建的建成环境指标体系,本文共选取12个指标进行建成环境指标测度,分为单元基础性大尺度宏观指标和小尺度采样指标2大类。其中,小尺度采样指标包括街道绿化度、街道安全度、天空开敞度3个街道建成环境指标,在三维层面通过行人视线角度反映街道设计,作为POIs等二维数据的补充和一种地块内部街道设计的汇总,这些指标应可为城市局部区域规划或改造提供设计参考。其余指标均为单元基础性大尺度宏观指标。为了减少变量多重共线性对结果带来的影响,对变量进行多重共线性检验,最终变量VIF值均通过检验。具体的指标构成和介绍如表1所示,部分指标的详细计算过程如下。
表1 指标定义与共线性诊断
Tab.1
| 指标 | 变量 | 变量解释 | VIF值 |
|---|---|---|---|
| 密度 | 人口密度(人/km2) | 单元内总人口数/单元总面积 | 2.868 |
| 设计 | 交叉口密度(个/km2) | 交叉口数量/单元总面积 | 7.031 |
| 道路中心性 | 单元内所有节点的邻近中心性的平均值 | 1.571 | |
| 商服用地比例 | 单元内商服用地面积/单元总面积 | 1.253 | |
| 街道绿化度 | 单元内各街景采样点的平均绿色植物像素占比 | 1.703 | |
| 街道安全度 | 单元内各街景采样点的平均街道设施,如栅栏、路灯、交通灯、摄像头、窗户等像素占比 | 1.277 | |
| 天空开敞度 | 单元内各街景采样点的平均天空像素占比,用于衡量街道建筑设计,天空开阔度越小说明街道建筑排布越紧密;反之,则越空旷。 | 3.156 | |
| 多样性 | POI混合度 | 兴趣点(POI)的区位熵 | 1.310 |
| 交通可达性 | 路网密度(km/km2) | 单元内路网长度/单元总面积 | 6.380 |
| 最近地铁站距离(m) | 单元中心点到最近的地铁站距离 | 1.543 | |
| 公交站密度(个/km2) | 单元内公交站数量/单元总面积 | 2.260 | |
| 目的地可达性 | 距CBD距离(m) | 单元中心点到CBD的最近距离 | 1.888 |
1) 单元POI混合度指标
采用单元内部POI的二级类别区位熵来表征单元功能多样性。本文所用的POI数据时间为2019年11月,包括餐饮服务、住宿服务、购物服务、科教文化服务、风景名胜、公司企业等23个大类和226个小类。二级类别的熵值越大,表示街道各类可访问设施的分布多样性越强,熵值越小,POI混合度越低,计算公式如下:
式中:
2) 街道建成环境指标
基于武汉市主城区路网数据,每隔50 m创建一个采样点,并根据0°、90°、180°与270°四个角度获取街景图片并拼接,最终获取研究区内街景图片近14万张。本文通过ADE20K数据集训练并使用全卷积神经网络FCN-8s进行图像语义分割,将图片内的像素映射到151个不同分类,对每个样本点4个街景图像中每类物体的像素比例取平均值,最终得到街道绿化度、街道安全度、天空开敞度3个街道建成环境指标(表1)。
3) 道路中心性
本文运用城市空间网络分析(urban network analysis,UNA)工具,测度武汉市主城区道路节点邻近中心性。邻近中心性反映该节点在网络中的相对可达性大小和节点重要性,计算公式如下:
式中:
1.4 模型构建
1.4.1 梯度提升决策树(GBDT)
GBDT是对多个决策树结果的组合,其对一组独立变量
式中:
首先,初始化决策树:
对于所有
式中:
其次,计算梯度下降步长:
将计算结果更新至模型,同时引入学习率
最终模型为:
对模型中的超参数进行调整,可以获得更优的模型结果。首先是学习率,较小的学习率可以改善模型的预测效果,但需要添加更多的决策树,为了平衡运行时间和预测性能,本文选取5000棵决策树,将学习率定为0.001,最大深度设置为3。
1.4.2 建成环境特征的非线性解释
式中:
2 结果分析
2.1 城市活力时空分布特征
本文以小时为单位,将全天平均城市活力和 0:00~6:00(凌晨)、7:00~12:00(上午)、13:00~18:00(下午)、19:00~23:00(晚上)4个分时段的平均城市活力分为5个层级显示,得到武汉市城市活力的分布(图2)。从空间上看,城市活力的高值区主要分布在两江交汇处以及地铁二号线沿线。从时间上看,从上午7:00开始城市活力逐渐提升,至下午和晚间达到顶峰。沿江大道、东湖吹笛景区、黄鹤楼景区、武汉火车站等景区及交通枢纽周边人口密度不高但城市活力较高,而青菱、青山、后湖、常青等外环居民区虽然人口密度高,但城市活力一般。
图2
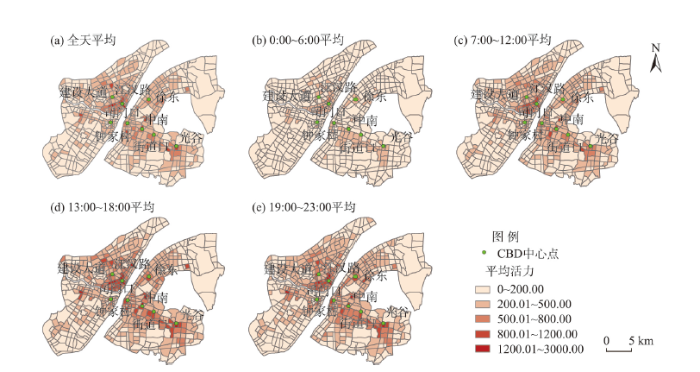
图2
武汉市主城区周末城市活力分时段空间变化
Fig.2
Spatial variation of weekend urban vitality by time period in the main urban area of Wuhan City
2.2 建成环境对城市活力的影响
2.2.1 SHAP变量重要性
如图3所示,每个时段的变量重要性是从上到下按大到小排列的,y轴上是各个变量,x轴上的位置由每个样本的SHAP值确定,颜色表示特征值的大小,为了更好地进行可视化,设置重叠的样本点在y轴方向上抖动。本文分别统计了全天和分时段的每个建成环境因子对城市活力影响的SHAP值并可视化,通过比较SHAP值的绝对值和排序变化分析建成环境对城市活力影响的时空效应。
图3
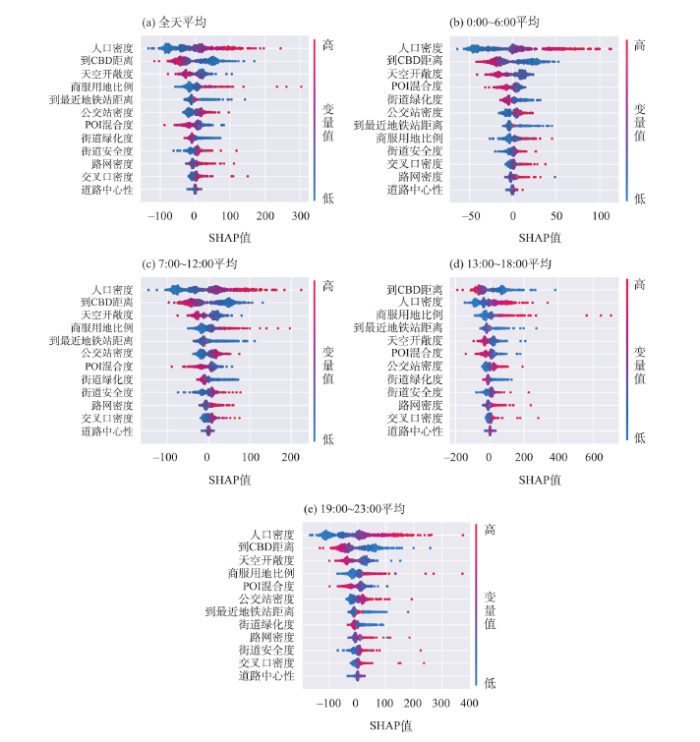
图3
全天和分时段各变量对武汉市主城区周末城市活力影响重要性
Fig.3
Importance of the impact of each variable on weekend urban vitality in the main urban area of Wuhan City for the whole day and sub-periods
从全天整体来看,人口密度(23.67%)、到CBD距离(18.46%)、天空开敞度(9.58%)、商服用地比例(8.92%)、到最近地铁站距离(7.11%)和公交站密度(7.02%)是最重要的前6个变量(图3a)。由于城市活力的主体是人,因此,毋庸置疑,受人口密度的影响较大[34];而到CBD距离、天空开敞度、商服用地比例等变量影响城市活力的重要性已在多项研究中被证实[15,35]。分时间段来看,最重要的前6个变量组成基本不变,但重要性排序各有不同。其中,7:00~ 12:00时间段与全天整体的变量重要性表现基本一致(图3c)。值得注意的是,POI混合度重要性在各时间段排序波动较大,这进一步验证了功能混合度对城市活力影响的边际不稳定效应[12]。
2.2.2 建成环境对城市活力的非线性影响
图4基于PDP (partial dependence plot)显示了不同特征对机器学习模型的预测结果的边际效应,描绘了当因变量为全天平均城市活力时,因变量与重要性前9个变量之间的非线性关系。其中,颜色变化表述了与该变量交互作用最强的另一变量在每一个交通小区上的值高低。相比于全局固定系数的线性回归模型,GBDT模型能够更加细化地捕捉到各个建成环境变量的局部影响趋势,而SHAP模型又能够更准确地解释每一个变量和样本如何影响因变量。
图4
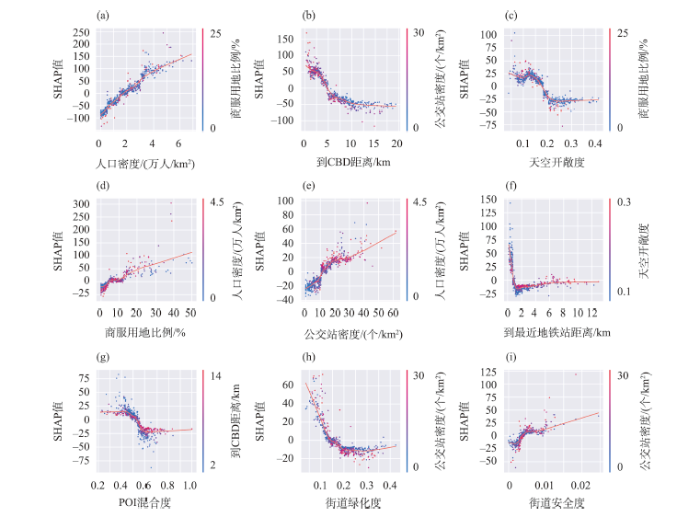
图4
建成环境对武汉市主城区周末城市活力的非线性影响
Fig.4
Nonlinear effects of the built environment on weekend population dynamics in the main urban area of Wuhan City
本文得到的研究结果验证了以往线性回归模型结果的准确性。人口密度越高,城市活力越高,两者呈现明显的正相关性(图4a),符合人们正常的认知[19]。商服用地比例与城市活力呈正相关关系,尤其是人口密度和商服用地比例都很高的区域,这些区域对城市活力的提升作用十分显著(图4d),说明高密度的商服设施分布可以促进居民开展各类活动,提高出行概率[12]。公交站密度的表现形式与商服用地类似,与城市活力呈现正相关性(图4e),人口密度较高的地区往往配备了更多的公交站点,两者共同促进了城市活力提升[14]。该结果验证了高交通可获取性可以提升出行可能性[36]。街道安全度对城市活力具有提升作用,呈现出一定的正相关关系(图4i),这说明围栏等安全设施可为驻留行人提供安全舒适的庇护,也能为非机动车和行人提供路权保障[15]。街道绿化度与城市活力呈现较明显的负相关性,与天空开敞度的影响效应相似(图4c、4h),城市外围的风景区和绿地依然有一定吸引力。
部分变量对城市活力存在局部影响趋势和阈值效应。如图4b,城市活力与到最近CBD的距离呈负相关。这与已有研究结果一致,距离商圈服务设施越近,则满足人的活动需求便利程度、出行活动概率相对提升,从而城市活力一定程度增加[20]。可以看到,大型商圈的影响范围阈值大致介于3000~4000 m,当距离超出这个阈值时,城市活力迅速衰减,直到超过10000 m趋于平稳。同样地,天空开敞度表现出对城市活力的负向影响(图4c),与司睿等[15]的研究结果相近,这主要是由于大部分人群都倾向于在室内或围合度较好、周边建筑物较多的城市街道中活动,这些地区的天空可视率较低。当天空开敞度大于0.22时,城市活力趋于平稳,而这些地区的商服用地比例一般较低,分析原因可能是受到视野较宽阔的风景区和公园广场的影响。如图4f,到最近地铁站距离表现出对城市活力的负向影响,总体来说,地铁交通对城市活力的影响主要在城市内部且地铁站服务范围在1500 m以内。当到最近距离在1500 m以内时,城市活力随着距离增加迅速衰减,这些地区的天空开敞度大多很低,说明其主要位于城市内部街道;当距离在2000 m以上时变化趋于平稳,此时天空开敞度较高的区域有利于提升城市活力,说明当周边缺少地铁交通时,城市外围的公园绿地、风景区同样受到人们青睐。POI混合度对城市活力的影响类似一个负向的Sigmoid曲线,在混合度0.5以下区间和0.6~1.0区间时,POI混合度对城市活力的影响趋势是平稳的,在0.4~0.6区间内,POI混合度与城市活力呈现明显的负相关性,并且随着到CBD的距离越近,其负相关性越显著(图4g)。这些现象说明居民在周末的购物选择增加,单一业态的商业街和综合商圈均受到欢迎[37],但居民对POI混合度存在容忍度阈值,城市功能过于混杂时,特别是在大型商圈周边,居民访问的兴趣会下降。因此,在进行商圈建设时应注意建设的阈值效应。
2.2.3 建成环境对城市活力影响的时间分异
在全天和划分的4个时段,每个变量的影响大致类似,但是在不同时段,部分变量的重要性和影响能力略有不同。在一天中的大部分时间段,人口密度是影响城市活力最重要的变量。值得注意的是,下午和傍晚时段人口密度对城市活力的影响减小,而到CBD距离成为影响力最大的变量,同时商服用地比例的影响作用提升,这主要是由于在周末的下午和傍晚,人们大量地离开居住地出行游玩、用餐,大型商圈对人群的吸引效应加强。变量公交站密度和离地铁站距离反映了交通可达性与城市活力之间的关系,可以看到在上午、下午和傍晚,地铁交通对城市活力的影响比其余时间更高,这可能是地铁交通的运营时间导致的。同时,由于地铁交通在武汉市居民出行中发挥了重要作用[38],特别是早晚高峰期间,地铁对城市活力的影响不容忽视。交通设计类变量如道路中心性、路网密度和交叉口密度对于城市活力的影响相对有限,其变量解释能力均较弱[39]。图5a、5b分别显示了0:00~6:00和 13:00~18:00天空开敞度对城市活力的影响效应。尽管大致趋势相同,但结合图 3可以发现,天空开敞度的影响力清晨时段大于下午时段,且负向效应更弱,同时其影响力与街道绿化度关联密切,原因可能是部分居民的晨练习惯造成的,居民在晨练时更愿意选择户外且绿化较好的场所[40]。
图5
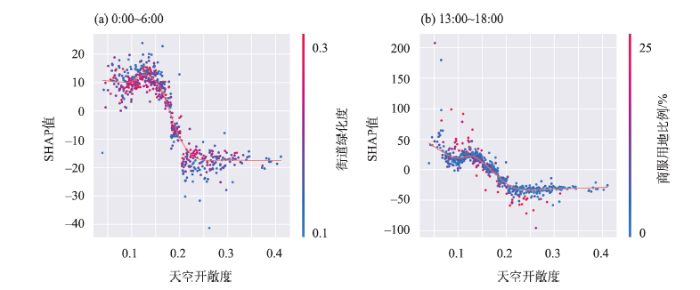
图5
天空开敞度对城市活力影响的时间差异
Fig.5
Temporal differences in the effect of sky openness on urban vitality
各类功能POI密度也呈现出时间效应。图6显示了多种类型POI密度在不同时段对城市活力的影响。在深夜和凌晨,住宿服务、医疗保健服务与生活服务具有最高的重要性且均呈现正边际效应。从上午开始,餐饮服务密度的影响力逐渐提高并在下午、傍晚和夜间呈现最强的正边际效应。在13:00~18:00,购物服务密度的重要性迅速提升,极大促进了城市活力的提升;与休闲活动相关的场所密度在午后至深夜正边际效应综合较强,这也正是居民周末的休闲时段[41]。夜间大型商场和综合体歇业后,小型餐饮休闲场所依然活跃。商务住宅密度的重要性13:00~18:00最低,说明在周末这一时段人们最容易离家活动。风景名胜密度重要性较低且大部分时段呈现负向影响,主要是因为许多景区远离城市中心,但在13:00~18:00负向效应几乎消失,说明在下午景区的访问量和活力大量提升。公司企业密度呈现时间上稳定的负向影响,这也进一步验证在周末居民活动受上下班通勤约束较少,自由时空活动选择更多。
图6
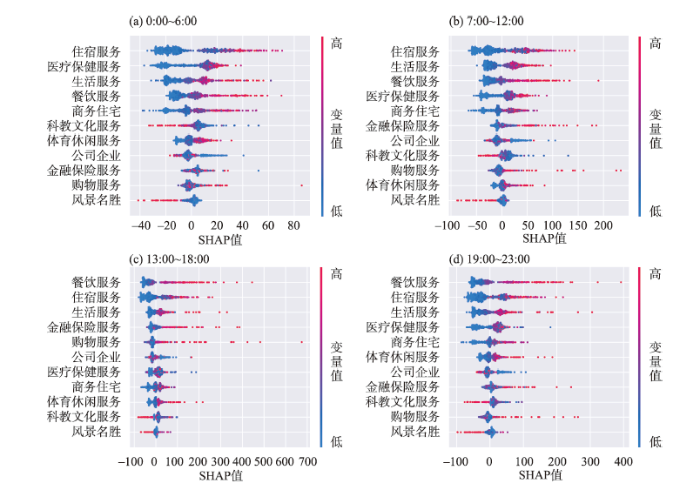
图6
不同类别POI密度对城市活力影响的时间差异
Fig.6
Temporal differences in the impact of different categories of POI density on urban vitality
3 结论与讨论
本文运用机器学习模型GBDT-SHAP分析城市建成环境对城市活力的非线性影响及阈值效应,探讨了城市建成环境和城市活力的潜在关系,监测了每个城市建成环境因子的边际收益,得到一些最佳阈值经验,为规划者激活城市空间活力、保障居民的出行和生活质量提供了科学的参考,主要结论为:
(1) 武汉市主城区城市活力的分布具有明显的时间、空间异质性。从空间上看,城市活力在两江交汇处以及地铁二号线沿线较高。从时间上看,从7:00开始,城市活力逐渐提升,下午和晚间最高。
(2) 武汉市主城区建成环境显著影响了城市活力的分布,且其非线性影响和阈值效应明显,SHAP值弥补了传统多元线性模型在可解释性上的不足。从全天整体来看,影响城市活力最强的前6个变量分别是:人口密度(23.67%)、到CBD距离(18.46%)、天空开敞度(9.58%)、商服用地比例(8.92%)、到最近地铁站距离(7.11%)和公交站密度(7.02%)。同时,建成环境对城市活力的时间分布影响较小,且功能混合度对城市活力影响存在边际不稳定效应。
(3) 各变量对城市活力的局部表现为:大型商圈的阈值为3000~4000 m;POI混合度在0.4~0.6区间内与城市活力存在显著的负相关性,并且其负相关性随着到CBD的距离越近越显著。因此,在进行大型商圈建设时,规划者应考虑大型商圈的潜在服务范围,实现居民3000~4000 m大型商圈可达性,同时考虑居民对POI混合度的容忍阈值约束商圈周边环境。
在路网建设方面,地铁交通对城市活力的影响主要在城市内部且地铁站服务范围在1500 m以内。当周边缺少地铁交通时,公园绿地、风景区同样受到人们青睐。因此,规划者可以通过保障居民1500 m范围内的地铁可接驳、交通可达性较低的区域增设公园绿地和风景区等措施以营造与发展城市活力,提升城市居民生活质量。
(4) 部分变量对城市活力存在时间驱动效应。到CBD的距离、离地铁站距离、天空开敞度这3个变量随时间变化对城市活力的影响重要性会发生相应变化。大型商圈对人群的吸引效应在周末的下午和傍晚加强。地铁交通对城市活力的影响在上午、下午和傍晚比其余时间更高。贯彻以公共交通为导向的开发(transit-oriented development,TOD)理念,做好地铁交通与大型商圈衔接,是提升城市活力的有效措施[42]。天空开敞度的影响力清晨时段大于下午时段且负向效应更弱,同时其影响力与街道绿化度关联密切,设置室外空旷空间有利于促进居民晨练、社交活动。商业类型对城市活力影响存在时间效应,下午至夜晚居民离家进行休闲活动意愿强烈,餐饮休闲类场所对城市活力的正边际效应较强。除规划大型商圈外,增加小型餐饮休闲类场所密度也是一种促进城市活力提升的有效方式。
本文研究结果可为武汉市主城区规划建设和功能布局提供参考和建议,但仍存在一定的局限。第一,由于大数据的脱敏性,导致其缺乏个人社会经济背景,后续研究可以考虑加入一些个人社会属性的大数据,如性别、年龄、收入等[43],探究不同特征人群对城市活力的非线性影响。第二,选用交通小区作为研究单元虽然一定程度上保证了可行性,却依然面临着可塑性面积单元问题(modified areal unit problem, MAUP)[44],城市活力和建成环境变量的测度会受单元划分方案影响,导致影响最终阈值,未来可进行多个尺度的对比研究。第三,本文重点观察了双休日居民自发性活动,弱化了必要性活动的约束作用,在未来的研究中,可以探索工作日与双休日非线性效应的差异。在居住人口密度与活力高度相关的情况下,居民主动出行带来的活力提升对于公共空间的活力研究更具价值,未来的研究中应思考进一步关注被动居住和主动出行活力的变量交互作用。第四,由于空间特征的地域性,虽然本文得到的阈值是否适用于其他地区有待考证,但所用研究方法存在一定的科学依据和现实意义,可以为后续研究提供新的思路。
参考文献
Making a city: Urbanity, vitality and urban design
[J].DOI:10.1080/13574809808724418 URL [本文引用: 2]
基于时空间行为的城市生活圈规划研究: 以北京市为例
[J].
A study on life circle planning based on space time behavioural analysis: A case study of Beijing
Close encounters with buildings
[J].DOI:10.1057/palgrave.udi.9000162 URL [本文引用: 2]
Modelling the factors of neighbourhood attractiveness reflected in residential location decision choices
[J].DOI:10.2457/srs.36.393 URL [本文引用: 1]
城市公共空间活力评价体系研究
[J].
Evaluation system research on vitality of urban public space
基于模糊物元模型的城市活力评价
[J].
Evaluation of urban vitality Based on fuzzy matter-element model
基于大数据的山地城市活力评价: 以重庆主城区为例
[J].
DOI:10.18402/resci.2020.04.10
[本文引用: 1]

在中国快速城市化进程中出现了大量的城市病,导致城市品质下降和区域发展失衡。城市活力为研究城市问题提供了一个新的视角,而大数据的蓬勃发展为城市活力研究提供了准确高效的新手段。本文采用人口热力、兴趣点(POI)和街景活力感知3个指标构建评价体系,对重庆主城的城市活力进行定量评价。结果发现:重庆主城区的城市活力分布呈现多中心的分布特征,与其“多中心、组团式”的城市结构相契合。3个指标评价出的城市活力在空间格局上具有相似性,城市活力高的区域主要分布在重庆内环内侧,尤其是解放碑主中心及活力相对较高的沙坪坝、杨家坪、观音桥、南坪副中心,而外围活力高的区域对应茶园、西永等内环以外的副中心和城市组团,这一结果与街景活力感知得分较为符合。研究认为,基于大数据对重庆城市活力进行客观识别和评价,为城市活力定量研究提供了一种新的思路和视角,弥补了传统定性分析方法的不足。针对山地城市的研究,同时弥补了已有文献在山地城市活力研究方面的不足,对空间规划有一定的参考价值。
Vitality assessment of mountainous cities based on multi-source data: A case of Chongqing Municipality, China
DOI:10.18402/resci.2020.04.10
[本文引用: 1]
With the rapid urbanization in China, the emergence of urban diseases has led to the decline of urban quality and urban vitality. Urban vitality provides a new perspective for the study of urban issues. The use of big data provides an accurate and efficient means for the study of urban vitality. Based on the dimensions of population heat map and point of interest (POI) distribution, this study quantitatively evaluated the urban vitality in the central city of Chongqing, and validated the derived vitality values based on the score of street view perception. The results show that the spatial distribution of urban vitality in Chongqing is characterized by multi-center distribution, which is consistent with its multi-center and clustered urban structure. The urban vitality evaluated by three indicators is similar in spatial pattern. It shows that the areas with high urban vitality are mainly located in the inner ring of Chongqing, especially in the main center of Jiefangbei and sub-centers, such as Shapingba, Yangjiaping, Guanyinqiao, and Nanping. The areas with high urban vitality correspond to the sub-centers of Chayuan and Xiyong outside the inner ring. This result is also consistent with the score of street view perception. The study confirms that the evaluation of urban vitality based on big data can compensate for the deficiency of traditional qualitative analysis methods and provide a new way of thinking and perspective for the quantitative study of urban vitality. The study of a mountainous city also addresses the deficiency of the existing studies on mountain city vitality and can help policy making in spatial planning.
基于多源数据的城市活力评价与空间关联性分析: 以常州市主城区为例
[J].
Evaluation and spatial correlation analysis of urban vitality based on muti-source data: A case of Changzhou, China
武汉市中心城区道路中心性对人口活力的影响研究
[J].
Study on the influence of road centrality on population vitality in central district of Wuhan
建成环境对城市活力影响的时空异质性研究: 基于大数据的分析
[J].
DOI:10.13249/j.cnki.sgs.2022.02.009
[本文引用: 5]
城市地理与城乡规划一直关注建成环境对城市活力的影响,但鲜有研究揭示该影响的时空异质性。城市活力表现为居民在实体空间上的分布及其活动,并呈现时间动态变化特征。通过采集广州市中心城区新浪微博签到数据以及建成环境大数据,在1 km×1 km方格网、2 h时间段的时空单元上可视化城市活力的时空动态变化特征,基于时空地理加权回归模型 (GTWR) 揭示区位、功能混合度与密度对城市活力影响的时空异质性,并对比工作日与双休日的差异。研究发现:① 广州中心城区城市活力呈现东西带状的“多节点”空间格局,在24 h内经历“分散-集聚-进一步集聚-分散”的时空动态变化。② 区位、功能混合度与密度对城市活力的边际效应表现出空间和时间双重维度的不稳定性。③ 由于居民活动的时空约束不同,城市活力时空特征及其建成环境影响在工作日与双休日存在差异。
The spatio-temporal impacts of the built environment on urban vitality: A study based on big data
DOI:10.13249/j.cnki.sgs.2022.02.009
[本文引用: 5]
Urban vitality reflects human activities and their interactions with spatial entities, which exhibits both spatial and temporal variations. However, the spatio-temporal variations have not been well addressed in existing research on the impacts of the built environment on urban vitality. Based on a collection of Sina Weibo check-in records and POI-based built environment data in central Guangzhou, this research visualizes the urban vitality at the scale of 1 km×1 km grid and 2 h period over one day. Geographically and temporally weighted regression (GTWR) are used to unveil the influence of location, density, and diversity on the urban vitality and their spatiotemporal heterogeneity. The difference between urban vitality and the impacts of the built environment on weekdays and on weekends have also been examined. The results show that: 1) the urban vitality in central Guangzhou extends along the east-west strip, with White Goose Pool, Beijing Road, Shangxiajiu Road, Zhuajing Newtown, Pazhou as the agglomerations. In one day, the urban vitality experiences dynamic changes from relatively scattered to agglomeration during the daytime and keep further agglomeration till midnight. 2) Although the location, density, and diversity significantly influence urban vitality, their impacts vary across space and time over a 24-h period. Generally, distance to the city center is negatively associated with urban vitality, while diversity and the density of leisure, housing, transport, and other facilities are positively associated with urban vitality. 3) Due to a lower activity constraint of space and time on weekdays and on weekends, their urban vitality and the spatio-temporal impacts of the built environment are obviously different.
北京街道活力: 测度、 影响因素与规划设计启示
[J].
Street vibrancy of Beijing: Measurement, impact factors and design implication
基于多源数据的城市活力空间特征及建成环境对其影响机制研究: 以深圳市为例
[J].
DOI:10.13284/j.cnki.rddl.003406
[本文引用: 3]
采用城市POI、手机信令数据及夜间灯光遥感数据,以深圳市为例,构建城市活力度量指标分析城市活力的空间特征。构建“5D”指标体系度量城市建成环境,并运用地理探测器,探究建成环境对城市活力的影响机制。结果表明:1)深圳市城市综合活力显示出“南强北弱,西强东弱”的空间分异特征,空间分布极不均衡。城市综合活力最主要反映的是社会活力。2)城市综合活力、经济活力、社会活力、文化活力均受到建成环境的显著影响。高POI密度、高建筑密度、高平均建筑层数和高土地利用混合度对城市活力具有显著促进作用。3)居住人口密度与路网密度、土地利用混合度与路网密度等交互作用对城市活力产生更为积极的影响。4)在影响机制中,建筑密度、平均建筑层数为底层支撑因素,POI密度、土地利用混合度为直接驱动因素,居住人口密度为诱发因素,距行政区中心距离、交叉口密度、路网密度、地铁站点密度和公交站点密度为调节因素。
Spatial features of urban vitality and the impact of built environment on them based on multi-source data: A case study of Shenzhen
DOI:10.13284/j.cnki.rddl.003406
[本文引用: 3]
As a key index to evaluate whether a city is attractive or has a healthy, comprehensive, and sustainable development potential, urban vitality is critical to the future development and construction of a city. Exploring the mechanism of how the built environment influences urban vitality from the perspective of urban morphology can be conducive to future urban space planning and design and can provide city planners with quantitative and scientific decision-making support. This study uses urban POI, cellular signaling, and nighttime light remote sensing data from Shenzhen to measure its cultural, social, and economic vitality, which constitutes a comprehensive vitality assessment of the city. Spatial features of these urban vitalities were then analyzed to further illustrate their distribution patterns. Using Bivariate Moran's I method, the spatial autocorrelations between economic, social, and cultural vitality were calculated. From the five dimensions of Density, Design, Diversity, Distance to Transit, and Destination Accessibility, the 5D detection index system was constructed to measure the urban built environment. This study also used GeoDetector to detect and analyze the spatial differentiation between various built environmental factors and comprehensive, economic, social, and cultural vitality and to explore the mechanism of the influence of the built environment on urban vitality. The results show that: 1) The spatial distribution of comprehensive vitality is extremely uneven in Shenzhen, with a higher vitality in the southern and western regions of Shenzhen city and a lower vitality in the northern and eastern regions. Areas with higher comprehensive vitality usually developed along the main roads and metro lines and are distributed in strips along the coastline of central-southern and western Shenzhen. The high-value areas of the urban comprehensive vitality center are primarily concentrated in city- or district-level commercial centers, and employment centers. Comprehensive vitality in Shenzhen reflects social vitality. 2) Urban comprehensive, economic, social, and cultural vitality are significantly affected by the built environment, as indicated by the 5D system. High POI and building density, average building floors, and land use entropy, have significant positive impacts on urban vitality. However, residential population density did not have a significant impact on each aspect of urban vitality. 3) Some interactions between built environment factors had a greater impact on urban comprehensive vitality, such as residential population density, road network density, land use entropy, and road network density. Overall, the interaction between building density, average building floors, land use entropy, and other factors, have a more positive impact on each aspect of urban vitality. 4) The presentation of urban comprehensive vitality is the result of multiple dimensions and factors. In the influencing mechanism of urban comprehensive vitality, building density and average building floors were the fundamental factors. POI density and land use entropy were the direct driving factors. Residential population density was an inducing factor. Distance from the administrative center, intersection density, road network density, metro station density, and bus station density were adjustive factors. The research results therefore provide valuable suggestions for the optimal allocation of resources and the rational layout of urban functional facilities in Shenzhen.
基于街景数据的建成环境与街道活力时空分析: 以深圳福田区为例
[J].
DOI:10.13249/j.cnki.sgs.2021.09.005
[本文引用: 6]
建成环境对街道活力的影响是国内外城市研究的热点议题。然而,对于建成环境要素的测度与评估多偏重于二维建成环境指标,尚未充分挖掘三维建成环境指标。以深圳市福田区为例,采用街景数据、路网数据、POI数据及移动互联网位置服务数据,建立周末分时段模型,探讨商业街道和生活街道活力的时空间分布特征及建成环境对其产生的影响。结果表明:① 商业街道上居民全天活动的峰值时段为18:00~20:00,生活街道上居民全天活动的峰值时段为11:00~13:00。② 深圳市福田区街道活力总体呈现多中心结构,随时间变化显现出明显的空间差异。③ 不同的建成环境指标对街道活力的作用时段与影响程度存在差异。提高功能混合度有利于提升商业街道凌晨、上午和夜间的活力及生活街道午后和傍晚的活力;过宽的相对步行宽度对生活街道活力提升有抑制作用,更安全的步行环境对商业和生活街道夜间活力提升有促进作用;界面连续程度高的商业街道午后及夜间的活力更强,界面多样性丰富的生活街道白天活力更强。
Spatio-temporal analysis of built environment and street vitality relationship based on street-level imagery: A case study of Futian District, Shenzhen
DOI:10.13249/j.cnki.sgs.2021.09.005
[本文引用: 6]
The last decades have witnessed a steady increase in studying urban vitality. However, the information that could depict 3D space has not been included in studies. This research attempts to incorporate street view imagery data to elaborate the spatiotemporal variability of vibrancy in Futian District, Shenzhen. As for the street-level physical environment, attributes are extracted from street view images by deep machine-learning algorithms SegNet. 2D built environment indicators of streets were extracts from the Open Street Map and POI points. A multivariate econometric are framed to examine the association between urban environment and the vitality at the street level of commercial streets and residential streets. The results showed that: 1) The peak hours of activity on commercial streets are 18:00 to 20:00, and the peak hours of activity on living streets are 11:00 to 13:00. 2) Futian District Street Vitality Shows Polycentric Structure, whose distribution had shown obvious spatial differences with time. 3) Variations in the temporal and degree effects of different built environment indicators on street vitality. Increasing the mix of facilities contributes to the morning and nighttime vibrancy of commercial streets, as well as the afternoon vibrancy of living streets. More compact streets have a positive impact on commercial streets’ vitality, and safer pedestrian environments have a positive impact on both living and commercial streets’ vitality. Improving the building continuity will promote the vitality of commercial streets. Higher interface richness increases the vitality of living streets in afternoon and evening. An increase in the richness of the interface will promote the daytime vitality of the residential street.
Suburbanization and transit-oriented development in China
[J].DOI:10.1016/j.tranpol.2008.12.011 URL [本文引用: 1]
Travel and the built environment
[J].DOI:10.1080/01944361003766766 URL [本文引用: 2]
基于LBS定位数据的建成环境对街道活力的影响及其时空特征研究
[J].
Influence of built environment on street vitality and its spatiotemporal characteristics based on LBS positioning data
DOI:10.22217/upi URL [本文引用: 2]
基于大数据的上海中心城区建成环境与城市活力关系分析
[J].
DOI:10.13249/j.cnki.sgs.2020.01.008
[本文引用: 3]
运用大众点评数据、出租车到达数据与文化设施POI数据测度城市活力的经济、社会和文化维度,在街区和街道层面分析城市活力的空间结构特征,建立计量模型分析城市建成环境对城市活力的影响关系。结果表明:①上海中心城区城市活力表现出明显的空间差异,主要表现为由中心向四周递减、浦西优于浦东的总体特征;②街区和街道尺度影响城市活力的建成环境因素存在差异;③街区尺度建成环境对城市社会、经济和文化活力的影响存在差异:提升人口密度对经济活力具有正面影响,过高的人口密度可能不利于社会和文化活力发展;增加POI密度、路网密度和POI混合度有利于城市活力的提升;建筑层数和建筑密度的增加会降低街区的社会活力和文化活力,但会提升街区的经济活力;交通可达性有利于经济活力的提升。
Relationship between built environment and urban vitality in Shanghai downtown area based on big data
DOI:10.13249/j.cnki.sgs.2020.01.008
[本文引用: 3]
Research on urban vitality has drawn more attention from different disciplines and perspectives such as urban geography, urban planning and urban government. Urban vitality is not only an important symbol of urban sustainable development, but also an important factor for cities to retain high-skilled talents, which could improve the competitiveness of the city. Studying urban vitality is conducive for us to re-understanding the city in a new perspective and improving urban human-oriented planning and management for the government, especially for some megacities and international cities which contain a large population. Urban vitality, consisting of economic vitality, social vitality and cultural vitality, reflects the level of urban development capacity and quality of life, which is also closely related to the citizens. In order to discover the urban vitality in Shanghai, this paper uses multi-source data, including dianping’s data which counts the number of businesses in the studying area to reflect the economic vitality, urban taxi arrival data in one week to reflect the social vitality and cultural facilities data in the studying area to reflect cultural vitality, to measure urban vitality from two scale: both block and sub-district level. Based on this comprehensive measurement, this article intends to analyze the spatial outcome characteristics of urban vitality in different blocks and sub-districts. This article also establishes a regression models for analyzing the impact mechanism of urban built environment which consists of multiple elements on urban vitality. It is found that the urban vitality of Shanghai is higher in the central area, decreasing from the central area to the surrounding area in the city. In the meanwhile, the value of urban vitality in Puxi area is higher than Pudong area, which means the daily activities and communication in Puxi area are more dynamic than these in Pudong area. Apart from differences between Puxi and Pudong areas, there are also distinctions regarding to the factors of built environments effecting the urban vitality between block level and street level. On the block level, it is found that the built environments effect significantly to different types of urban vitality and the comprehensive vitality. What’s more, for each vitality, the effect shows in different ways. Specifically, the increase of population density will influence the urban vitality by firstly in an active way then in a passive one. Especially for social and cultural vitality, the high density of population is not beneficial. For the facilities, increase of POI density and road network density presenting completeness and POI mixing degree presenting the variety of land use will promote all kinds of the vitality and comprehensive vitality. In the respect of the design, the increase of average building layers and building density will reduce the social vitality and cultural vitality, but will enhance the economic vitality and comprehensive vitality of the block at the same time. And in terms of the access to public transportation, the distance to the nearest bus station will increase the economic vitality of the block. According to the discoveries about the spatial pattern and the effecting factors of urban vitality, this article proves improving the built environment is meaningful to the development of urban.
建成环境对城市不同年龄群体活力的时空异质性影响研究
[J].
Study on the impact of built environment on spatio-temporal heterogeneity of vitality of different age groups in cities
基于位置服务数据的城市活力研究: 以北京市六环内区域为例
[J].
Study on urban vitality based on LBS data: A case of Beijing within 6th ring road
空气污染对城市活力的影响及其建成环境异质性: 基于大数据的分析
[J].
DOI:10.11821/dlyj020200685
[本文引用: 1]
建设充满活力的城市空间得到地理和城乡规划学者的广泛关注。随着空气污染问题的加剧,空气质量影响居民在城市空间中的活动,但鲜有研究考察空气污染与城市活力的定量关系。基于广州市2019年新浪微博签到记录、日气象和空气质量数据、以及建成环境数据,本研究构建以街道为空间单元、以天为时间单元的面板数据,通过标准差椭圆(SDE)以及面板回归模型测度空气污染对城市活力的抑制效应以及该抑制效应在不同建成环境上的异质性。研究得到以下结论:① 城市活力SDE面积随空气质量指数(AQI)上升而收缩,轻度污染和中度污染的城市活力SDE面积仅为空气质量优的约80%和30%。② 运用空间面板回归模型控制街道的空间关联性后,空气质量指数(AQI)对城市活力具有明显负向影响,AQI每增加1个单位,日活动强度减少约0.10次/10 km<sup>2</sup>;当空气质量恶化到中等污染后,AQI每增加1个单位,日活动强度减少约0.14次/10 km<sup>2</sup>。③ 空气污染对城市活力的抑制效应在不同建成环境上存在异质性,POI密度、离城市中心距离强化空气污染对城市活力的抑制效应,而地铁站密度、道路交叉口密度、土地利用混合度则弱化空气污染对城市活力的抑制效应。本研究有助于更好厘清空气污染、建成环境与城市活力的关系,并为优化建成环境以缓减空气污染对城市活力抑制效应提供分析支撑。
The impact of air pollution on urban vibrancy and its built environment heterogeneity: An empirical analysis based on big data
DOI:10.11821/dlyj020200685
[本文引用: 1]
Urban vibrancy describes people’s interactions with urban space. And enhancing urban vibrancy is important for urban sustainable development, and thereby attracts the interest of both geography and urban researchers and policy makers. Although evidence suggests that air pollution may influence people’s out-of-home activity, few studies have quantitatively measured how air pollution depresses urban vibrancy. On the basis of Sina Weibo check-in data and daily weather and air quality data in Guangzhou in 2019 and the built environment of this city, this study compiles samples of city vibrancy in 150 neighbourhoods and 365 days, forming a strongly balanced panel dataset. By Standard Deviational Ellipse (SDE) analysis and both general and spatial panel regression models, this study examines how air pollution negatively influences urban vibrancy and the heterogeneity role of the built environment in this depression effect. Our findings demonstrate that urban vibrancy space varies across different levels of air quality index (AQI). Specifically, the size of SDEs of urban vibrancy when AQI is between 50-150 and 150-200 is about 80% and 30% of that when AQI is no more than 50. After we control the spatial dependence (i.e., spatial autocorrelation), spatial panel regression results reveal that air pollution significantly lowers urban vibrancy. The daily activity intensity decreases 0.10 times per ten kilometers with a one-unit increment in AQI. More seriously, once AQI is above 150, this depression effect grows to 0.14 times per ten kilometers with a one-unit increment in AQI. We also test the heterogeneity role of the built environment in this depression effect. The results indicate that while POI density and distance to city center increase the depression effect, the density of metro stations and interactions and land-use diversity decrease the depression effect. It is evident that the depression effect of air pollution on urban vibrancy is not evenly distributed, varying across neibourhoods with different built environment characteristics. Compared to the city center, the outskirts bear a larger depression effect. Therefore, urban vibrancy space may be more polarized when air quality deteriorates and thus, challenging urban spatial restructuring development. Our spatial panel data analysis at the neighourhood scale improves our understanding of the mechanism among air pollution, built environment, and urban vibrancy, which provides evidence-based support for built environment planning and management at the neighbourhood scale to decrease the depression effect of air pollution on urban vibrancy.
沈阳市城市功能区分布与人口活动研究
[J].
DOI:10.12082/dqxxkx.2018.180075
[本文引用: 1]
从精细尺度上研究城市功能区分布与人口活动规律对于政府和相关部门合理调节城市内部资源配置、安排城市设施布局具有重要意义。以沈阳市中心城区为例,根据核密度估计原理,基于兴趣点(POI)数据探索沈阳市中心功能区分布情况,通过解读多时相百度热力图数据,探索工作日和周末城区人口时空分布规律,即从城市人口活动和城市功能设施分布2个角度解读沈阳市中心城区空间结构与组织形式。借助SPSS 20.0分析人口热度和设施分布的相关性关系,建立多元线性回归模型。主要结论如下:① 沈阳市城市活力区呈现多中心分布模式,大多位于商业中心、金融中心或者城市功能复合中心。② 工作日人口高热区空间分布较周末更为分散,面积较大,早晚波动较大。周末人口高热区主要集中在商业中心和城市复合功能区且白天存在较大波动。③ 功能区分布与人口热度显著相关,其中生活服务设施、金融设施、交通设施、住宿设施和景点设施是工作日人口热度的主要影响因子;教育设施、餐饮设施、交通设施、金融设施和公共服务设施是周末人口热度的主要影响因子。
Distribution of functional areas and population activities in Shenyang City
城市活力与建成环境“3D”特征的关系研究: 以武汉市为例
[J].
Identifying the relationship between urban vitality and the "3D" characteristics of built environment: A case study of Wuhan, China
How does the station-area built environment influence metrorail ridership? Using gradient boosting decision trees to identify non-linear thresholds
[J].DOI:10.1016/j.jtrangeo.2019.04.011 URL [本文引用: 2]
Exploring the non-linear associations between spatial attributes and walking distance to transit
[J].
A working guide to boosted regression trees
[J].
DOI:10.1111/j.1365-2656.2008.01390.x
PMID:18397250
[本文引用: 1]
1. Ecologists use statistical models for both explanation and prediction, and need techniques that are flexible enough to express typical features of their data, such as nonlinearities and interactions. 2. This study provides a working guide to boosted regression trees (BRT), an ensemble method for fitting statistical models that differs fundamentally from conventional techniques that aim to fit a single parsimonious model. Boosted regression trees combine the strengths of two algorithms: regression trees (models that relate a response to their predictors by recursive binary splits) and boosting (an adaptive method for combining many simple models to give improved predictive performance). The final BRT model can be understood as an additive regression model in which individual terms are simple trees, fitted in a forward, stagewise fashion. 3. Boosted regression trees incorporate important advantages of tree-based methods, handling different types of predictor variables and accommodating missing data. They have no need for prior data transformation or elimination of outliers, can fit complex nonlinear relationships, and automatically handle interaction effects between predictors. Fitting multiple trees in BRT overcomes the biggest drawback of single tree models: their relatively poor predictive performance. Although BRT models are complex, they can be summarized in ways that give powerful ecological insight, and their predictive performance is superior to most traditional modelling methods. 4. The unique features of BRT raise a number of practical issues in model fitting. We demonstrate the practicalities and advantages of using BRT through a distributional analysis of the short-finned eel (Anguilla australis Richardson), a native freshwater fish of New Zealand. We use a data set of over 13 000 sites to illustrate effects of several settings, and then fit and interpret a model using a subset of the data. We provide code and a tutorial to enable the wider use of BRT by ecologists.
Greedy function approximation: A gradient boosting machine
[J].DOI:10.1214/aos/1013203450 URL [本文引用: 2]
Synergistic effects of the built environment and commuting programs on commute mode choice
[J].DOI:10.1016/j.tra.2018.08.041 URL [本文引用: 1]
Nonlinear effect of accessibility on car ownership in Beijing: Pedestrian-scale neighborhood planning
[J].
Capturing gender-age thresholds disparities in built environment factors affecting injurious traffic crashes
[J].DOI:10.1016/j.tbs.2022.08.003 URL [本文引用: 1]
A unified approach to interpreting model predictions
[C]
建成环境对出行行为的影响研究进展与展望
[J].
Progress and prospects of the research on built environment and residents' travel behavior
基于多源数据的滨水公共空间活力评价研究: 以黄浦江滨水区为例
[J].
Vitality assessment of waterfront public space based on multi-source data: A case study of the Huangpu River waterfront
Built environmental impacts on commuting mode choice and distance: Evidence from Shanghai
[J].DOI:10.1016/j.trd.2016.06.001 URL [本文引用: 1]
上海居民购物行为的时空间特征及其影响因素
[J].
A study on activity space of shopping of Shanghai residents: Temporal and spatial characteristics and relative influencing factors
城市轨道交通通勤与职住平衡状况的关系研究: 基于大数据方法的北京实证分析
[J].
DOI:10.18306/dlkxjz.2019.06.001
[本文引用: 1]
城市轨道交通网络的发展在提高居民通勤效率的同时也对其职住平衡状况产生了一定影响。论文以北京市206个轨道站点为例,基于高斯混合模型(Gaussian mixture model, GMM)和一卡通刷卡数据将轨道站点按职住功能进行分类,利用腾讯“宜出行”定位数据考察轨道站点周边的动态人口分布并计算就业居住比。研究发现:① 中心城区的职住状况明显优于中心城区以外区域;② 轨道交通线网末端区域的职住平衡程度较差,仅有少数成规模的高端服务产业集中分布的轨道站点周边形成了区域性就业中心;③ 部分就业-居住较为均衡的城郊地区仍存在一定的职住不匹配现象。随后,通过计算一卡通出进站比和“宜出行”职住比得到出进站均衡度和职住平衡度,利用广义自回归条件异方差(generalized autoregressive conditional heteroskedasticity, GARCH)模型对轨道交通通勤和职住平衡程度进行相关性分析,研究结果表明:① 出进站均衡度与职住平衡度具有非常显著的正向关系,即站点进出站人数越接近,站点周边区域的职住状况越好;② 典型就业地站点与站点周边区域的职住平衡程度显著正相关,而典型居住地站点与站点周边区域的职住状况存在显著的负相关性。这表明,人口稠密的聚居区无法带动同样数量就业岗位的产生,而完善的就业中心能够吸引一定数量的人口在附近居住;③ 轨道站点的区位条件与职住平衡状况存在一定正向关系;④ GMM能够对属性复杂模糊的轨道站点进行有效的聚类分析;⑤ 具有实时性强、精确度高、覆盖度广、获取难度低等优点的“宜出行”数据能够在微观空间尺度下弥补其他捕捉和分析实时人口时空分布特征方法的局限性。
Relationship between urban rail transit commuting and jobs-housing balance: An empirical analysis from Beijing based on big data methods
DOI:10.18306/dlkxjz.2019.06.001
[本文引用: 1]
The development of urban rail transit (URT) network improves the commuting efficiency of residents while it has a certain impact on their jobs-housing balance. This study took 206 URT stations in Beijing as an example and classified them according to their jobs-housing functions based on the Gaussian mixture model (GMM) and smart card data. The dynamic population distribution characteristics around URT station were explored and jobs-housing ratio was calculated by "Yichuxing" position data. The study found that: 1) The jobs-housing balance in the central city is obviously better than that outside of the central city. 2) At the ends of the URT network, the jobs-housing balance is worse while only a few stations with concentrated distribution of top service industries have formed regional employment centers. 3) There still exists a certain degree of jobs-housing mismatch in the areas around some suburban stations where employment and residential functions are relatively equal. Station outflow-inflow and jobs-housing balances were calculated by the station egrass-ingrass ratio and the jobs-housing ratio, and the correlation between URT commuting behavior and jobs-housing balance was analyzed by generalized autoregressive conditional heteroskedasticity (GARCH) model. The results of this study indicate that: 1) There is a very strong positive relationship between URT station egrass-ingrass balance and jobs-housing balance. The closer the numbers of URT station outflow and inflow population, the better the jobs-housing balance around the URT station is. 2) There is a strong positive relationship between employment opportunity and jobs-housing balance around a URT station; and there is a strong negative relationship between residential function and jobs-housing balance around a URT station. This suggests that dense settlement will not generate the same quantity of jobs while well-developed employment hubs can attract a certain number of residents to live nearby. 3) There is a positive correlation between locational conditions of URT stations and jobs-housing balance. 4) The GMM can effectively cluster URT stations with complex and unclear attributes. 5) With its advantages of real-time data capturing, high precision, wide coverage, and great accessibility, "Yichuxing" position data can effectively compensate for the limitations of other methods on collecting and analyzing spatial-temporal characteristics of real-time population distribution at the microscopic scale.
建成环境对居民通勤方式选择的影响: 以武汉市城中村为例
[J].
DOI:10.18306/dlkxjz.2021.12.006
[本文引用: 1]
城中村作为带着农民特色和阶级混杂重塑的空间,为弱势劳动群体融入城市化体系、实现反资本而不反市场的城镇化进程提供了保障。探讨建成环境对居民通勤方式选择的影响机制,开展城中村建成环境改造,对于解决弱势群体通勤和就业困难意义重大。论文基于武汉市2018年LBS(Location Based Services)数据,以公共交通通勤方式选择作为二元分类因变量,采用梯度提升决策树(gradient boosting decision tree,GBDT)分析建成环境与城中村居民通勤方式选择的非线性关系与阈值效应,结果显示:普遍长距离通勤的城中村居民对公共交通系统依赖性强,建成环境的非线性影响和阈值效应明显,弥补了传统线性模型在可解释性上的不足;其中公交站可达性预测贡献度最大(19.89%),阈值分别在300 m和1000 m左右,在城中村改造时应尽量满足直线距离300 m公交站点可达,保证1000 m内存在公交线路,其余变量也有相似的可解释性。研究得到的建成环境影响的优先层次和最有效的空间属性范围将为提升城中村居民就业和通勤公平,实现区域包容、协调的城镇化提供参考。
Impact of the built environment on residents' commuting mode choices: A case study of urban village in Wuhan City
DOI:10.18306/dlkxjz.2021.12.006
[本文引用: 1]
As a space with farmers' characteristics and reshaped by mixed classes, urban villages provide a guarantee for the vulnerable groups to integrate into the urbanization system and realize the anti-capital but not anti-market urbanization process. Exploring the impact mechanism of the built environment on residents' commuting mode choices and carrying out inclusive renovation of the built environment of urban villages will be of great significance for addressing the commuting and employment difficulties of vulnerable groups. Based on the location based services (LBS) data of Wuhan City in 2018 and taking the choice of commuting mode as binary dependent variable, this study used the gradient boosting decision tree to explore the nonlinear relationship between the built environment and commuting mode choices of urban village residents and threshold effect. The results show that the residents of urban villages who commute for a long distance generally depend on the public transport system, and the nonlinear influence and threshold effect of the built environment are obvious, which make up for the insufficient interpretability of the traditional linear model. The contribution of bus station accessibility is the largest (19.89%) in prediction, and the thresholds are about 300 m and 1000 m respectively. In urban village reconstruction, bus station within a Euclidean distance of 300 m should be satisfied as far as possible, there must be bus lines within 1000 m, and other variables have similar interpretability. The impact priority level and the most effective spatial attribute range of the built environment obtained from this study will provide a reference for improving the employment and commuting equity of urban village residents and for realizing regional inclusive and coordinated urbanization.
集体晨练运动与城市公园空间组织特征显著性研究: 以哈尔滨市四个城市公园为例
[J].
significance analysis between morning exercise and spatial organization characteristics of urban park: Taking 4 urban parks in Harbin for example
基于签到数据的城市活动时空间动态变化及区划研究
[J].
DOI:10.13249/j.cnki.sgs.2015.02.151
[本文引用: 1]
借助新浪微博,引入位置服务大数据,以南京市为例,从时间、空间、活动3个方面分析城市活动空间的动态变化,并在掌握变化规律的基础上进一步划分城市活动区域。研究发现:传统的作息规律仍然支配着人们的签到活动,时间与活动内容间的对应关系仍然存在;居民活动在工作日、休息日与节假日,以及主城与外围地区存在差异;城市活动空间在一天内经历了相对分散-集聚-进一步集聚-分散-相对集聚的动态变化;城市活动区域可以划分为就业活动区、居住活动区、休闲活动区、夜生活活动区,及综合活动区;活动功能区呈现出混合化与边界模糊化的特征。
The dynamic changes of urban space-time activity and activity zoning based on check-in data in Sina web
DOI:10.13249/j.cnki.sgs.2015.02.151
[本文引用: 1]
Since 1990s, information and communication technologies (ICTs) have experiecned a rapid development over the world. Information and communication devices have almost penetrated into each aspect of people’s daily life, and thus become the necessities in the modern world. Under this advancement, the inner relationship among activities, time and location has been theoretically changed because of a serious of the responding tele-activities. However, we still have little knowledge from the empirical studies due to the lack of data. Besides, as a part of urban social space analysis, a dynamic analysis of urban activity space is even scarce, albeit with its importance in understanding the undergoing and future changes in the E-society. Especially in China where is under the socio-economic transition, understanding residents’ own need and their real-time activity as well as the influence of ICTs on activity space are quite necessary for the future urban management and planning. With the aid of Location-based service (LBS), Global Positioning System (GPS) and other applications, ICTs helps to record people’s real space-time activity, which is one of the main sources of big data in recent research. Among them, given by the soaring popularity of online social network such as Sina micro-blog (the most influential social networking platform in China) and the LBS check-in application, the check-in data undoubtedly provide a real-time big data for the study of urban activity space. Based on this understanding, this article tries to analyze the dynamic changes of urban space-time activity focused on activity, time, and location, using the LBS checking-in data from Sina micro-blog. The results show that: 1) although some research argued that residents’ activity schedule would be more flexible by the help of ICTs, in this study we find that the traditional routine still dominate in residents’ check-in activities, and thus the rhythm of check-in activities could be used to reflect the corresponding relationship between time and activity; 2) there are differences of residents’ check-in activity between on working days, weekends, and holidays, as well as between in downtown and in outskirts, which reveals the difference of daily activities in reality; 3) in a day urban activity space experience dynamic changes, specifically, varied from relative disperse to agglomeration in the morning (6-12 O’clock) and keeps further agglomeration till the afternoon (12-18 O’clock); while encounters dispersion in the evening (18-24 O’clock), though with a relative agglomeration in the night (0-6 O’clock); 4) according to the dynamic changes, activity zones are subdivided into office area, bedroom area, leisure area, nightlife area, and multifunctional area; 5) these activity zones could be generally characterized as hybrid, within a blurred boundary.
城市活力与建成环境的非线性关系和阈值效应研究: 以广州市中心城区为例
[J].
DOI:10.18306/dlkxjz.2023.01.007
[本文引用: 1]
城市地理与城乡规划一直关注城市活力与建成环境的关系。论文以广州中心城区为例,通过采集百度热力图、建筑矢量数据、路网数据、兴趣点数据等多源空间大数据,应用梯度提升决策树模型,探究建设强度、功能性质和交通可达性3个维度的建成环境要素对城市活力影响的非线性关系和阈值效应,并对比工作日白天与夜间的影响差异。研究发现:① 容积率对城市活力塑造的相对重要性最高,其次是休闲设施密度与公交密度,且白天与夜间的差异不显著。合理的开发建设强度、集聚的休闲与办公设施、公交导向交通发展,更有助于塑造充满活力的城市。② 各建成环境要素与城市活力之间均存在非线性关系和阈值效应,且部分建成环境要素白天与夜间的差异较明显。研究结论可为精细化的建成环境规划与治理以促进城市活力提供一定的政策启示。
Nonlinear associations between urban vitality and built environment factors and threshold effects: A case study of central Guangzhou City
DOI:10.18306/dlkxjz.2023.01.007
[本文引用: 1]
The relationship between urban vitality and the built environment has always been a subject of intense research in urban geography and planning. Traditionally, global regression techniques have been mostly developed to analyze their quantitative relationship based on a linear consumption. However, the results from existing studies are rather mixed, indicating that their relationship may not be global. Therefore, it is necessary to explore the local characteristics of the associations between urban vitality and the built environment. Based on a collection of multi-source datasets including Baidu Heat Map data, building data, road network data, and point of interest data in central Guangzhou City—including Liwan, Yuexiu, Tianhe and Haizhu districts, this study applied the gradient boosting decision tree model to unveil the nonlinear associations of built environment characteristics (including intensity, function, and accessibility) with urban vitality and threshold effects. The differences in the impacts of the built environment between daytime and nighttime on weekdays have also been examined. The results show that: 1) During both the daytime and the nighttime, floor area ratio contributes the greatest to urban vitality, followed by the intensity of recreation and public transport facilities. Compared to diversity, reasonable development intensity, concentration of leisure and office facilities, and public transport oriented development have larger collective contributions to urban vitality. 2) Although differences exist between daytime and nighttime, all built environment variables have nonlinear associations with urban vitality. The threshold value and gradient of key built environment variables are recognized in the nonlinear shapes of associations. Urban planners and local governments are recommended to meticulously disentangle the complicated built environment associations to make informed and targeted interventions for fostering and maintaining urban vitality.
基于居民时空行为的社区日常活动空间测度及活力影响因素研究: 以南京市沙洲、南苑街道为例
[J].
DOI:10.18306/dlkxjz.2021.04.004
[本文引用: 1]
新时期人本导向的社区生活圈规划转型关注居民的日常活动对社区空间的利用情况,从而反映出居民对社区公共服务设施的使用需求。但目前研究较少关注不同类型居民的差异化时空行为特征,不能有效应对社区居民的差异化需求。论文结合行为地理学的理论,利用手机信令数据,基于居民出行活动的频率和密度测度其核心活动空间和弹性活动空间,分析不同类型人群日常活动特征。以南京市沙洲和南苑街道为例,划定不同社区中,青少年、青年、中年和老年群体的日常活动空间,并从日常活动范围和活力的视角分析居民对社区空间利用的基本特征及群体间差异。研究结果表明,居民的日常活动空间表现出层次性、共享性和方向性,且不同年龄群体的日常活动空间存在显著差异;进一步利用相关性检验分析不同群体社区活力的影响因素,提出考虑不同群体活动空间和设施需求的公共服务设施差异化供给策略。研究有助于完善基于居民时空间行为测度社区日常活动空间的方法,丰富对社区居民差异化行为需求的认知。实证研究的结论对基于居民差异化空间和设施需求的社区公共服务设施配置具有一定指导意义。
Measurement of community daily activity space and influencing factors of vitality based on residents' spatiotemporal behavior: Taking Shazhou and Nanyuan streets in Nanjing as examples
DOI:10.18306/dlkxjz.2021.04.004
[本文引用: 1]
In the new era of China's development, people's needs for living space have become diversified. At the community level, the transformation of the planning of a human-oriented community life circle needs to pay attention to residents' daily activities to use the community space, thereby reflecting residents' use of community public service facilities. This demands to identify the daily activity space of residents. However, current research has paid little attention to the differentiated spatial and temporal behavior characteristics of different types of residents, and cannot effectively respond to the diverse needs of community residents. Based on the theory of behavioral geography, this research proposed a method of using mobile phone signaling data to measure the core activity space and flexible activity space based on the frequency and density of residents' travel activities, and then analyze the characteristics of daily activities of different types of people. Taking Shazhou and Nanyuan streets in Nanjing City as examples, the daily activity space of adolescent, youth, middle-aged, and elderly resident groups in different communities was delineated, and the basic characteristics of residents'use of community space were analyzed from the perspective of daily activity range and vitality differences among groups. The research results show that the daily activity space of residents shows hierarchical, sharing, and directional features, and there are significant differences in the daily activity space of different age groups. Further, by using the correlation test to analyze the influencing factors of the vitality of different groups of the communities, we proposed a differentiated supply strategy for public service facilities that considers the activity space and facility needs of different groups. This research is helpful for improving the method of measuring the daily activity space of community based on the spatiotemporal behavior of residents, and enriching the understanding of the diverse behavior needs of community residents. The conclusions of the empirical research have certain guiding significance for the allocation of community public service facilities based on residents' diverse space and facility needs.
社会经济统计数据热点探测的MAUP效应
[J].
MAUP effects on the detection of spatial hot spots in socio-economic statistical data
DOI:10.11821/xb201210003
[本文引用: 1]
The study of spatial distribution of population and economic situations is important for government policy making. County-level agriculture statistical data in 2000 and Beijing's second economic census data in 2008 were collected in order to explore the hot spots' scale effects. First, China's county-level agriculture statistical data and Beijing's second economic census data were aggregated to different scales based on certain aggregation rules. Second, hot spots detection was implemented based on G value at each scale respectively. Third, the changes of hot spots at different scales were analyzed. Fourth, factors affecting the changes were identified by employing Logistic Regression Model and a prediction model was built. Results show that, space hot spots explored by G value have significant MAUP effects. The higher the aggregation level, the greater the spatial scale, the less the number of hot spots. The number of units in a hot spot on the confidence level of 99.9% has a significant effect on the changes of hot spots. The mean G value of a hot spot on the confidence level of 98% has a significant effect on the changes of hot spots. Hot spots will become less susceptible to MAUP when they have more units and a larger G value. When the hot spot distribution is already known in the fine scale, changes of a hot spot can be predicted based on the model we built, which depends on unit number that the hot spot contains and mean G value of the hot spot. The prediction accuracy of China's county-level agriculture statistical data can reach 93.8% and that of Beijing's second economic census data can reach 94.2%. The consistent conclusion of the two datasets shows that scale effects on the detection of spatial hot spots have nothing to do with variables and study areas.
