改革开放40多年来,中国经济发展取得举世瞩目的成就,但同时也面临低福祉增长以及突出的资源消耗和环境污染问题[1 ] ,这不仅影响中国经济发展质量,而且制约着中国区域协调发展新格局构建。一方面,随着发展观由以经济增长为核心逐步转向“以人民为中心”,发展目标也从经济主导逐步转向人民福祉提升[2 ] ;另一方面,中国各地区在可持续发展进程中,由于经济增长和福祉改善的驱动作用,造成其生态福利绩效存在明显的区域差异[3 ] 。因此,准确测度中国生态福利绩效水平,揭示中国生态福利绩效变化的时空格局演变特征及其驱动效应,对推进中国生态文明建设、促进新时期区域可持续协调发展具有重要意义。
生态福利绩效与生态效率的主要区别在于,前者是提升人类福祉的生态效率[4 ] ,后者一般指的是经济产出对应的生态效率[5 ] 。从最早提出生态效率概念的D a l y [6 ] 的观点来看,生态效率本质上衡量的是单位自然消耗带来的福祉产出。可见,基于福祉产出的角度,生态效率就是生态福利绩效,只不过在经济主导发展观下,G D P [7 -8 ] 。此外,本文认为生态福利绩效也可理解为生态福利产出的效率,即生态福利在效率上的延伸。需要指出的是,这种研究下的生态福利是指人类从生态系统中直接获取或享有的终端产品和服务,其关注的焦点是提升生态福利的效率,这与本文生态福利绩效的内涵有着明显的不同。
在生态福利绩效的测度方法上,现有研究主要运用效率模型法或比值法[9 -10 ] 。诸大建等[11 ] 最早将生态福利绩效定量表示为人类发展指数与生态足迹的比值;臧漫丹等[12 ] 用出生时预期寿命与人均生态足迹的比值测度了1996—2007年G 20 C o m m o n [13 ] 应用生活满意度与预期寿命的乘积构建了快乐生活寿命指数,并应用快乐生活寿命指数与生态足迹指数的比值测度了143个国家的可持续发展水平;龙亮军[14 ] 将主观满意度纳入评价指标体系,基于两阶段Super-NSBM(Super-efficiency Network SBM)模型测度了中国35个主要城市的生态福利绩效,研究表明主观和客观的综合评价能更真实地反映居民福利水平。随着测度方法与指标选取日渐丰富,生态福利绩效的时空格局演变特征与驱动效应逐渐成为学者研究关注的重点。邓远建等[15 ] 发现2004—2017年中国生态福利绩效整体水平明显降低,在空间上呈现出东部最高、中部次之、西部最低的空间梯度递减格局;方时姣等[3 ] 研究表明,2005—2016年中国生态福利绩效呈上升下降交替演变趋势,表现出从东部到中部再到西部依次递减的空间格局;冯吉芳等[16 ] 运用对数平均迪氏指数法(logarithmic mean divisia index,LMDI)探究中国生态福利绩效的驱动效应,发现服务效应对生态福利绩效表现为抑制作用,而技术效应表现为促进作用;刘国平等[17 ] 采用L M D I [4 ] 将生态福利绩效分解为经济增长的生态效率与经济增长的福利效应,应用D E A - M L ( data envelopment analysis-Malmquist Lenberger)指数模型进一步分解经济增长的生态效率,研究表明技术进步是中国经济增长最重要的驱动因素,其次是规模效率变化;钟水映等[18 ] 将绿色发展福利分解为福利脱钩指数与绿色经济效率,运用D E A M a l m q u i s t
由文献评述可知,现有研究围绕生态福利绩效积累了较为丰硕的成果,但仍有如下拓展空间:① 随着“以人民为中心”的发展思想日益深入,幸福感已成为测度福祉水平不可或缺的主观维度,采用主客观综合指标衡量福祉是生态福利绩效测度的研究趋势[13 ,19 ] ,但目前基于主客观综合福祉视角的生态福利绩效定量研究成果尚不多见;② 已有生态福利绩效的时空格局演变研究多关注中国东中西三大区域以及省级区域的差异[3 ,15 ] ,但对中国南北区域之间的生态福利绩效差异鲜有揭示;③ 现有生态福利绩效的驱动效应研究不仅忽视了人地关系和谐背景下主观幸福感因素带来的环境福祉效应及其变化,而且对中国生态福利绩效区域差异的原因,即驱动效应的区域异质性也缺乏探讨,同时,对经济增长效应的决定因素研究尚不充分,在变量选取和研究方法方面还有待改进[20 ] 。
为此,本文基于综合福祉指数构建生态福利绩效评价模型,对中国生态福利绩效的时空格局演变进行分析,然后运用LMDI方法和随机前沿分析法(stochastic frontier analysis,SFA),深入揭示经济增长与福祉改善对中国生态福利绩效变化的驱动效应及其区域异质性,探寻经济增长效应的决定因素,以期为因地制宜优化中国生态福利绩效空间结构和驱动效应、推进生态文明建设、促进中国新时期区域协调发展提供建议。
1 研究方法与数据
1.1 研究方法
1.1.1 基于综合福祉指数的生态福利绩效评价模型
参考相关文献[11 ,13 ] ,将生态福利绩效(E W P ) 定义为单位自然消耗带来的福祉水平提升,并用综合福祉指数与人均生态足迹指数的比值表示:
(1) E W P = C W I E F I = H D I × R H I E F I
式中:H D I R H I C W I H D I R H I E F I
H D I [4 ] 后得到:
(2) R H I = R H m a x ( R H ) , m a x ( R H ) ≠ 0
(3) E F I = E F m a x ( E F ) , m a x ( E F ) ≠ 0
式中:R H E F m a x R H m a x E F
1.1.2 生态福利绩效变化的驱动效应模型
(4) E W P = H D I × R H I E F I = G D P × R H I E F I × H D I G D P = G × E × S
式中:G = G D P E = R H I / E F I S =HDI/GDP,为单位经济产出对应的人类发展指数,反映社会福祉效应。
L M D I [21 ] 。根据L M D I t Δ E W P G e f f ) 、环境福祉效应(E e f f ) 、社会福祉效应(S e f f )3 个部分组成:
(5) Δ E W P = E W P t - E W P 0 = G e f f + E e f f + S e f f
(6) G e f f = ∑ E W P t - E W P 0 l n E W P t - l n E W P 0 × l n G D P t G D P 0
(7) E e f f = ∑ E W P t - E W P 0 l n E W P t - l n E W P 0 × l n R H I t / E F I t R H I 0 / E F I 0
(8) S e f f = ∑ E W P t - E W P 0 l n E W P t - l n E W P 0 × l n H D I t / G D P t H D I 0 / G D P 0
若驱动效应G e f f E e f f S e f f
1.1.3 经济增长效应的决定因素分解模型
(9) % Δ G D P = ( G D P t - G D P 0 ) / G D P 0
(10) G e f f = ∑ E W P t - E W P 0 l n E W P t - l n E W P 0 × l n G D P t G D P 0 = ∑ E W P t - E W P 0 l n E W P t - l n E W P 0 × l n 1 + % ∆ G D P % ∆ E F × % Δ E F
式(10)反映出经济增长效应与人均生态足迹以及经济产出的关系,实现相同经济产出的人均生态足迹越低,经济增长效应越强,越有助于驱动生态福利绩效提升。因此,根据B a t t e s e 等 [22 ] 的随机前沿生产函数,构建经济增长效应的决定因素分解模型:
(11) l n G D P i t = β 0 + β 1 l n K i t + β 2 l n L i t + β 3 l n E F i t + ν i t - u i t
(12) m i t = δ 0 + ∑ δ i z i t + ε i t
式中:K L E F ν i t - u i t ν i t u i t ν i t N ( 0 , σ ν 2 ) u i t u i t N ( m i t , σ u 2 ) z i t δ i ε i t β 0 δ 0
1.2 变量选取与指标说明
计算人类发展指数采用联合国开发计划署提出的方法,即健康指数、教育指数和收入指数的算术平均数。其中,健康指数通过平均预期寿命指标计算而成,由于缺少各省市非普查年份数据,2010年以前的平均预期寿命使用第五次全国人口普查数据,2010年及以后则使用第六次全国人口普查数据。教育指数由成人识字率与综合毛入学率加权平均计算而成,权重分别为2/3和1/3。成人识字率用15~64岁能读写人口占15~64岁总人口的比重估算,综合毛入学率用6岁以上在校生总人数占6~24岁总人口的比重估算。6岁以上在校生总人数为本科、专科、普通高中、初中、中等职业学校、小学和特殊教育(包括特殊教育学校、特设特教班、随班就读和送教上门等)的在校生人数之和。收入指数由按美元购买力平价因子调整后的人均G D P
居民幸福感的测量方法一般是通过问卷调查对受访者自我报告的幸福程度进行基数赋值[23 ] ,本文中的居民幸福感来自中国综合社会调查(C G S S ) 与中国家庭追踪调查(C F P S ) 数据集。在C F P S C G S S C G S S
人均生态足迹的核算需要考虑人类对耕地、林地、草地、渔业用地、建设用地和化石燃料用地等6种类型土地的需求面积,采用Wackernagel等[24 ] 提出的综合法:
(13) E F = 1 N ∑ i = 1 6 λ i E F i = 1 N ∑ i = 1 6 λ i ∑ j = 1 n P i , j / Y i , j
式中:λ i E F i i 2 ),N P i , j Y i , j i j 2 )。耕地足迹部分项目的消费量数据难以获取,而中国主要粮食自给率一直在95%以上,参考史丹等[25 ] 的做法,耕地足迹使用谷物、豆类、薯类、油料、棉花、烟叶、麻类和糖料的产量计算;林地足迹用干鲜瓜果类消费量计算;草地足迹用猪肉、牛羊肉、奶类、禽蛋的消费量计算;建筑用地足迹用电力消费量计算;渔业用地足迹用水产品消费量计算;化石燃料用地足迹采用煤炭、焦炭、原油、汽油、煤油、柴油、燃料油和天然气等8种能源产品的消费量计算。
经济增长效应的决定因素分解模型中,经济总产出以2005年为不变价的G D P [26 ] 的方法计算;劳动投入以就业人数表示。同时,结合现有文献[3 ,27 ] ,技术非效率项的影响变量选取如下:① 城镇化水平(C i t y ) ,用年末城镇人口占总人口比重衡量;② 能源消费结构(E n c s ) ,以煤炭消费量占总能源消费比重表征;③ 技术进步(T e c ) ,用研发支出占G D P I n d u s ) ,以第二产业增加值占G D P O p e n ) ,用货物进出口总额占G D P F d i ) ,用外商直接投资额占G D P
1.3 数据来源
由于C F P S [28 ] ,东中西三大区域划分采用学界一般通行做法[29 ] 。美元购买力平价因子来自世界银行[30 ] 。2012年及以前的居民幸福感来自C G S S C F P S [25 ] 的研究。各省市年龄段人口数据来自2007—2019年《中国人口和就业统计年鉴》以及《中国2010年人口普查资料》,其他数据均来源于2007—2019年《中国统计年鉴》《中国能源统计年鉴》和各省市统计年鉴。
2 结果分析
2.1 中国生态福利绩效的时空格局演变分析
2.1.1 中国生态福利绩效的时序演进
利用式(1)对2006—2018年中国生态福利绩效进行了测算,结果见图1 。
图1
图1
2006—2018年中国生态福利绩效的时序演进趋势
Fig.1
Temporal evolution of EWP in China during 2006-2018
由图1 可知,2006—2018年中国生态福利绩效整体呈下降趋势,E W P [31 ] ,人均生态足迹指数增速加快,E W P [32 ] ,长期以来煤炭一直是中国的主体能源,这使得中国人均生态足迹指数居高不下,即使在2014年后增速放缓,其年均增速也达到了3.088%。中国人类福祉水平有所提升,但综合福祉指数的年均增速仅为1.877%,远低于人均生态足迹指数的增速。其中,中国人类发展指数稳步提升,从2006年的0.747升至2018年的0.850,中国迈入高人类发展水平梯队。中国居民幸福感指数则是波动提升,从2006年的0.787升至2018年的0.865,年均增速仅0.791%,这与何晓斌等[33 ] 的测算结果相近。
2.1.2 中国生态福利绩效的空间格局
从空间格局演变来看,2006年中国南方省份的生态福利绩效整体高于北方,生态福利绩效排名前5的省份中有4个南方省份,而北方大多数省份生态福利绩效较低,内蒙古、山西、宁夏、辽宁、山东、新疆等省份的生态福利绩效排名处在全国靠后位置(图2 )。2018年,中国生态福利绩效整体降低的态势明显,30个省份中仅有10个省份生态福利绩效有所提升,其中8个都位于南方。尤其是四川、重庆和湖南,生态福利绩效一直保持在较高水平,年均增速分别为0.78%、0.59%、0.45%。而宁夏、内蒙古、山西、新疆、黑龙江以及陕西等北方省份,生态福利绩效分别年均降低7.99%、4.01%、2.42%、6.05%、2.67%、4.05%。可见,中国生态福利绩效的南北差异不断扩大,呈现出“南高北低”的空间分异特征,这与刘煜等[34 ] 的研究结论一致。
图2
图2
2006年和2018年中国生态福利绩效的空间格局对比
注:该图基于自然资源部标准地图服务网站下载的审图号为GS(2020)4619号标准地图制作,底图无修改。下同。
Fig.2
Comparison of the spatial pattern of China's EWP in 2006 and 2018
2.2 中国生态福利绩效变化的驱动效应分析
2.2.1 全国层面
应用L M D I 图3 所示。由图3 可知,2006—2018年中国生态福利绩效变化的经济增长效应一直表现为增量效应,而环境福祉效应与社会福祉效应基本上表现为减量效应,3种驱动效应共同导致了中国生态福利绩效的整体降低趋势。具体来看,2006—2008年中国生态福利绩效提升了0.181,这主要归功于经济增长效应与环境福祉效应的共同驱动,但社会福祉效应对中国生态福利绩效起到了抑制作用,说明人类发展水平的提高滞后于经济发展阻碍了这段时期生态福利绩效提升。2008—2016年,中国生态福利绩效大幅下降,由3.233跌至2.604,这一时期经济增长效应对中国生态福利绩效变化仍表现为促增作用,但环境福祉效应却表现为促减作用,与社会福祉效应共同掣肘中国生态福利绩效提升。2016—2018年,中国生态福利绩效由2.604提升至2.641,这一变化依赖经济增长与环境福祉改善实现,但社会福祉效应对生态福利绩效变化依然表现为制约作用,即人类发展水平提高滞后于经济增长的局面仍旧未变。
图3
图3
2006—2018年中国生态福利绩效变化的驱动效应
注:时段I、II、III、IV、V和VI分别表示2006—2008、2008—2010、2010—2012、2012—2014、2014—2016和2016—2018年。图4同。
Fig.3
Driving effects of EWP changes in China during 2006-2018
从分效应来看,经济增长效应是2008—2016年间唯一的增量效应,说明中国生态福利绩效变化主要依赖经济增长效应驱动,但随着中国经济由高速增长阶段迈向高质量发展阶段,经济增速放缓,经济增长效应呈式微态势。环境福祉效应仅在2006—2008、2016—2018年间表现为积极的增量效应,其余年份均表现为减量效应,这意味着单位自然消耗的主观幸福感效应偏低制约着中国生态福利绩效提升。尤其是2008—2012年,环境福祉效应的促减作用愈发凸显,即居民幸福感在提升过程中实际上付出了更大的生态代价。2012年后,随着党的十八大明确指出大力推进生态文明建设,中国绿色发展成效卓著,居民幸福感持续提高,环境福祉效应的抑制作用趋于减弱,从2016年开始与经济增长效应“双轮”驱动中国生态福利绩效提升。此外,社会福祉效应对中国生态福利绩效变化一直表现为减量效应,且效应值最低,说明中国生态福利绩效提升主要受到低福祉增长的制约。中国仍需加大在基础设施、医疗卫生等民生领域的公共服务投入,以促成人类发展指数与经济发展水平同步提高。但可以看出,社会福祉效应的抑制作用也呈减弱趋势,这表明中国经济增速放缓之后,随着全面小康社会建成,“重经济发展、轻福祉增长”的传统发展模式已出现转变。
2.2.2 区域层面
按照同样的方法,计算了2006—2018年南北区域及东中西三大区域生态福利绩效变化的驱动效应。由图4 可以看出,南北区域及东中西三大区域的生态福利绩效变化整体上均显现为经济增长驱动模式,与全国生态福利绩效变化的驱动模式一致。在环境福祉效应与社会福祉效应的双重制约下,南方地区与北方地区的生态福利绩效均呈下降趋势,但南方地区的经济增长效应值明显更高,生态福利绩效从2006年的3.341降至2018年的3.281。而北方地区却由于经济增长动能乏力,生态福利绩效从2006年的2.579降至2018年的2.276,南方省份与北方省份生态福利绩效的平均值差距也由此从0.762扩大至1.005。从东中西三大区域来看,中部和西部地区总的经济增长效应值较高,分别为3.338和3.294。然而,中部和西部地区经济增长却并未带来其人类福祉水平的同步提升,社会福祉效应明显弱于东部地区,这使其生态福利绩效在2006—2018年分别下降了0.255和0.469。东部、中部和西部地区总的环境福祉效应均表现为减量效应,分别为-0.120、-0.637、-0.944,中西部地区促减作用更为明显。东部地区经济转型升级取得明显成效,生态环境治理与生活质量改善在全国起着示范作用,环境福祉效应仅产生轻微抑制作用,加之经济增长效应的推动,其生态福利绩效在2006—2018年提高了0.159。
图4
图4
2006—2018年中国南北区域及东中西三大区域生态福利绩效变化的驱动效应
Fig.4
Driving effects of EWP changes in the southern (a) and northern (b) regions and the three regions of eastern (c), central (d) and western (e) China during 2006-2018
2.2.3 省域层面
再从省域来看(图5 ),四川、贵州、湖南等省份的生态福利绩效提升依靠经济增长驱动,但人类发展水平提升与经济增长的不协调问题较严重,说明应加大社会福利支出,持续优化基础设施建设,使经济发展成果更好惠及人民。北京、天津和上海的生态福利绩效提升主要得益于经济增长与环境福祉改善,社会福祉效应表现为抑制作用。安徽、江西、陕西、甘肃等省份经济取得了快速增长,但环境福祉与社会福祉的抑制效应拉低了其生态福利绩效水平。宁夏、新疆等省份的生态福利绩效降低则归咎于经济增长动能乏力以及自然资源消耗过度,加强生态环境保护与修复、转变发展模式是其扭转生态福利绩效下降趋势的主要途径。整体来看,所有省份的经济增长效应均表现为增量效应,尤以四川、重庆、贵州、湖南和安徽最为突出,而山西、内蒙古、宁夏和新疆等省份的经济增长效应偏弱。环境福祉效应在中国绝大部分省份都表现为减量效应,但在北京、天津和上海表现为增量效应,可见,北京、天津和上海在提高资源利用效率和居民幸福感等方面具有明显优势,这成为其生态福利绩效提升的重要推力。所有省份的社会福祉效应均表现为减量效应,“低福祉增长”问题需要引起重视。比较而言,仅北京、天津、上海为“经济增长+环境福祉改善”组合驱动模式,其余省份均是依靠经济增长的驱动模式。
图5
图5
中国省域生态福利绩效变化的驱动效应比较
Fig.5
Driving effects of provincial EWP changes in China
2.2.4 经济增长效应的决定因素分析
由上文可知,中国生态福利绩效变化主要依赖经济增长效应驱动,那么,决定经济增长效应的因素主要有哪些?为此,本文进一步应用F r o n t i e r 4.1 软件对经济增长效应的决定因素进行估计,具体结果如表1 所示。由表1 可以看出,γ σ 2 L R S F A
(1) 全国结果分析。由表1 中全国样本可以看出,技术进步是经济增长效应最重要的决定因素。近年来中国持续加大研发投入力度,代表研发成果的发明专利授权量大幅增长,特别是绿色专利授权量在2006—2010年内年均增长36.34%,大大提高了生产效率,使技术进步对经济增长效应发挥着十分显著的促进作用。对外开放和外商直接投资也是经济增长效应重要的决定因素,这主要与对外开放和外商直接投资能够带来先进管理经验和技术溢出效应,提高资源利用效率的同时刺激国内企业技术升级有关[3 ,35 ] 。城镇化水平的回归系数显著为正,对经济增长效应表现为抑制作用。中国城镇化水平从2006年的43.90%提高至2018年的59.58%,由此产生的要素集聚效应虽提高了生产效率,但伴随农村人口向城市转移,也不可避免地产生了一系列资源消耗与环境污染问题[36 ] ,造成生态足迹升高。产业结构和能源消费结构的回归系数也显著为正。中国第二产业具有高能耗、高污染、高排放等特征[37 ] ,而2006—2018年中国煤炭消费占能源消费总量的比重均值高达67.23%,与风能、水能等清洁能源相比,煤炭能源利用效率较低,不仅不利于“双碳”目标实现,还导致生态足迹居高不下。
(2) 区域异质性分析。南北区域层面上,技术进步的回归系数在南方和北方地区均显著为负,这印证了其对经济增长效应的重要性。能源消费结构的回归系数在南方地区为负值,在北方地区却显著为正,说明北方地区能源消费结构有待优化。外商直接投资的回归系数在南方地区显著为负,但在北方地区为正值。可能的原因是北方地区引进的外商投资多表现为非环境偏向型,在节能减排与环境治理方面并未产生实质性效果。
进一步从东中西三大区域层面来看。城镇化水平的回归系数在中部地区显著为负,在东部和西部地区却显著为正。这可能是,东部地区部分城市存在“大城市病”,西部地区正处于城镇化加速推进阶段,资源消耗大,环境负担重,生态足迹增长较快,进而对经济增长效应产生抑制作用。对外开放的回归系数在东部和西部地区显著为负,但在中部地区显著为正,这可能与中部地区主要出口高耗能、高污染、低技术量、低附加值的初中级工业制品有关。能源消费结构的回归系数仅在中部地区显著为负。对此的解释是,中部地区的煤炭消费占比在三大区域中最高,但近年来中部地区能源消费结构持续优化,这使其作为生产活动的主体能源对经济增长效应表现为促进作用。外商直接投资的回归系数在中部和西部地区均为正值,特别是在西部地区通过了5%的显著性水平检验,表明“污染避难所”假说在西部地区成立。而东部地区环境规章制度相较严格,这在一定程度上规避非环境偏向型外资进入,有效提升了资源利用效率与污染治理能力。
3 结论及政策启示
3.1 主要结论
本文基于主客观综合福祉视角,运用L M D I S F A
(1) 2006—2018年中国生态福利绩效水平整体呈下降趋势,这是由于人均生态足迹指数的增速远高于人类发展指数和居民幸福感指数的增速。
(2) 中国生态福利绩效变化主要依赖经济增长效应驱动,但驱动作用呈式微态势,而环境福祉效应与社会福祉效应呈现出抑制作用。
(3) 从空间格局来看,南方地区的经济增长效应明显强于北方地区,这使得中国生态福利绩效的南北差异不断扩大。中西部地区的环境福祉效应和社会福祉效应明显弱于东部地区。
(4) 技术进步是经济增长效应最重要的决定因素。南北区域及东中西三大区域经济增长效应的决定因素存在明显的区域异质性。
3.2 政策启示
第一,增强福祉改善对中国生态福利绩效提升的驱动作用,扭转目前“低福祉增长”格局。各级政府要加大基础设施、医疗卫生等民生领域的公共服务投入,提供高品质、多样化的公共服务和公共产品,提升人民生活品质,增强人民幸福感,同时要引导居民树立绿色消费理念,推动经济增长、生态保护与民生福祉提升的协调发展。
第二,因地制宜制订中国生态福利绩效区域协调发展策略。社会各界要重点关注中国生态福利绩效的南北差异问题,尤其要着力提升北方地区的生态福利绩效,加快北方省市居民幸福感提升与自然资源消耗脱钩,由单纯依靠经济增长驱动向“经济增长+环境福祉改善”双轮驱动模式转变。
第三,加快绿色转型为中国生态福利绩效提升提供经济增长新动能。中国依旧要夯实技术进步对驱动中国生态福利绩效提升的经济增长效应的支撑作用;以技术进步助推产业结构升级和能源结构优化,促进中国经济高质量发展;建议基于经济增长效应决定因素的区域异质性特征,有针对性地激活和改善中国生态福利绩效提升的经济增长动力,进而缩小中国各地区之间的生态福利绩效差距。
参考文献
View Option
[1]
魏晓旭 , 赵军 , 魏伟 , 等 . 基于县域单元的中国生态经济系统协调度及空间演化
[J]. 地理科学进展 , 2014 , 33 (11 ): 1535 -1545 .
DOI:10.11820/dlkxjz.2014.09.010
[本文引用: 1]
[ Wei Xiaoxu Zhao Jun , et al . Coordinated development of ecological-economic system and spatial evolution based on county unit in China
Progress in Geography , 2014 , 33 (11 ): 1535 -1545 . ]
DOI:10.11820/dlkxjz.2014.09.010
[本文引用: 1]
<p>Based on the Gross Domestic Product (GDP) and 1 km×1 km land use data of 1980, 1990, 2000, and 2012, 2853 counties or districts of China, the rates of change in ecological service value (ESV) and GDP were calculated. Spatial analysis were performed in ArcGIS to examine coordinated development of ecological-economic system and its spatial variation and temporal change. The results are as follows. (1) Since 1980, county level GDP growth in China has been very rapid. The rate of GDP growth in China's southeast coastal area is higher than that in the central part, followed by counties in western China. (2) The total ecological service value of China increased from 85302.15 billion yuan in 1980 to 94876.82 billion yuan in 2012, with a 11.22% increase. Spatially, county level ESV is higher in northern and western counties, and lower in eastern counties. (3) The coordination between economic development and quality of the ecological -environment (EEH) has gradually improved. At the county level, EEH in northern China is better than that in western China followed by central and eastern counties. But the sustainable development challenges of the ecological-economic system is still high. The degree of spatial correlation of EEH is relatively stable. The development trend of coordination between socioeconomic development and ecological environment tend to be positive, but ecological-economic system coordination in different counties varies significantly. The results of this study suggest that the regional economy of China's western counties should be further developed when efforts are made to protect the ecological environment of the region, while in China's central and eastern counties, greater attention should be paid to the protection of the ecological environment and ecological restoration, when the economy continues to grow. Achieving sound and fast economic development and maintaining ecological integrity is a balancing act that requires much greater effort.</p>
[2]
王圣云 , 罗玉婷 , 韩亚杰 , 等 . 中国人类福祉地区差距演变及其影响因素: 基于人类发展指数(HDI)的分析
[J]. 地理科学进展 , 2018 , 37 (8 ): 1150 -1158 .
DOI:10.18306/dlkxjz.2018.08.014
[本文引用: 1]
应用空间基尼系数、泰尔系数分解及面板模型等方法,对1995-2013年中国人类福祉地区差距及其影响因素进行分析,结果显示:①1995-2013年中国人类福祉省际差距整体趋于缩小。其中,“九五”时期不断缩小,“十五”时期波动变化,“十一五”时期快速缩小,“十二五”时期趋同发展;②四大区域之间的人类福祉差距是最主要的差距,但其贡献率总体呈递减趋势,而区域内人类福祉省际差距的贡献率呈递增趋势。西部地区人类福祉的省际差距最大但降幅明显,东部地区人类福祉的省际差距先扩大后降低,中部、东北地区人类福祉省际差距相对较小且不断缩小;③中国人类福祉地区差距和城乡收入差距同向扩大。加快经济发展、增加教育经费投入均可提高中国各省的人类福祉水平,但也可能扩大地区差距。提高卫生经费占比的增长率可降低中国人类福祉水平,但却能有效缩小中国地区之间的福祉差距。提高人均社会保障支出和人均转移支付,既能提高中国各省区的人类福祉水平,又可起到促进地区之间福祉均衡作用。
[ Wang Shengyun Luo Yuting Han Yajie , et al . Regional difference and determinants of human well-being in China: Based on the analysis of human development index
Progress in Geography , 2018 , 37 (8 ): 1150 -1158 . ]
DOI:10.18306/dlkxjz.2018.08.014
[本文引用: 1]
The problem of regional unbalanced development emerges while human well-being is improving. Using the Gini coefficient, Theil index, and regression analysis method, this study analyzed the regional difference in change and determinants of human well-being in China from 1995 to 2013. It revealed that: (1) The inter-provincial difference of human well-being shows a converging trend and is getting smaller in China from 1995 to 2013. In the 9th Five Year Plan period it kept narrowing and in the 10th Five Year Plan period it showed some fluctuations. In the 11th Five Year Plan period it decreased rapidly and in the 12th Five Year Plan period it had a development trend of convergence; (2) From 1995 to 2013, the difference between the four regions is the main difference of human well-being in China, but its contribution rate shows a decreasing trend as a whole. The contribution rate of inter-provincial difference of human well-being is increasing in the four regions. The west region had the biggest inter-provincial difference of human well-being but has decreased significantly. The inter-provincial difference of human well-being enlarged at first and then narrowed in the east region. The central and the Northeast region showed smaller inter-provincial differences of human well-being and had a narrowing trend; (3) Increasing economic development and educational expenditure can improve the provincial human well-being but also will expand the difference of human well-being. The growth of the ratio of health care expenditure in finance will decrease the human well-being, but can narrow the difference of human well-being. Social security expenditure and transfers per capita are effective ways to improve provincial human well-being, but also narrow the difference of human well-being.
[3]
方时姣 , 肖权 . 中国区域生态福利绩效水平及其空间效应研究
[J]. 中国人口·资源与环境 , 2019 , 29 (3 ): 1 -10 .
[本文引用: 5]
[ Fang Shijiao Xiao Quan . Research on regional ecological well-being performance and spatial effect in China
China Population, Resources and Environment , 2019 , 29 (3 ): 1 -10 . ]
[本文引用: 5]
[4]
王圣云 , 韩亚杰 , 任慧敏 , 等 . 中国省域生态福利绩效评估及其驱动效应分解
[J]. 资源科学 , 2020 , 42 (5 ): 840 -855 .
DOI:10.18402/resci.2020.05.04
[本文引用: 3]
以最少的自然消耗实现人类福祉最大化,促进可持续的福祉提升,是生态福利绩效概念的核心内涵。本文通过构建生态福利绩效模型,将生态福利绩效模型分解为经济增长的福利效应和经济增长的生态效率两个驱动效应,应用DI指数和DEA-ML指数分别对影响中国31个省域经济增长的福利效应和经济增长的生态效率进行了测算及分析。研究表明:① 2006—2016年中国人类发展水平大幅提高,在空间上呈“京津沪率先提升,然后由东向西”拓展态势。② 2006—2016年中国人类发展水平的增速明显慢于人均生态足迹增速,使得中国生态福利绩效整体呈下降趋势。③中国人类福祉增长与经济增长相对脱钩,人类福祉增速慢于经济增速。中国31个省域分为中福祉增长和低福祉增长两类,其中内蒙古、黑龙江、广西、海南、贵州、甘肃、青海、宁夏、新疆、西藏、云南11个省域为中福祉增长类型,其他20个省域属于低福祉增长类型。④ 2006—2016年中国传统全要素生产率和绿色全要素生产率都有不同程度的提高,但绿色全要素生产率一直低于传统全要素生产率,表明经济增长付出的资源环境代价影响了中国经济增长质量。⑤中国生态福利绩效提升整体由福利效应和生态效率共同驱动,根据驱动效应分解和生态福利绩效的变化情况,本文将中国31个省域生态福利绩效分为经济主导提升型、福祉带动提升型、福祉滞后下降型、经济滞后下降型、总体下降型5种类型。本文深化了对生态福利绩效变化的驱动效应的认识,对中国不同类型省域采取差异化的生态福利绩效提升策略提供参考。
[ Wang Shengyun Han Yajie Ren Huimin , et al . Evaluation of provincial ecological well-being performance and its driving effect decomposition in China
Resources Science , 2020 , 42 (5 ): 840 -855 . ]
DOI:10.18402/resci.2020.05.04
[本文引用: 3]
It is the core connotation of the concept of ecological well-being performance to maximize human well-being with minimum natural consumption and promote sustainable well-being. This study constructed a model of ecological well-being performance and decomposed ecological well-being performance into two driving effects, namely, the well-being effect of economic growth and the ecological efficiency of economic growth. The well-being effect of economic growth and the ecological efficiency of economic growth, which affect the change of ecological well-being performance in 31 provinces of China’s mainland, were calculated and analyzed by using the decoupling index (DI) and the DEA-ML index models respectively. The results show that: (1) From 2006 to 2016, the level of human development in China had been greatly improved, showing the characteristics of leading by Beijing, Tianjin, and Shanghai Municipalities and expanding from east to west. (2) From 2006 to 2016, the growth rate of human development level in China was significantly slower than that of per capita ecological footprint. China’s ecological well-being performance showed a downward trend as a whole. (3) China’s human well-being growth was relatively decoupled from economic growth. Human well-being growth slower than economic growth. China’s 31 provinces are divided into two categories: medium well-being growth and low well-being growth, 11 of which are Inner Mongolia, Heilongjiang, Guangxi, Hainan, Guizhou, Gansu, Qinghai, Ningxia, Xinjiang, Tibet and Yunnan belong to the medium well-being growth, while the other 20 belong to the low well-being growth. (4) From 2006 to 2016, China’s traditional total factor productivity and green total factor productivity improved to varying degrees, but green total factor productivity had always been lower than traditional total factor productivity. It shows that the cost of resources and environment paid by economic growth affects the quality of China’s economic growth. (5) On the whole, the performance improvement of ecological well-being in China was driven by the well-being effect of economic growth and the ecological efficiency of economic growth, based on the decomposition of driving effect and the change of ecological well-being performance of 31 provinces in China can be divided into five types: economic-led improvement type, well-being driven improvement type, well-being lagged decline type, economic lagged decline type, and overall decline type. This paper deepens the understanding of the driving effect of the change of ecological well-being performance, and provides reference for different provinces in China to adopt different strategies to improve ecological well-being performance.
[5]
龙亮军 , 王霞 . 上海市生态福利绩效评价研究
[J]. 中国人口·资源与环境 , 2017 , 27 (2 ): 84 -92 .
[本文引用: 1]
[ Long Liangjun Wang Xia . A study on Shanghai's ecological well-being performance
China Population, Resources and Environment , 2017 , 27 (2 ): 84 -92 . ]
[本文引用: 1]
[6]
Daly H E . The world dynamics of economic growth: The economics of the steady state
[J]. America Economic Review , 1974 , 64 (2 ): 15 -21 .
[本文引用: 1]
[7]
王圣云 . 中部地区人文发展的生态效率评价
[J]. 经济地理 , 2011 , 31 (5 ): 827 -832 .
[本文引用: 1]
[ Wang Shengyun . Evaluation on eco-efficiency from human development in the central China
Economic Geography , 2011 , 31 (5 ): 827 -832 . ]
[本文引用: 1]
[8]
诸大建 . 从“里约+20”看绿色经济新理念和新趋势
[J]. 中国人口·资源与环境 , 2012 , 22 (9 ): 1 -7 .
[本文引用: 1]
[ Zhu Dajian . New concept and trend of green economy emerging from Rio + 20
China Population, Resources and Environment , 2012 , 22 (9 ): 1 -7 . ]
[本文引用: 1]
[9]
Bian J Ren H Liu P . Evaluation of urban ecological well-being performance in China: A case study of 30 provincial capital cities
[J]. Journal of Cleaner Production , 2020 , 254 : 120109 . doi:10.1016/j.jclepro.2020.120109 .
URL
[本文引用: 1]
[10]
Zhang S Zhu D J Shi Q H , et al . Which countries are more ecologically efficient in improving human well-being? An application of the index of ecological well-being performance
[J]. Resources Conservation and Recycling , 2018 , 129 : 112 -119 .
DOI:10.1016/j.resconrec.2017.10.015
URL
[本文引用: 1]
[11]
诸大建 , 张帅 . 生态福利绩效与深化可持续发展的研究
[J]. 同济大学学报(社会科学版) , 2014 , 25 (5 ): 106 -115 .
[本文引用: 2]
[ Zhu Dajian Zhang Shuai . Ecological wellbeing performance and further research on sustainable development
Journal of Tongji University (Social Science Section) , 2014 , 25 (5 ): 106 -115 . ]
[本文引用: 2]
[12]
臧漫丹 , 诸大建 , 刘国平 . 生态福利绩效: 概念、内涵及G20实证
[J]. 中国人口·资源与环境 , 2013 , 23 (5 ): 118 -124 .
[本文引用: 1]
[ Zang Mandan Zhu Dajian Liu Guoping . Ecological well-being performance: Concept, connotation and empirical of G20
China Population, Resources and Environment , 2013 , 23 (5 ): 118 -124 . ]
[本文引用: 1]
[14]
龙亮军 . 基于两阶段Super-NSBM模型的城市生态福利绩效评价研究
[J]. 中国人口·资源与环境 , 2019 , 29 (7 ): 1 -10 .
[本文引用: 1]
[ Long Liangjun . Evaluation of urban ecological well-being performance of Chinese major cities based on two-stage super-efficiency network SBM model
China Population, Resources and Environment , 2019 , 29 (7 ): 1 -10 . ]
[本文引用: 1]
[15]
邓远建 , 杨旭 , 马强文 , 等 . 中国生态福利绩效水平的地区差距及收敛性
[J]. 中国人口·资源与环境 , 2021 , 31 (4 ): 132 -143 .
[本文引用: 2]
[ Deng Yuanjian Yang Xu Ma Qiangwen , et al . Regional disparity and convergence of China's ecological welfare performance level
China Population, Resources and Environment , 2021 , 31 (4 ): 132 -143 . ]
[本文引用: 2]
[16]
冯吉芳 , 袁健红 . 中国区域生态福利绩效及其影响因素
[J]. 中国科技论坛 , 2016 , 32 (3 ): 100 -105 .
[本文引用: 1]
[ Feng Jifang Yuan Jianhong . On Chinese regional ecological well-being performance and its influence factors
Forum on Science and Technology in China , 2016 , 32 (3 ): 100 -105 . ]
[本文引用: 1]
[17]
刘国平 , 朱远 . 碳排放约束下的中国省域全要素福利绩效研究
[J]. 软科学 , 2014 , 28 (8 ): 88 -93 .
[本文引用: 1]
[ Liu Guoping Zhu Yuan . Total factor wellbeing performance of Chinese provincial region within the limitation of carbon emission
Soft Science , 2014 , 28 (8 ): 88 -93 . ]
[本文引用: 1]
[18]
钟水映 , 冯英杰 . 中国省际间绿色发展福利测量与评价
[J]. 中国人口·资源与环境 , 2017 , 27 (9 ): 196 -204 .
[本文引用: 1]
[ Zhong Shuiying Feng Yingjie . Green development welfare measurement and evaluation among China's provinces
China Population, Resources and Environment , 2017 , 27 (9 ): 196 -204 . ]
[本文引用: 1]
[19]
Abdallah S Thompson S Michaelson J , et al . The happy planet index 2.0: Why good lives don't have to cost the earth
[M]. London , UK : The New Economics Foundation , 2009 .
[本文引用: 1]
[20]
徐维祥 , 徐志雄 , 刘程军 . 基于随机前沿分析的环境规制效率异质性研究
[J]. 地理科学 , 2021 , 41 (11 ): 1959 -1968 .
DOI:10.13249/j.cnki.sgs.2021.11.009
[本文引用: 1]
采用随机前沿分析(SFA)模型考察了2003—2017年中国省际环境规制效率及其技术无效率项的影响因素,并借助核密度估计、热点分析及收敛模型对全国和三大地区环境规制效率的时空差异性与区域收敛性进行了探讨。结果表明:①全国整体以及中、西部地区劳动要素产出弹性系数明显大于资本要素,东部地区反之;②科技创新、产业结构、对外开放与环境规制效率呈显著的正相关,人力资本、能源消费及人口密度则对其产生抑制作用;③各区域效率值稳步提升中伴随着离散程度加大、极化迹象明显的趋势,空间上呈现出稳定的“东热西冷”分布格局;④全国与西部地区环境规制效率存在σ收敛,而东中部地区内部差异有扩大的态势,但所有区域相对β收敛与绝对β收敛现象显著。
[ Xu Weixiang Xu Zhixiong Liu Chengjun . Heterogeneity analysis of environmental regulation efficiency based on SFA
Scientia Geographica Sinica , 2021 , 41 (11 ): 1959 -1968 . ]
DOI:10.13249/j.cnki.sgs.2021.11.009
[本文引用: 1]
With the green GDP as the output variable, the total number of environmental protection system personnel and the environmental pollution control investment capital stock as the input factors, this article constructs a stochastic frontier analysis model to examine the environmental regulation efficiency and its influencing factors nationwide from 2003 to 2017; nuclear density estimation method and convergence model are also used to explore the spatial differences and regional convergence of environmental regulation efficiency. The results show that: 1) The elasticity coefficient of labor factor in the national, central, western regions is significantly larger than that in the capital, while the eastern region is the opposite, which is closely related to the professional demographic dividend and the type of pollutant discharge; 2) Technological innovation, industrial structure and opening up contribute to the improvement of environmental regulation efficiency, human capital, energy consumption, population density have an inhibitory effect on it; 3) The steady increase of efficiency values in each region is accompanied by a trend of increasing dispersion and obvious signs of polarization, meanwhile, the spatial distribution of its hotpots and coldpots is always on the pattern of “hot in the east and cold in the west”; 4) There exits σ convergence in the mainland of China and western regions, while the internal difference of environmental regulation efficiency in both central and eastern regions will widen to some extent. All of the regions show the significant absolute βconvergence and conditional β convergence, meaning that the differences can gradually convergence to their own steady state.
[22]
Battese G E Coelli T J . A model for technical inefficiency effects in a stochastic frontier production function for panel data
[J]. Empirical Economics , 1995 , 20 (2 ): 325 -332 .
DOI:10.1007/BF01205442
URL
[本文引用: 1]
[23]
党云晓 , 张文忠 , 余建辉 , 等 . 北京居民主观幸福感评价及影响因素研究
[J]. 地理科学进展 , 2014 , 33 (10 ): 1312 -1321 .
DOI:10.11820/dlkxjz.2014.10.003
[本文引用: 1]
随着生活水平的提高,越来越多的居民开始重视自身生活的幸福程度。学术界对个体主观幸福感的关注虽然由来已久,但是鲜见从地理学角度出发的研究,尤其是评价影响主观幸福感的因素。本文以北京为例,基于大规模问卷调查,构建了个体主观幸福感影响因素框架,分析了不同社会属性人群的主观幸福感差异,并利用多元线性回归模型测度了制度与政策等因素对个体主观幸福感的影响。结果发现:不同社会经济属性个体的主观幸福感差异明显;制度因素对个体幸福感有显著影响,拥有本地户口居民的主观幸福感显著高于外地户口居民;工作时间和通勤时间的增加都能降低个体的主观幸福感;迁居能提高个体的生活满意度,然而频繁迁居和更换工作却会降低个体的生活满意度。
[ Dang Yunxiao Zhang Wenzhong Yu Jianhui , et al . Residents' subjective well-being and influencing factors in Beijing
Progress in Geography , 2014 , 33 (10 ): 1312 -1321 . ]
DOI:10.11820/dlkxjz.2014.10.003
[本文引用: 1]
Residents in urban China are paying increasingly more attention to the quality of life and personal well-being with the improvement of living standards. Improving residents' quality of life is also an important target of urban development. Scholars have conducted research on subjective well-being from the perspective of psychology, sociology, and economics for a long time. However, only few geographic studies in China have addressed this topic. Among these studies, some were concerned with the evaluation method of happy city or happy region by building an evaluation index system, others focused on small scale case studies that examine the influencing factors of individuals' subjective well-being. These studies show that individual social attributes have significant impact on subjective well-being; subjective well-being is also influenced by socioeconomic factors such as crime rate and employment of a city or region. On the other hand, by reviewing the literature we found that geographers in western countries have conducted much research on the measurement, index system, and influencing factors of subjective well-being. Given the Chinese socioeconomic, policy, and institutional context of the past decades, it is important to examine the unique factors that affect subjective well-being of citizens in China, which has not been adequately covered by existing research. Based on the data from a large survey of 5732 participants conducted in 2013 in Beijing, this article develops an indicator system of individual subjective well-being; it also analyzes the subjective well-being of individuals with different social attributes and estimates the impact of relevant factors on subjective well-being with a multivariate linear regression model. Several conclusions are drawn as follows: (1) Individuals with diverse social attributes are significantly different in subjective well-being. The young and the old are happier than the middle-aged group of respondents. Family income has positive impact on subject well-being. However, people with highest family income are not the happiest. Individuals who are highly educated or have a big family are happier. Household heads, pensioners, high-rank managers of companies, and employees of state-owned enterprises are more satisfied with their lives. (2) The majority of the survey participants gave higher scores on life satisfaction but lower scores on happiness. (3) Policy and institutional factors have significant impact on individual's subjective well-being. Respondents with Beijing hukou feel happier and those living in commercial housing are happier than those living in residence provided by workplace or in affordable housing. (4) Increase of working or commuting time leads to lower happiness. (5) Respondents who changed residence once or twice in the last five years feels happier, but this is not the case with those who changed housing more than three times. Similarly, changing job makes people unhappy. (6) Individuals feel happier if they feel good about the living environment, national policy, personal health, and relative income.
[24]
Wackernagel M Onisto L Bello P , et al . Ecological footprints of nations:How much nature do they use? How much nature do they have?
[R]. Toronto , Canada : International Council for Local Environmental Initiatives , 1997 .
[本文引用: 1]
[25]
史丹 , 王俊杰 . 基于生态足迹的中国生态压力与生态效率测度与评价
[J]. 中国工业经济 , 2016 , 34 (5 ): 5 -21 .
[本文引用: 2]
[ Shi Dan Wang Junjie . Measurement and evaluation of China's ecological pressure and ecological efficiency based on ecological footprint
China Industrial Economics , 2016 , 34 (5 ): 5 -21 . ]
[本文引用: 2]
[26]
张军 , 吴桂英 , 张吉鹏 . 中国省际物质资本存量估算: 1952—2000
[J]. 经济研究 , 2004 , 39 (10 ): 35 -44 .
[本文引用: 1]
[ Zhang Jun Wu Guiying Zhang Jipeng . The estimation of China's provincial capital stock: 1952-2000
Economic Research Journal , 2004 , 39 (10 ): 35 -44 . ]
[本文引用: 1]
[27]
赵林 , 刘焱序 , 曹乃刚 , 等 . 中国包容性绿色效率时空格局与溢出效应分析
[J]. 地理科学进展 , 2021 , 40 (3 ): 382 -396 .
DOI:10.18306/dlkxjz.2021.03.003
[本文引用: 1]
包容性绿色发展旨在保障经济持续增长的同时促进社会公平和资源环境改善,是建设生态文明、保障和改善民生的必然选择。论文基于包容性绿色效率评价体系,采用考虑非期望产出的Super-EBM模型综合测度了中国省域包容性绿色效率,刻画了时空格局特征,最后采用空间杜宾模型识别了空间溢出效应与影响因素。研究表明:① 2000—2017年包容性绿色综合效率与规模效率呈缓慢波动上升趋势,纯技术效率呈先下降后上升的“V”型演变,综合效率的提升由规模效应驱动向技术驱动转变。② 包容性绿色效率空间格局由低水平均衡向高水平不均衡演进,高值区集中于“胡焕庸线”向东一侧,低值区以西北、西南和东北地区为主,综合效率与纯技术效率形成京津、长三角和珠三角3个高水平集聚区,规模效率的高水平区呈“H”型分布特征。③ 包容性绿色效率的同类型地区存在空间集聚特征,且空间集聚性不断增强,热点区呈向东北移动的趋势且逐渐稳定于长三角地区,次热点以京津、珠三角地区为主,西北、西南和东北基本为冷点区。④ 包容性绿色综合效率及其分解效率存在正向空间溢出效应,经济发展水平、产业结构、工业化、政府行政能力、财政分权、环境规制、科技创新及市场化对包容性绿色效率具有显著影响,其中政府行政能力、财政分权、环境规制、科技创新和市场化具有一定溢出效应。
[ Zhao Lin Liu Yanxu Cao Naigang , et al . Spatiotemporal pattern and spillover effects of inclusive green efficiency in China
Progress in Geography , 2021 , 40 (3 ): 382 -396 . ]
DOI:10.18306/dlkxjz.2021.03.003
[本文引用: 1]
Inclusive green development aims to ensure sustainable economic growth while promoting social equity and resource and environmental improvement. It is an inevitable choice for building ecological civilization and improving people's livelihood. This study constructed an evaluation system of inclusive green efficiency, and used the Super-Epsilon-Based Measure (EBM) model considering the undesirable outputs to comprehensively measure China's inclusive green efficiency. On this basis, spatial autocorrelation analysis was used to analyze the spatiotemporal characteristics of inclusive green efficiency. By using a spatial Durbin model, the spatial spillover effects and influencing factors were analyzed. The results show that: 1) From 2000 to 2017, China's comprehensive inclusive green efficiency and scale efficiency fluctuated slowly, and the pure technical efficiency showed a "V-shaped" trend. The improvement of comprehensive efficiency gradually changed from scale effect to technology driven. 2) The spatial pattern of inclusive green efficiency in China has evolved from low-level equilibrium to high-level imbalance. The high-value areas are concentrated to the east of the Hu Huanyong Line, while the low-value areas are mainly in the northwestern, southwestern, and northeastern areas. Comprehensive efficiency and pure technical efficiency form three high-value areas in Beijing-Tianjin, the Yangtze River Delta, and the Pearl River Delta at the national level, and the high-value areas of scale efficiency show a "H" shape. 3) The same type of inclusive green efficiency shows the characteristics of spatial agglomeration, which is also continuously enhanced. The hotspots tend to move to the northeast. The hotspots are gradually stabilized in the Yangtze River Delta region, and the secondary hotspots are mainly in the Beijing-Tianjin and Pearl River Delta regions. The northwest, southwest, and northeast are basically cold spots. 4) The regression results of spatial Durbin model show that there is a positive spatial spillover effect of comprehensive inclusive green efficiency and its components. Economic development level, industrial structure, industrialization, government administrative ability, fiscal decentralization, environmental regulation, scientific and technological innovation, and marketization have significant influences on inclusive green efficiency, among which government administrative ability, fiscal decentralization, environmental regulation, scientific and technological innovation, and marketization have some spillover effects. Finally, some related policies, such as strengthening inter-regional exchanges and cooperation, accelerating the optimization and upgrading of industrial structure, optimizing the government's fiscal expenditure structure, promoting the transformation and application of scientific and technological achievements, and letting the market play a decisive role in the allocation of resources, were put forward based on the empirical analysis. This study provides a new perspective than the traditional assessment of economic efficiency, and the conclusions can provide some reference for China's ecological civilization construction and green transformation development.
[28]
卢现祥 , 王素素 . 中国要素市场化配置水平的南北差异及形成机理
[J]. 数量经济技术经济研究 , 2021 , 38 (11 ): 21 -42 .
[本文引用: 1]
[ Lu Xianxiang Wang Susu . The north-south differences and formation mechanisms of China's factor market allocation level
The Journal of Quantitative & Technical Economics , 2021 , 38 (11 ): 21 -42 . ]
[本文引用: 1]
[29]
张思麒 , 刘导波 . 技术进步视角下中国产业结构高级化格局及影响因素
[J]. 经济地理 , 2022 , 42 (5 ): 104 -113 .
[本文引用: 1]
[ Zhang Siqi Liu Daobo . Spatial pattern and influencing factors of industrial structure advancement in China based on technological progress
Economic Geography , 2022 , 42 (5 ): 104 -113 . ]
[本文引用: 1]
[30]
World Bank . International comparison program [EB/OL]. 2020 -05-19 [2021-08-17]. https://www.worldbank.org/en/programs/icp.
URL
[本文引用: 1]
[31]
李科 , 袁玮鸿 , 罗晶 , 等 . 中国工业绿色增长效率的测算及其变化特征
[J]. 经济地理 , 2022 , 42 (4 ): 44 -53 .
[本文引用: 1]
[ Li Ke Yuan Weihong Luo Jing , et al . Measurement and spatiotemporal characteristics of the industrial green growth efficiency in China
Economic Geography , 2022 , 42 (4 ): 44 -53 . ]
[本文引用: 1]
[32]
陈成忠 , 林振山 . 中国生态足迹和生物承载力构成比例变化分析
[J]. 地理学报 , 2009 , 64 (12 ): 1523 -1533 .
DOI:10.11821/xb200912012
[本文引用: 1]
基于生态足迹模型,计算了中国1995-2006年人均生态足迹和生物承载力的各构成组分。运用统计—动力学建模方法,构建生态足迹和生物承载力各组分构成比例变化的普适预测模型。结果表明:① 1995-2006年,中国人均生态足迹构成以能源足迹和耕地足迹为主,耕地、林地、建设等足迹比例在波动中不断下降,草地、水域足迹比例先上升后下降,能源足迹比例不断增加;人均生物承载力构成以耕地为主,林地、建设、水域承载力比例相差不多,草地承载力比例最小,其中耕地、草地承载力比例不断增加,林地、水域、建设等承载力比例不断下降,且变化幅度均很小。② 2007-2015年,耕地、林地足迹比例继续下降,草地、水域、能源足迹比例将逐渐上升,建设足迹比例将在下降一段时间后出现增加趋势。耕地、林地、草地等承载力比例将不断增加,其中耕地、林地承载力比例增加幅度很小,草地承载力比例相对增幅较大;水域、建设承载力比例均呈下降趋势。文章还探讨了可能导致中国人均生态足迹和生物承载力构成比例出现上述变化的原因,给出相应的政策建议,并分析了二者之间的内在变化规律。研究结果对指导我国调整产业结构、土地利用规划和改善生态环境有较重要的启示和借鉴意义。
[ Chen Chengzhong Lin Zhenshan . Dynamic study of component percentages of per capita ecological footprint and biocapacity in China, 1995-2015
Acta Geographica Sinica , 2009 , 64 (12 ): 1523 -1533 . ]
[本文引用: 1]
[33]
何晓斌 , 董寅茜 . 从经济到社会——中国城镇居民主观幸福感影响因素的变迁: 2003—2017
[J]. 南京社会科学 , 2021 , 32 (3 ): 54 -63 .
[本文引用: 1]
[ He Xiaobin Dong Yinxi . From economic to social factors: The changing influence on Chinese urban residents' subjective well-being: 2003-2017
Nanjing Journal of Social Sciences , 2021 , 32 (3 ): 54 -63 . ]
[本文引用: 1]
[34]
刘煜 , 刘跃军 . 中国生态福利绩效测度与空间关联网络特征分析
[J]. 统计与决策 , 2021 , 37 (24 ): 52 -57 .
[本文引用: 1]
[ Liu Yu Liu Yuejun . Measurement on China's ecological welfare performance and analysis on spatial correlation network characteristics
Statistics & Decision , 2021 , 37 (24 ): 52 -57 . ]
[本文引用: 1]
[35]
刘宇峰 , 原志华 , 郭玲霞 , 等 . 陕西省城市绿色增长水平时空演变特征及影响因素解析
[J]. 自然资源学报 , 2022 , 37 (1 ): 200 -220 .
DOI:10.31497/zrzyxb.20220114
[本文引用: 1]
绿色增长是实现人地协调的一种可持续发展模式,对区域绿色发展和生态文明建设的推进具有重要作用。研究以陕西省为例,在系统梳理绿色增长内涵及特征的基础上,构建了绿色增长系统作用机制框架及评价指标体系,运用TOPSIS-灰色关联分析、泰尔指数等方法分析了2008—2017年城市绿色增长水平的时空演变特征及影响因素。结果表明:(1)陕西省城市绿色增长水平总体呈现“上升—下降—上升”的“N”型波动上升变化过程。(2)空间分布上,城市绿色增长水平存在明显的区域差异,且有进一步扩大的趋势;空间演化上,地区内差异略呈下降趋势,而地区间差异上升趋势明显。(3)区域生态环境(X<sub>3</sub>)、生活质量环境(X<sub>4</sub>)和政策支持环境(X<sub>5</sub>)是制约陕西省绿色增长水平的主要障碍因素,且不同准则层在城市间的障碍作用存在明显的空间分异。(4)全省层面上,对城市绿色增长水平阻碍作用最大的5个因子依次是废气治理设施处理能力X<sub>43</sub>、单位GDP能耗下降率X<sub>31</sub>、科研和技术服务从业人员数X<sub>54</sub>、建成区绿化覆盖率X<sub>49</sub>和一般工业固体废物综合利用率X<sub>42</sub>;在城市层面上,X<sub>54</sub>的阻碍作用最强,其次是X<sub>43</sub>、X<sub>31</sub>、每万人拥有公交车和出租车辆数X<sub>48</sub>以及人均GDP X<sub>21</sub>。(5)外部环境驱动方面,产业结构、科技创新能力两个要素对陕西绿色增长的贡献度最大,其次是贸易水平、市场化水平、城镇化水平和人口密度。据此,从构建多元化能源结构体系、完善绿色增长相关政策制度、优化外部环境条件等五方面提出对策建议。
[ Liu Yufeng Yuan Zhihua Guo Lingxia , et al . Spatio-temporal characteristics of urban green growth level and its influencing factors in Shaanxi Province
Journal of Natural Resources , 2022 , 37 (1 ): 200 -220 . ]
DOI:10.31497/zrzyxb.20220114
[本文引用: 1]
Green growth is a sustainable development mode to realize the coordination between human and land, which plays an important role in promoting regional green development and ecological civilization construction. Taking Shaanxi province as an example, based on the systematic analysis of the connotation and characteristics of green growth, this paper constructs the mechanism framework and evaluation index system of green growth system, and analyzes the spatiotemporal evolution characteristics and influencing factors of urban green growth level from 2008 to 2017 by using TOPSIS grey correlation analysis and Theil index. The results show that: (1) The level of urban green growth in Shaanxi province presents a "rise - drop - rise" fluctuation process. (2) In terms of spatial distribution, there are obvious regional differences in the level of urban green growth, and there is a trend of further expansion; in terms of spatial evolution, the intra-regional differences show a slight downward trend, while the inter-regional differences have an obvious upward trend. (3) Regional ecological environment (X3), quality of life environment (X4) and policy support environment (X5) are the main obstacles to the green growth level of Shaanxi, and there are obvious spatial differences in the barrier effect of different standard layers among cities. (4) On the provincial level, the five factors that hinder the level of urban green growth are the treatment capacity of waste gas treatment facilities (X43), the decline rate of energy consumption per unit GDP (X31), the number of employees engaged in scientific research and technical services (X54), the green coverage rate of built-up areas (X49), and the comprehensive utilization rate of general industrial solid waste (X42); on the urban level, X54 has the strongest blocking effect, followed by X43, X31, the number of buses and taxis per 10000 people (X48) and the per capita GDP (X21). (5) In the aspect of external environment driving, industrial structure, scientific and technological innovation ability contribute the most to Shaanxi's green growth, followed by trade level, marketization level, urbanization level and population density. Finally, the paper puts forward countermeasures and suggestions from five aspects, such as building a diversified energy structure system, improving green growth related policies and systems, and optimizing external environmental conditions.
[36]
刘耀彬 , 袁华锡 , 王喆 . 文化产业集聚对绿色经济效率的影响: 基于动态面板模型的实证分析
[J]. 资源科学 , 2017 , 39 (4 ): 747 -755 .
[本文引用: 1]
[ Liu Yaobin Yuan Huaxi Wang Zhe . Dynamic panel data modeling of the effects of cultural industry clusters on green economic efficiency
Resources Science , 2017 , 39 (4 ): 747 -755 . ]
[本文引用: 1]
[37]
邵帅 , 范美婷 , 杨莉莉 . 经济结构调整、绿色技术进步与中国低碳转型发展: 基于总体技术前沿和空间溢出效应视角的经验考察
[J]. 管理世界 , 2022 , 38 (2 ): 46 -69 , 4-10.
[本文引用: 1]
[ Shao Shuai Fan Meiting Yang Lili . Economic restructuring, green technical progress, and low-carbon transition development in China: An empirical investigation based on the overall technology frontier and spatial spillover effect
Journal of Management World , 2022 , 38 (2 ): 46 -69 , 4-10. ]
[本文引用: 1]
基于县域单元的中国生态经济系统协调度及空间演化
1
2014
... 改革开放40多年来,中国经济发展取得举世瞩目的成就,但同时也面临低福祉增长以及突出的资源消耗和环境污染问题[1 ] ,这不仅影响中国经济发展质量,而且制约着中国区域协调发展新格局构建.一方面,随着发展观由以经济增长为核心逐步转向“以人民为中心”,发展目标也从经济主导逐步转向人民福祉提升[2 ] ;另一方面,中国各地区在可持续发展进程中,由于经济增长和福祉改善的驱动作用,造成其生态福利绩效存在明显的区域差异[3 ] .因此,准确测度中国生态福利绩效水平,揭示中国生态福利绩效变化的时空格局演变特征及其驱动效应,对推进中国生态文明建设、促进新时期区域可持续协调发展具有重要意义. ...
中国人类福祉地区差距演变及其影响因素: 基于人类发展指数(HDI)的分析
1
2018
... 改革开放40多年来,中国经济发展取得举世瞩目的成就,但同时也面临低福祉增长以及突出的资源消耗和环境污染问题[1 ] ,这不仅影响中国经济发展质量,而且制约着中国区域协调发展新格局构建.一方面,随着发展观由以经济增长为核心逐步转向“以人民为中心”,发展目标也从经济主导逐步转向人民福祉提升[2 ] ;另一方面,中国各地区在可持续发展进程中,由于经济增长和福祉改善的驱动作用,造成其生态福利绩效存在明显的区域差异[3 ] .因此,准确测度中国生态福利绩效水平,揭示中国生态福利绩效变化的时空格局演变特征及其驱动效应,对推进中国生态文明建设、促进新时期区域可持续协调发展具有重要意义. ...
中国区域生态福利绩效水平及其空间效应研究
5
2019
... 改革开放40多年来,中国经济发展取得举世瞩目的成就,但同时也面临低福祉增长以及突出的资源消耗和环境污染问题[1 ] ,这不仅影响中国经济发展质量,而且制约着中国区域协调发展新格局构建.一方面,随着发展观由以经济增长为核心逐步转向“以人民为中心”,发展目标也从经济主导逐步转向人民福祉提升[2 ] ;另一方面,中国各地区在可持续发展进程中,由于经济增长和福祉改善的驱动作用,造成其生态福利绩效存在明显的区域差异[3 ] .因此,准确测度中国生态福利绩效水平,揭示中国生态福利绩效变化的时空格局演变特征及其驱动效应,对推进中国生态文明建设、促进新时期区域可持续协调发展具有重要意义. ...
... 在生态福利绩效的测度方法上,现有研究主要运用效率模型法或比值法[9 -10 ] .诸大建等[11 ] 最早将生态福利绩效定量表示为人类发展指数与生态足迹的比值;臧漫丹等[12 ] 用出生时预期寿命与人均生态足迹的比值测度了1996—2007年 G 20 C o m m o n [13 ] 应用生活满意度与预期寿命的乘积构建了快乐生活寿命指数,并应用快乐生活寿命指数与生态足迹指数的比值测度了143个国家的可持续发展水平;龙亮军[14 ] 将主观满意度纳入评价指标体系,基于两阶段Super-NSBM(Super-efficiency Network SBM)模型测度了中国35个主要城市的生态福利绩效,研究表明主观和客观的综合评价能更真实地反映居民福利水平.随着测度方法与指标选取日渐丰富,生态福利绩效的时空格局演变特征与驱动效应逐渐成为学者研究关注的重点.邓远建等[15 ] 发现2004—2017年中国生态福利绩效整体水平明显降低,在空间上呈现出东部最高、中部次之、西部最低的空间梯度递减格局;方时姣等[3 ] 研究表明,2005—2016年中国生态福利绩效呈上升下降交替演变趋势,表现出从东部到中部再到西部依次递减的空间格局;冯吉芳等[16 ] 运用对数平均迪氏指数法(logarithmic mean divisia index,LMDI)探究中国生态福利绩效的驱动效应,发现服务效应对生态福利绩效表现为抑制作用,而技术效应表现为促进作用;刘国平等[17 ] 采用 L M D I [4 ] 将生态福利绩效分解为经济增长的生态效率与经济增长的福利效应,应用 D E A - M L ( data envelopment analysis-Malmquist Lenberger)指数模型进一步分解经济增长的生态效率,研究表明技术进步是中国经济增长最重要的驱动因素,其次是规模效率变化;钟水映等[18 ] 将绿色发展福利分解为福利脱钩指数与绿色经济效率,运用 D E A M a l m q u i s t
... 由文献评述可知,现有研究围绕生态福利绩效积累了较为丰硕的成果,但仍有如下拓展空间:① 随着“以人民为中心”的发展思想日益深入,幸福感已成为测度福祉水平不可或缺的主观维度,采用主客观综合指标衡量福祉是生态福利绩效测度的研究趋势[13 ,19 ] ,但目前基于主客观综合福祉视角的生态福利绩效定量研究成果尚不多见;② 已有生态福利绩效的时空格局演变研究多关注中国东中西三大区域以及省级区域的差异[3 ,15 ] ,但对中国南北区域之间的生态福利绩效差异鲜有揭示;③ 现有生态福利绩效的驱动效应研究不仅忽视了人地关系和谐背景下主观幸福感因素带来的环境福祉效应及其变化,而且对中国生态福利绩效区域差异的原因,即驱动效应的区域异质性也缺乏探讨,同时,对经济增长效应的决定因素研究尚不充分,在变量选取和研究方法方面还有待改进[20 ] . ...
... 经济增长效应的决定因素分解模型中,经济总产出以2005年为不变价的 G D P [26 ] 的方法计算;劳动投入以就业人数表示.同时,结合现有文献[3 ,27 ] ,技术非效率项的影响变量选取如下:① 城镇化水平( C i t y ) ,用年末城镇人口占总人口比重衡量;② 能源消费结构( E n c s ) ,以煤炭消费量占总能源消费比重表征;③ 技术进步( T e c ) ,用研发支出占 G D P I n d u s ) ,以第二产业增加值占 G D P O p e n ) ,用货物进出口总额占 G D P F d i ) ,用外商直接投资额占 G D P
... (1) 全国结果分析.由表1 中全国样本可以看出,技术进步是经济增长效应最重要的决定因素.近年来中国持续加大研发投入力度,代表研发成果的发明专利授权量大幅增长,特别是绿色专利授权量在2006—2010年内年均增长36.34%,大大提高了生产效率,使技术进步对经济增长效应发挥着十分显著的促进作用.对外开放和外商直接投资也是经济增长效应重要的决定因素,这主要与对外开放和外商直接投资能够带来先进管理经验和技术溢出效应,提高资源利用效率的同时刺激国内企业技术升级有关[3 ,35 ] .城镇化水平的回归系数显著为正,对经济增长效应表现为抑制作用.中国城镇化水平从2006年的43.90%提高至2018年的59.58%,由此产生的要素集聚效应虽提高了生产效率,但伴随农村人口向城市转移,也不可避免地产生了一系列资源消耗与环境污染问题[36 ] ,造成生态足迹升高.产业结构和能源消费结构的回归系数也显著为正.中国第二产业具有高能耗、高污染、高排放等特征[37 ] ,而2006—2018年中国煤炭消费占能源消费总量的比重均值高达67.23%,与风能、水能等清洁能源相比,煤炭能源利用效率较低,不仅不利于“双碳”目标实现,还导致生态足迹居高不下. ...
中国省域生态福利绩效评估及其驱动效应分解
3
2020
... 生态福利绩效与生态效率的主要区别在于,前者是提升人类福祉的生态效率[4 ] ,后者一般指的是经济产出对应的生态效率[5 ] .从最早提出生态效率概念的 D a l y [6 ] 的观点来看,生态效率本质上衡量的是单位自然消耗带来的福祉产出.可见,基于福祉产出的角度,生态效率就是生态福利绩效,只不过在经济主导发展观下, G D P [7 -8 ] .此外,本文认为生态福利绩效也可理解为生态福利产出的效率,即生态福利在效率上的延伸.需要指出的是,这种研究下的生态福利是指人类从生态系统中直接获取或享有的终端产品和服务,其关注的焦点是提升生态福利的效率,这与本文生态福利绩效的内涵有着明显的不同. ...
... 在生态福利绩效的测度方法上,现有研究主要运用效率模型法或比值法[9 -10 ] .诸大建等[11 ] 最早将生态福利绩效定量表示为人类发展指数与生态足迹的比值;臧漫丹等[12 ] 用出生时预期寿命与人均生态足迹的比值测度了1996—2007年 G 20 C o m m o n [13 ] 应用生活满意度与预期寿命的乘积构建了快乐生活寿命指数,并应用快乐生活寿命指数与生态足迹指数的比值测度了143个国家的可持续发展水平;龙亮军[14 ] 将主观满意度纳入评价指标体系,基于两阶段Super-NSBM(Super-efficiency Network SBM)模型测度了中国35个主要城市的生态福利绩效,研究表明主观和客观的综合评价能更真实地反映居民福利水平.随着测度方法与指标选取日渐丰富,生态福利绩效的时空格局演变特征与驱动效应逐渐成为学者研究关注的重点.邓远建等[15 ] 发现2004—2017年中国生态福利绩效整体水平明显降低,在空间上呈现出东部最高、中部次之、西部最低的空间梯度递减格局;方时姣等[3 ] 研究表明,2005—2016年中国生态福利绩效呈上升下降交替演变趋势,表现出从东部到中部再到西部依次递减的空间格局;冯吉芳等[16 ] 运用对数平均迪氏指数法(logarithmic mean divisia index,LMDI)探究中国生态福利绩效的驱动效应,发现服务效应对生态福利绩效表现为抑制作用,而技术效应表现为促进作用;刘国平等[17 ] 采用 L M D I [4 ] 将生态福利绩效分解为经济增长的生态效率与经济增长的福利效应,应用 D E A - M L ( data envelopment analysis-Malmquist Lenberger)指数模型进一步分解经济增长的生态效率,研究表明技术进步是中国经济增长最重要的驱动因素,其次是规模效率变化;钟水映等[18 ] 将绿色发展福利分解为福利脱钩指数与绿色经济效率,运用 D E A M a l m q u i s t
... H D I [4 ] 后得到: ...
上海市生态福利绩效评价研究
1
2017
... 生态福利绩效与生态效率的主要区别在于,前者是提升人类福祉的生态效率[4 ] ,后者一般指的是经济产出对应的生态效率[5 ] .从最早提出生态效率概念的 D a l y [6 ] 的观点来看,生态效率本质上衡量的是单位自然消耗带来的福祉产出.可见,基于福祉产出的角度,生态效率就是生态福利绩效,只不过在经济主导发展观下, G D P [7 -8 ] .此外,本文认为生态福利绩效也可理解为生态福利产出的效率,即生态福利在效率上的延伸.需要指出的是,这种研究下的生态福利是指人类从生态系统中直接获取或享有的终端产品和服务,其关注的焦点是提升生态福利的效率,这与本文生态福利绩效的内涵有着明显的不同. ...
The world dynamics of economic growth: The economics of the steady state
1
1974
... 生态福利绩效与生态效率的主要区别在于,前者是提升人类福祉的生态效率[4 ] ,后者一般指的是经济产出对应的生态效率[5 ] .从最早提出生态效率概念的 D a l y [6 ] 的观点来看,生态效率本质上衡量的是单位自然消耗带来的福祉产出.可见,基于福祉产出的角度,生态效率就是生态福利绩效,只不过在经济主导发展观下, G D P [7 -8 ] .此外,本文认为生态福利绩效也可理解为生态福利产出的效率,即生态福利在效率上的延伸.需要指出的是,这种研究下的生态福利是指人类从生态系统中直接获取或享有的终端产品和服务,其关注的焦点是提升生态福利的效率,这与本文生态福利绩效的内涵有着明显的不同. ...
中部地区人文发展的生态效率评价
1
2011
... 生态福利绩效与生态效率的主要区别在于,前者是提升人类福祉的生态效率[4 ] ,后者一般指的是经济产出对应的生态效率[5 ] .从最早提出生态效率概念的 D a l y [6 ] 的观点来看,生态效率本质上衡量的是单位自然消耗带来的福祉产出.可见,基于福祉产出的角度,生态效率就是生态福利绩效,只不过在经济主导发展观下, G D P [7 -8 ] .此外,本文认为生态福利绩效也可理解为生态福利产出的效率,即生态福利在效率上的延伸.需要指出的是,这种研究下的生态福利是指人类从生态系统中直接获取或享有的终端产品和服务,其关注的焦点是提升生态福利的效率,这与本文生态福利绩效的内涵有着明显的不同. ...
从“里约+20”看绿色经济新理念和新趋势
1
2012
... 生态福利绩效与生态效率的主要区别在于,前者是提升人类福祉的生态效率[4 ] ,后者一般指的是经济产出对应的生态效率[5 ] .从最早提出生态效率概念的 D a l y [6 ] 的观点来看,生态效率本质上衡量的是单位自然消耗带来的福祉产出.可见,基于福祉产出的角度,生态效率就是生态福利绩效,只不过在经济主导发展观下, G D P [7 -8 ] .此外,本文认为生态福利绩效也可理解为生态福利产出的效率,即生态福利在效率上的延伸.需要指出的是,这种研究下的生态福利是指人类从生态系统中直接获取或享有的终端产品和服务,其关注的焦点是提升生态福利的效率,这与本文生态福利绩效的内涵有着明显的不同. ...
Evaluation of urban ecological well-being performance in China: A case study of 30 provincial capital cities
1
2020
... 在生态福利绩效的测度方法上,现有研究主要运用效率模型法或比值法[9 -10 ] .诸大建等[11 ] 最早将生态福利绩效定量表示为人类发展指数与生态足迹的比值;臧漫丹等[12 ] 用出生时预期寿命与人均生态足迹的比值测度了1996—2007年 G 20 C o m m o n [13 ] 应用生活满意度与预期寿命的乘积构建了快乐生活寿命指数,并应用快乐生活寿命指数与生态足迹指数的比值测度了143个国家的可持续发展水平;龙亮军[14 ] 将主观满意度纳入评价指标体系,基于两阶段Super-NSBM(Super-efficiency Network SBM)模型测度了中国35个主要城市的生态福利绩效,研究表明主观和客观的综合评价能更真实地反映居民福利水平.随着测度方法与指标选取日渐丰富,生态福利绩效的时空格局演变特征与驱动效应逐渐成为学者研究关注的重点.邓远建等[15 ] 发现2004—2017年中国生态福利绩效整体水平明显降低,在空间上呈现出东部最高、中部次之、西部最低的空间梯度递减格局;方时姣等[3 ] 研究表明,2005—2016年中国生态福利绩效呈上升下降交替演变趋势,表现出从东部到中部再到西部依次递减的空间格局;冯吉芳等[16 ] 运用对数平均迪氏指数法(logarithmic mean divisia index,LMDI)探究中国生态福利绩效的驱动效应,发现服务效应对生态福利绩效表现为抑制作用,而技术效应表现为促进作用;刘国平等[17 ] 采用 L M D I [4 ] 将生态福利绩效分解为经济增长的生态效率与经济增长的福利效应,应用 D E A - M L ( data envelopment analysis-Malmquist Lenberger)指数模型进一步分解经济增长的生态效率,研究表明技术进步是中国经济增长最重要的驱动因素,其次是规模效率变化;钟水映等[18 ] 将绿色发展福利分解为福利脱钩指数与绿色经济效率,运用 D E A M a l m q u i s t
Which countries are more ecologically efficient in improving human well-being? An application of the index of ecological well-being performance
1
2018
... 在生态福利绩效的测度方法上,现有研究主要运用效率模型法或比值法[9 -10 ] .诸大建等[11 ] 最早将生态福利绩效定量表示为人类发展指数与生态足迹的比值;臧漫丹等[12 ] 用出生时预期寿命与人均生态足迹的比值测度了1996—2007年 G 20 C o m m o n [13 ] 应用生活满意度与预期寿命的乘积构建了快乐生活寿命指数,并应用快乐生活寿命指数与生态足迹指数的比值测度了143个国家的可持续发展水平;龙亮军[14 ] 将主观满意度纳入评价指标体系,基于两阶段Super-NSBM(Super-efficiency Network SBM)模型测度了中国35个主要城市的生态福利绩效,研究表明主观和客观的综合评价能更真实地反映居民福利水平.随着测度方法与指标选取日渐丰富,生态福利绩效的时空格局演变特征与驱动效应逐渐成为学者研究关注的重点.邓远建等[15 ] 发现2004—2017年中国生态福利绩效整体水平明显降低,在空间上呈现出东部最高、中部次之、西部最低的空间梯度递减格局;方时姣等[3 ] 研究表明,2005—2016年中国生态福利绩效呈上升下降交替演变趋势,表现出从东部到中部再到西部依次递减的空间格局;冯吉芳等[16 ] 运用对数平均迪氏指数法(logarithmic mean divisia index,LMDI)探究中国生态福利绩效的驱动效应,发现服务效应对生态福利绩效表现为抑制作用,而技术效应表现为促进作用;刘国平等[17 ] 采用 L M D I [4 ] 将生态福利绩效分解为经济增长的生态效率与经济增长的福利效应,应用 D E A - M L ( data envelopment analysis-Malmquist Lenberger)指数模型进一步分解经济增长的生态效率,研究表明技术进步是中国经济增长最重要的驱动因素,其次是规模效率变化;钟水映等[18 ] 将绿色发展福利分解为福利脱钩指数与绿色经济效率,运用 D E A M a l m q u i s t
生态福利绩效与深化可持续发展的研究
2
2014
... 在生态福利绩效的测度方法上,现有研究主要运用效率模型法或比值法[9 -10 ] .诸大建等[11 ] 最早将生态福利绩效定量表示为人类发展指数与生态足迹的比值;臧漫丹等[12 ] 用出生时预期寿命与人均生态足迹的比值测度了1996—2007年 G 20 C o m m o n [13 ] 应用生活满意度与预期寿命的乘积构建了快乐生活寿命指数,并应用快乐生活寿命指数与生态足迹指数的比值测度了143个国家的可持续发展水平;龙亮军[14 ] 将主观满意度纳入评价指标体系,基于两阶段Super-NSBM(Super-efficiency Network SBM)模型测度了中国35个主要城市的生态福利绩效,研究表明主观和客观的综合评价能更真实地反映居民福利水平.随着测度方法与指标选取日渐丰富,生态福利绩效的时空格局演变特征与驱动效应逐渐成为学者研究关注的重点.邓远建等[15 ] 发现2004—2017年中国生态福利绩效整体水平明显降低,在空间上呈现出东部最高、中部次之、西部最低的空间梯度递减格局;方时姣等[3 ] 研究表明,2005—2016年中国生态福利绩效呈上升下降交替演变趋势,表现出从东部到中部再到西部依次递减的空间格局;冯吉芳等[16 ] 运用对数平均迪氏指数法(logarithmic mean divisia index,LMDI)探究中国生态福利绩效的驱动效应,发现服务效应对生态福利绩效表现为抑制作用,而技术效应表现为促进作用;刘国平等[17 ] 采用 L M D I [4 ] 将生态福利绩效分解为经济增长的生态效率与经济增长的福利效应,应用 D E A - M L ( data envelopment analysis-Malmquist Lenberger)指数模型进一步分解经济增长的生态效率,研究表明技术进步是中国经济增长最重要的驱动因素,其次是规模效率变化;钟水映等[18 ] 将绿色发展福利分解为福利脱钩指数与绿色经济效率,运用 D E A M a l m q u i s t
... 参考相关文献[11 ,13 ] ,将生态福利绩效( E W P ) 定义为单位自然消耗带来的福祉水平提升,并用综合福祉指数与人均生态足迹指数的比值表示: ...
生态福利绩效: 概念、内涵及G20实证
1
2013
... 在生态福利绩效的测度方法上,现有研究主要运用效率模型法或比值法[9 -10 ] .诸大建等[11 ] 最早将生态福利绩效定量表示为人类发展指数与生态足迹的比值;臧漫丹等[12 ] 用出生时预期寿命与人均生态足迹的比值测度了1996—2007年 G 20 C o m m o n [13 ] 应用生活满意度与预期寿命的乘积构建了快乐生活寿命指数,并应用快乐生活寿命指数与生态足迹指数的比值测度了143个国家的可持续发展水平;龙亮军[14 ] 将主观满意度纳入评价指标体系,基于两阶段Super-NSBM(Super-efficiency Network SBM)模型测度了中国35个主要城市的生态福利绩效,研究表明主观和客观的综合评价能更真实地反映居民福利水平.随着测度方法与指标选取日渐丰富,生态福利绩效的时空格局演变特征与驱动效应逐渐成为学者研究关注的重点.邓远建等[15 ] 发现2004—2017年中国生态福利绩效整体水平明显降低,在空间上呈现出东部最高、中部次之、西部最低的空间梯度递减格局;方时姣等[3 ] 研究表明,2005—2016年中国生态福利绩效呈上升下降交替演变趋势,表现出从东部到中部再到西部依次递减的空间格局;冯吉芳等[16 ] 运用对数平均迪氏指数法(logarithmic mean divisia index,LMDI)探究中国生态福利绩效的驱动效应,发现服务效应对生态福利绩效表现为抑制作用,而技术效应表现为促进作用;刘国平等[17 ] 采用 L M D I [4 ] 将生态福利绩效分解为经济增长的生态效率与经济增长的福利效应,应用 D E A - M L ( data envelopment analysis-Malmquist Lenberger)指数模型进一步分解经济增长的生态效率,研究表明技术进步是中国经济增长最重要的驱动因素,其次是规模效率变化;钟水映等[18 ] 将绿色发展福利分解为福利脱钩指数与绿色经济效率,运用 D E A M a l m q u i s t
Measuring national economic performance without using prices
3
2007
... 在生态福利绩效的测度方法上,现有研究主要运用效率模型法或比值法[9 -10 ] .诸大建等[11 ] 最早将生态福利绩效定量表示为人类发展指数与生态足迹的比值;臧漫丹等[12 ] 用出生时预期寿命与人均生态足迹的比值测度了1996—2007年 G 20 C o m m o n [13 ] 应用生活满意度与预期寿命的乘积构建了快乐生活寿命指数,并应用快乐生活寿命指数与生态足迹指数的比值测度了143个国家的可持续发展水平;龙亮军[14 ] 将主观满意度纳入评价指标体系,基于两阶段Super-NSBM(Super-efficiency Network SBM)模型测度了中国35个主要城市的生态福利绩效,研究表明主观和客观的综合评价能更真实地反映居民福利水平.随着测度方法与指标选取日渐丰富,生态福利绩效的时空格局演变特征与驱动效应逐渐成为学者研究关注的重点.邓远建等[15 ] 发现2004—2017年中国生态福利绩效整体水平明显降低,在空间上呈现出东部最高、中部次之、西部最低的空间梯度递减格局;方时姣等[3 ] 研究表明,2005—2016年中国生态福利绩效呈上升下降交替演变趋势,表现出从东部到中部再到西部依次递减的空间格局;冯吉芳等[16 ] 运用对数平均迪氏指数法(logarithmic mean divisia index,LMDI)探究中国生态福利绩效的驱动效应,发现服务效应对生态福利绩效表现为抑制作用,而技术效应表现为促进作用;刘国平等[17 ] 采用 L M D I [4 ] 将生态福利绩效分解为经济增长的生态效率与经济增长的福利效应,应用 D E A - M L ( data envelopment analysis-Malmquist Lenberger)指数模型进一步分解经济增长的生态效率,研究表明技术进步是中国经济增长最重要的驱动因素,其次是规模效率变化;钟水映等[18 ] 将绿色发展福利分解为福利脱钩指数与绿色经济效率,运用 D E A M a l m q u i s t
... 由文献评述可知,现有研究围绕生态福利绩效积累了较为丰硕的成果,但仍有如下拓展空间:① 随着“以人民为中心”的发展思想日益深入,幸福感已成为测度福祉水平不可或缺的主观维度,采用主客观综合指标衡量福祉是生态福利绩效测度的研究趋势[13 ,19 ] ,但目前基于主客观综合福祉视角的生态福利绩效定量研究成果尚不多见;② 已有生态福利绩效的时空格局演变研究多关注中国东中西三大区域以及省级区域的差异[3 ,15 ] ,但对中国南北区域之间的生态福利绩效差异鲜有揭示;③ 现有生态福利绩效的驱动效应研究不仅忽视了人地关系和谐背景下主观幸福感因素带来的环境福祉效应及其变化,而且对中国生态福利绩效区域差异的原因,即驱动效应的区域异质性也缺乏探讨,同时,对经济增长效应的决定因素研究尚不充分,在变量选取和研究方法方面还有待改进[20 ] . ...
... 参考相关文献[11 ,13 ] ,将生态福利绩效( E W P ) 定义为单位自然消耗带来的福祉水平提升,并用综合福祉指数与人均生态足迹指数的比值表示: ...
基于两阶段Super-NSBM模型的城市生态福利绩效评价研究
1
2019
... 在生态福利绩效的测度方法上,现有研究主要运用效率模型法或比值法[9 -10 ] .诸大建等[11 ] 最早将生态福利绩效定量表示为人类发展指数与生态足迹的比值;臧漫丹等[12 ] 用出生时预期寿命与人均生态足迹的比值测度了1996—2007年 G 20 C o m m o n [13 ] 应用生活满意度与预期寿命的乘积构建了快乐生活寿命指数,并应用快乐生活寿命指数与生态足迹指数的比值测度了143个国家的可持续发展水平;龙亮军[14 ] 将主观满意度纳入评价指标体系,基于两阶段Super-NSBM(Super-efficiency Network SBM)模型测度了中国35个主要城市的生态福利绩效,研究表明主观和客观的综合评价能更真实地反映居民福利水平.随着测度方法与指标选取日渐丰富,生态福利绩效的时空格局演变特征与驱动效应逐渐成为学者研究关注的重点.邓远建等[15 ] 发现2004—2017年中国生态福利绩效整体水平明显降低,在空间上呈现出东部最高、中部次之、西部最低的空间梯度递减格局;方时姣等[3 ] 研究表明,2005—2016年中国生态福利绩效呈上升下降交替演变趋势,表现出从东部到中部再到西部依次递减的空间格局;冯吉芳等[16 ] 运用对数平均迪氏指数法(logarithmic mean divisia index,LMDI)探究中国生态福利绩效的驱动效应,发现服务效应对生态福利绩效表现为抑制作用,而技术效应表现为促进作用;刘国平等[17 ] 采用 L M D I [4 ] 将生态福利绩效分解为经济增长的生态效率与经济增长的福利效应,应用 D E A - M L ( data envelopment analysis-Malmquist Lenberger)指数模型进一步分解经济增长的生态效率,研究表明技术进步是中国经济增长最重要的驱动因素,其次是规模效率变化;钟水映等[18 ] 将绿色发展福利分解为福利脱钩指数与绿色经济效率,运用 D E A M a l m q u i s t
中国生态福利绩效水平的地区差距及收敛性
2
2021
... 在生态福利绩效的测度方法上,现有研究主要运用效率模型法或比值法[9 -10 ] .诸大建等[11 ] 最早将生态福利绩效定量表示为人类发展指数与生态足迹的比值;臧漫丹等[12 ] 用出生时预期寿命与人均生态足迹的比值测度了1996—2007年 G 20 C o m m o n [13 ] 应用生活满意度与预期寿命的乘积构建了快乐生活寿命指数,并应用快乐生活寿命指数与生态足迹指数的比值测度了143个国家的可持续发展水平;龙亮军[14 ] 将主观满意度纳入评价指标体系,基于两阶段Super-NSBM(Super-efficiency Network SBM)模型测度了中国35个主要城市的生态福利绩效,研究表明主观和客观的综合评价能更真实地反映居民福利水平.随着测度方法与指标选取日渐丰富,生态福利绩效的时空格局演变特征与驱动效应逐渐成为学者研究关注的重点.邓远建等[15 ] 发现2004—2017年中国生态福利绩效整体水平明显降低,在空间上呈现出东部最高、中部次之、西部最低的空间梯度递减格局;方时姣等[3 ] 研究表明,2005—2016年中国生态福利绩效呈上升下降交替演变趋势,表现出从东部到中部再到西部依次递减的空间格局;冯吉芳等[16 ] 运用对数平均迪氏指数法(logarithmic mean divisia index,LMDI)探究中国生态福利绩效的驱动效应,发现服务效应对生态福利绩效表现为抑制作用,而技术效应表现为促进作用;刘国平等[17 ] 采用 L M D I [4 ] 将生态福利绩效分解为经济增长的生态效率与经济增长的福利效应,应用 D E A - M L ( data envelopment analysis-Malmquist Lenberger)指数模型进一步分解经济增长的生态效率,研究表明技术进步是中国经济增长最重要的驱动因素,其次是规模效率变化;钟水映等[18 ] 将绿色发展福利分解为福利脱钩指数与绿色经济效率,运用 D E A M a l m q u i s t
... 由文献评述可知,现有研究围绕生态福利绩效积累了较为丰硕的成果,但仍有如下拓展空间:① 随着“以人民为中心”的发展思想日益深入,幸福感已成为测度福祉水平不可或缺的主观维度,采用主客观综合指标衡量福祉是生态福利绩效测度的研究趋势[13 ,19 ] ,但目前基于主客观综合福祉视角的生态福利绩效定量研究成果尚不多见;② 已有生态福利绩效的时空格局演变研究多关注中国东中西三大区域以及省级区域的差异[3 ,15 ] ,但对中国南北区域之间的生态福利绩效差异鲜有揭示;③ 现有生态福利绩效的驱动效应研究不仅忽视了人地关系和谐背景下主观幸福感因素带来的环境福祉效应及其变化,而且对中国生态福利绩效区域差异的原因,即驱动效应的区域异质性也缺乏探讨,同时,对经济增长效应的决定因素研究尚不充分,在变量选取和研究方法方面还有待改进[20 ] . ...
中国区域生态福利绩效及其影响因素
1
2016
... 在生态福利绩效的测度方法上,现有研究主要运用效率模型法或比值法[9 -10 ] .诸大建等[11 ] 最早将生态福利绩效定量表示为人类发展指数与生态足迹的比值;臧漫丹等[12 ] 用出生时预期寿命与人均生态足迹的比值测度了1996—2007年 G 20 C o m m o n [13 ] 应用生活满意度与预期寿命的乘积构建了快乐生活寿命指数,并应用快乐生活寿命指数与生态足迹指数的比值测度了143个国家的可持续发展水平;龙亮军[14 ] 将主观满意度纳入评价指标体系,基于两阶段Super-NSBM(Super-efficiency Network SBM)模型测度了中国35个主要城市的生态福利绩效,研究表明主观和客观的综合评价能更真实地反映居民福利水平.随着测度方法与指标选取日渐丰富,生态福利绩效的时空格局演变特征与驱动效应逐渐成为学者研究关注的重点.邓远建等[15 ] 发现2004—2017年中国生态福利绩效整体水平明显降低,在空间上呈现出东部最高、中部次之、西部最低的空间梯度递减格局;方时姣等[3 ] 研究表明,2005—2016年中国生态福利绩效呈上升下降交替演变趋势,表现出从东部到中部再到西部依次递减的空间格局;冯吉芳等[16 ] 运用对数平均迪氏指数法(logarithmic mean divisia index,LMDI)探究中国生态福利绩效的驱动效应,发现服务效应对生态福利绩效表现为抑制作用,而技术效应表现为促进作用;刘国平等[17 ] 采用 L M D I [4 ] 将生态福利绩效分解为经济增长的生态效率与经济增长的福利效应,应用 D E A - M L ( data envelopment analysis-Malmquist Lenberger)指数模型进一步分解经济增长的生态效率,研究表明技术进步是中国经济增长最重要的驱动因素,其次是规模效率变化;钟水映等[18 ] 将绿色发展福利分解为福利脱钩指数与绿色经济效率,运用 D E A M a l m q u i s t
碳排放约束下的中国省域全要素福利绩效研究
1
2014
... 在生态福利绩效的测度方法上,现有研究主要运用效率模型法或比值法[9 -10 ] .诸大建等[11 ] 最早将生态福利绩效定量表示为人类发展指数与生态足迹的比值;臧漫丹等[12 ] 用出生时预期寿命与人均生态足迹的比值测度了1996—2007年 G 20 C o m m o n [13 ] 应用生活满意度与预期寿命的乘积构建了快乐生活寿命指数,并应用快乐生活寿命指数与生态足迹指数的比值测度了143个国家的可持续发展水平;龙亮军[14 ] 将主观满意度纳入评价指标体系,基于两阶段Super-NSBM(Super-efficiency Network SBM)模型测度了中国35个主要城市的生态福利绩效,研究表明主观和客观的综合评价能更真实地反映居民福利水平.随着测度方法与指标选取日渐丰富,生态福利绩效的时空格局演变特征与驱动效应逐渐成为学者研究关注的重点.邓远建等[15 ] 发现2004—2017年中国生态福利绩效整体水平明显降低,在空间上呈现出东部最高、中部次之、西部最低的空间梯度递减格局;方时姣等[3 ] 研究表明,2005—2016年中国生态福利绩效呈上升下降交替演变趋势,表现出从东部到中部再到西部依次递减的空间格局;冯吉芳等[16 ] 运用对数平均迪氏指数法(logarithmic mean divisia index,LMDI)探究中国生态福利绩效的驱动效应,发现服务效应对生态福利绩效表现为抑制作用,而技术效应表现为促进作用;刘国平等[17 ] 采用 L M D I [4 ] 将生态福利绩效分解为经济增长的生态效率与经济增长的福利效应,应用 D E A - M L ( data envelopment analysis-Malmquist Lenberger)指数模型进一步分解经济增长的生态效率,研究表明技术进步是中国经济增长最重要的驱动因素,其次是规模效率变化;钟水映等[18 ] 将绿色发展福利分解为福利脱钩指数与绿色经济效率,运用 D E A M a l m q u i s t
中国省际间绿色发展福利测量与评价
1
2017
... 在生态福利绩效的测度方法上,现有研究主要运用效率模型法或比值法[9 -10 ] .诸大建等[11 ] 最早将生态福利绩效定量表示为人类发展指数与生态足迹的比值;臧漫丹等[12 ] 用出生时预期寿命与人均生态足迹的比值测度了1996—2007年 G 20 C o m m o n [13 ] 应用生活满意度与预期寿命的乘积构建了快乐生活寿命指数,并应用快乐生活寿命指数与生态足迹指数的比值测度了143个国家的可持续发展水平;龙亮军[14 ] 将主观满意度纳入评价指标体系,基于两阶段Super-NSBM(Super-efficiency Network SBM)模型测度了中国35个主要城市的生态福利绩效,研究表明主观和客观的综合评价能更真实地反映居民福利水平.随着测度方法与指标选取日渐丰富,生态福利绩效的时空格局演变特征与驱动效应逐渐成为学者研究关注的重点.邓远建等[15 ] 发现2004—2017年中国生态福利绩效整体水平明显降低,在空间上呈现出东部最高、中部次之、西部最低的空间梯度递减格局;方时姣等[3 ] 研究表明,2005—2016年中国生态福利绩效呈上升下降交替演变趋势,表现出从东部到中部再到西部依次递减的空间格局;冯吉芳等[16 ] 运用对数平均迪氏指数法(logarithmic mean divisia index,LMDI)探究中国生态福利绩效的驱动效应,发现服务效应对生态福利绩效表现为抑制作用,而技术效应表现为促进作用;刘国平等[17 ] 采用 L M D I [4 ] 将生态福利绩效分解为经济增长的生态效率与经济增长的福利效应,应用 D E A - M L ( data envelopment analysis-Malmquist Lenberger)指数模型进一步分解经济增长的生态效率,研究表明技术进步是中国经济增长最重要的驱动因素,其次是规模效率变化;钟水映等[18 ] 将绿色发展福利分解为福利脱钩指数与绿色经济效率,运用 D E A M a l m q u i s t
The happy planet index 2.0: Why good lives don't have to cost the earth
1
2009
... 由文献评述可知,现有研究围绕生态福利绩效积累了较为丰硕的成果,但仍有如下拓展空间:① 随着“以人民为中心”的发展思想日益深入,幸福感已成为测度福祉水平不可或缺的主观维度,采用主客观综合指标衡量福祉是生态福利绩效测度的研究趋势[13 ,19 ] ,但目前基于主客观综合福祉视角的生态福利绩效定量研究成果尚不多见;② 已有生态福利绩效的时空格局演变研究多关注中国东中西三大区域以及省级区域的差异[3 ,15 ] ,但对中国南北区域之间的生态福利绩效差异鲜有揭示;③ 现有生态福利绩效的驱动效应研究不仅忽视了人地关系和谐背景下主观幸福感因素带来的环境福祉效应及其变化,而且对中国生态福利绩效区域差异的原因,即驱动效应的区域异质性也缺乏探讨,同时,对经济增长效应的决定因素研究尚不充分,在变量选取和研究方法方面还有待改进[20 ] . ...
基于随机前沿分析的环境规制效率异质性研究
1
2021
... 由文献评述可知,现有研究围绕生态福利绩效积累了较为丰硕的成果,但仍有如下拓展空间:① 随着“以人民为中心”的发展思想日益深入,幸福感已成为测度福祉水平不可或缺的主观维度,采用主客观综合指标衡量福祉是生态福利绩效测度的研究趋势[13 ,19 ] ,但目前基于主客观综合福祉视角的生态福利绩效定量研究成果尚不多见;② 已有生态福利绩效的时空格局演变研究多关注中国东中西三大区域以及省级区域的差异[3 ,15 ] ,但对中国南北区域之间的生态福利绩效差异鲜有揭示;③ 现有生态福利绩效的驱动效应研究不仅忽视了人地关系和谐背景下主观幸福感因素带来的环境福祉效应及其变化,而且对中国生态福利绩效区域差异的原因,即驱动效应的区域异质性也缺乏探讨,同时,对经济增长效应的决定因素研究尚不充分,在变量选取和研究方法方面还有待改进[20 ] . ...
Decomposition analysis for policymaking in energy: Which is the preferred method?
1
2004
... L M D I [21 ] .根据 L M D I t Δ E W P G e f f ) 、环境福祉效应( E e f f ) 、社会福祉效应( S e f f )3 个部分组成: ...
A model for technical inefficiency effects in a stochastic frontier production function for panel data
1
1995
... 式(10)反映出经济增长效应与人均生态足迹以及经济产出的关系,实现相同经济产出的人均生态足迹越低,经济增长效应越强,越有助于驱动生态福利绩效提升.因此,根据 B a t t e s e 等 [22 ] 的随机前沿生产函数,构建经济增长效应的决定因素分解模型: ...
北京居民主观幸福感评价及影响因素研究
1
2014
... 居民幸福感的测量方法一般是通过问卷调查对受访者自我报告的幸福程度进行基数赋值[23 ] ,本文中的居民幸福感来自中国综合社会调查( C G S S ) 与中国家庭追踪调查( C F P S ) 数据集.在 C F P S C G S S C G S S
北京居民主观幸福感评价及影响因素研究
1
2014
... 居民幸福感的测量方法一般是通过问卷调查对受访者自我报告的幸福程度进行基数赋值[23 ] ,本文中的居民幸福感来自中国综合社会调查( C G S S ) 与中国家庭追踪调查( C F P S ) 数据集.在 C F P S C G S S C G S S
Ecological footprints of nations:How much nature do they use? How much nature do they have?
1
1997
... 人均生态足迹的核算需要考虑人类对耕地、林地、草地、渔业用地、建设用地和化石燃料用地等6种类型土地的需求面积,采用Wackernagel等[24 ] 提出的综合法: ...
基于生态足迹的中国生态压力与生态效率测度与评价
2
2016
... 式中: λ i E F i i 2 ), N P i , j Y i , j i j 2 ).耕地足迹部分项目的消费量数据难以获取,而中国主要粮食自给率一直在95%以上,参考史丹等[25 ] 的做法,耕地足迹使用谷物、豆类、薯类、油料、棉花、烟叶、麻类和糖料的产量计算;林地足迹用干鲜瓜果类消费量计算;草地足迹用猪肉、牛羊肉、奶类、禽蛋的消费量计算;建筑用地足迹用电力消费量计算;渔业用地足迹用水产品消费量计算;化石燃料用地足迹采用煤炭、焦炭、原油、汽油、煤油、柴油、燃料油和天然气等8种能源产品的消费量计算. ...
... 由于 C F P S [28 ] ,东中西三大区域划分采用学界一般通行做法[29 ] .美元购买力平价因子来自世界银行[30 ] .2012年及以前的居民幸福感来自 C G S S C F P S [25 ] 的研究.各省市年龄段人口数据来自2007—2019年《中国人口和就业统计年鉴》以及《中国2010年人口普查资料》,其他数据均来源于2007—2019年《中国统计年鉴》《中国能源统计年鉴》和各省市统计年鉴. ...
中国省际物质资本存量估算: 1952—2000
1
2004
... 经济增长效应的决定因素分解模型中,经济总产出以2005年为不变价的 G D P [26 ] 的方法计算;劳动投入以就业人数表示.同时,结合现有文献[3 ,27 ] ,技术非效率项的影响变量选取如下:① 城镇化水平( C i t y ) ,用年末城镇人口占总人口比重衡量;② 能源消费结构( E n c s ) ,以煤炭消费量占总能源消费比重表征;③ 技术进步( T e c ) ,用研发支出占 G D P I n d u s ) ,以第二产业增加值占 G D P O p e n ) ,用货物进出口总额占 G D P F d i ) ,用外商直接投资额占 G D P
中国包容性绿色效率时空格局与溢出效应分析
1
2021
... 经济增长效应的决定因素分解模型中,经济总产出以2005年为不变价的 G D P [26 ] 的方法计算;劳动投入以就业人数表示.同时,结合现有文献[3 ,27 ] ,技术非效率项的影响变量选取如下:① 城镇化水平( C i t y ) ,用年末城镇人口占总人口比重衡量;② 能源消费结构( E n c s ) ,以煤炭消费量占总能源消费比重表征;③ 技术进步( T e c ) ,用研发支出占 G D P I n d u s ) ,以第二产业增加值占 G D P O p e n ) ,用货物进出口总额占 G D P F d i ) ,用外商直接投资额占 G D P
中国要素市场化配置水平的南北差异及形成机理
1
2021
... 由于 C F P S [28 ] ,东中西三大区域划分采用学界一般通行做法[29 ] .美元购买力平价因子来自世界银行[30 ] .2012年及以前的居民幸福感来自 C G S S C F P S [25 ] 的研究.各省市年龄段人口数据来自2007—2019年《中国人口和就业统计年鉴》以及《中国2010年人口普查资料》,其他数据均来源于2007—2019年《中国统计年鉴》《中国能源统计年鉴》和各省市统计年鉴. ...
中国要素市场化配置水平的南北差异及形成机理
1
2021
... 由于 C F P S [28 ] ,东中西三大区域划分采用学界一般通行做法[29 ] .美元购买力平价因子来自世界银行[30 ] .2012年及以前的居民幸福感来自 C G S S C F P S [25 ] 的研究.各省市年龄段人口数据来自2007—2019年《中国人口和就业统计年鉴》以及《中国2010年人口普查资料》,其他数据均来源于2007—2019年《中国统计年鉴》《中国能源统计年鉴》和各省市统计年鉴. ...
技术进步视角下中国产业结构高级化格局及影响因素
1
2022
... 由于 C F P S [28 ] ,东中西三大区域划分采用学界一般通行做法[29 ] .美元购买力平价因子来自世界银行[30 ] .2012年及以前的居民幸福感来自 C G S S C F P S [25 ] 的研究.各省市年龄段人口数据来自2007—2019年《中国人口和就业统计年鉴》以及《中国2010年人口普查资料》,其他数据均来源于2007—2019年《中国统计年鉴》《中国能源统计年鉴》和各省市统计年鉴. ...
技术进步视角下中国产业结构高级化格局及影响因素
1
2022
... 由于 C F P S [28 ] ,东中西三大区域划分采用学界一般通行做法[29 ] .美元购买力平价因子来自世界银行[30 ] .2012年及以前的居民幸福感来自 C G S S C F P S [25 ] 的研究.各省市年龄段人口数据来自2007—2019年《中国人口和就业统计年鉴》以及《中国2010年人口普查资料》,其他数据均来源于2007—2019年《中国统计年鉴》《中国能源统计年鉴》和各省市统计年鉴. ...
1
2020
... 由于 C F P S [28 ] ,东中西三大区域划分采用学界一般通行做法[29 ] .美元购买力平价因子来自世界银行[30 ] .2012年及以前的居民幸福感来自 C G S S C F P S [25 ] 的研究.各省市年龄段人口数据来自2007—2019年《中国人口和就业统计年鉴》以及《中国2010年人口普查资料》,其他数据均来源于2007—2019年《中国统计年鉴》《中国能源统计年鉴》和各省市统计年鉴. ...
中国工业绿色增长效率的测算及其变化特征
1
2022
... 由图1 可知,2006—2018年中国生态福利绩效整体呈下降趋势, E W P [31 ] ,人均生态足迹指数增速加快, E W P [32 ] ,长期以来煤炭一直是中国的主体能源,这使得中国人均生态足迹指数居高不下,即使在2014年后增速放缓,其年均增速也达到了3.088%.中国人类福祉水平有所提升,但综合福祉指数的年均增速仅为1.877%,远低于人均生态足迹指数的增速.其中,中国人类发展指数稳步提升,从2006年的0.747升至2018年的0.850,中国迈入高人类发展水平梯队.中国居民幸福感指数则是波动提升,从2006年的0.787升至2018年的0.865,年均增速仅0.791%,这与何晓斌等[33 ] 的测算结果相近. ...
中国生态足迹和生物承载力构成比例变化分析
1
2009
... 由图1 可知,2006—2018年中国生态福利绩效整体呈下降趋势, E W P [31 ] ,人均生态足迹指数增速加快, E W P [32 ] ,长期以来煤炭一直是中国的主体能源,这使得中国人均生态足迹指数居高不下,即使在2014年后增速放缓,其年均增速也达到了3.088%.中国人类福祉水平有所提升,但综合福祉指数的年均增速仅为1.877%,远低于人均生态足迹指数的增速.其中,中国人类发展指数稳步提升,从2006年的0.747升至2018年的0.850,中国迈入高人类发展水平梯队.中国居民幸福感指数则是波动提升,从2006年的0.787升至2018年的0.865,年均增速仅0.791%,这与何晓斌等[33 ] 的测算结果相近. ...
从经济到社会——中国城镇居民主观幸福感影响因素的变迁: 2003—2017
1
2021
... 由图1 可知,2006—2018年中国生态福利绩效整体呈下降趋势, E W P [31 ] ,人均生态足迹指数增速加快, E W P [32 ] ,长期以来煤炭一直是中国的主体能源,这使得中国人均生态足迹指数居高不下,即使在2014年后增速放缓,其年均增速也达到了3.088%.中国人类福祉水平有所提升,但综合福祉指数的年均增速仅为1.877%,远低于人均生态足迹指数的增速.其中,中国人类发展指数稳步提升,从2006年的0.747升至2018年的0.850,中国迈入高人类发展水平梯队.中国居民幸福感指数则是波动提升,从2006年的0.787升至2018年的0.865,年均增速仅0.791%,这与何晓斌等[33 ] 的测算结果相近. ...
中国生态福利绩效测度与空间关联网络特征分析
1
2021
... 从空间格局演变来看,2006年中国南方省份的生态福利绩效整体高于北方,生态福利绩效排名前5的省份中有4个南方省份,而北方大多数省份生态福利绩效较低,内蒙古、山西、宁夏、辽宁、山东、新疆等省份的生态福利绩效排名处在全国靠后位置(图2 ).2018年,中国生态福利绩效整体降低的态势明显,30个省份中仅有10个省份生态福利绩效有所提升,其中8个都位于南方.尤其是四川、重庆和湖南,生态福利绩效一直保持在较高水平,年均增速分别为0.78%、0.59%、0.45%.而宁夏、内蒙古、山西、新疆、黑龙江以及陕西等北方省份,生态福利绩效分别年均降低7.99%、4.01%、2.42%、6.05%、2.67%、4.05%.可见,中国生态福利绩效的南北差异不断扩大,呈现出“南高北低”的空间分异特征,这与刘煜等[34 ] 的研究结论一致. ...
陕西省城市绿色增长水平时空演变特征及影响因素解析
1
2022
... (1) 全国结果分析.由表1 中全国样本可以看出,技术进步是经济增长效应最重要的决定因素.近年来中国持续加大研发投入力度,代表研发成果的发明专利授权量大幅增长,特别是绿色专利授权量在2006—2010年内年均增长36.34%,大大提高了生产效率,使技术进步对经济增长效应发挥着十分显著的促进作用.对外开放和外商直接投资也是经济增长效应重要的决定因素,这主要与对外开放和外商直接投资能够带来先进管理经验和技术溢出效应,提高资源利用效率的同时刺激国内企业技术升级有关[3 ,35 ] .城镇化水平的回归系数显著为正,对经济增长效应表现为抑制作用.中国城镇化水平从2006年的43.90%提高至2018年的59.58%,由此产生的要素集聚效应虽提高了生产效率,但伴随农村人口向城市转移,也不可避免地产生了一系列资源消耗与环境污染问题[36 ] ,造成生态足迹升高.产业结构和能源消费结构的回归系数也显著为正.中国第二产业具有高能耗、高污染、高排放等特征[37 ] ,而2006—2018年中国煤炭消费占能源消费总量的比重均值高达67.23%,与风能、水能等清洁能源相比,煤炭能源利用效率较低,不仅不利于“双碳”目标实现,还导致生态足迹居高不下. ...
文化产业集聚对绿色经济效率的影响: 基于动态面板模型的实证分析
1
2017
... (1) 全国结果分析.由表1 中全国样本可以看出,技术进步是经济增长效应最重要的决定因素.近年来中国持续加大研发投入力度,代表研发成果的发明专利授权量大幅增长,特别是绿色专利授权量在2006—2010年内年均增长36.34%,大大提高了生产效率,使技术进步对经济增长效应发挥着十分显著的促进作用.对外开放和外商直接投资也是经济增长效应重要的决定因素,这主要与对外开放和外商直接投资能够带来先进管理经验和技术溢出效应,提高资源利用效率的同时刺激国内企业技术升级有关[3 ,35 ] .城镇化水平的回归系数显著为正,对经济增长效应表现为抑制作用.中国城镇化水平从2006年的43.90%提高至2018年的59.58%,由此产生的要素集聚效应虽提高了生产效率,但伴随农村人口向城市转移,也不可避免地产生了一系列资源消耗与环境污染问题[36 ] ,造成生态足迹升高.产业结构和能源消费结构的回归系数也显著为正.中国第二产业具有高能耗、高污染、高排放等特征[37 ] ,而2006—2018年中国煤炭消费占能源消费总量的比重均值高达67.23%,与风能、水能等清洁能源相比,煤炭能源利用效率较低,不仅不利于“双碳”目标实现,还导致生态足迹居高不下. ...
经济结构调整、绿色技术进步与中国低碳转型发展: 基于总体技术前沿和空间溢出效应视角的经验考察
1
2022
... (1) 全国结果分析.由表1 中全国样本可以看出,技术进步是经济增长效应最重要的决定因素.近年来中国持续加大研发投入力度,代表研发成果的发明专利授权量大幅增长,特别是绿色专利授权量在2006—2010年内年均增长36.34%,大大提高了生产效率,使技术进步对经济增长效应发挥着十分显著的促进作用.对外开放和外商直接投资也是经济增长效应重要的决定因素,这主要与对外开放和外商直接投资能够带来先进管理经验和技术溢出效应,提高资源利用效率的同时刺激国内企业技术升级有关[3 ,35 ] .城镇化水平的回归系数显著为正,对经济增长效应表现为抑制作用.中国城镇化水平从2006年的43.90%提高至2018年的59.58%,由此产生的要素集聚效应虽提高了生产效率,但伴随农村人口向城市转移,也不可避免地产生了一系列资源消耗与环境污染问题[36 ] ,造成生态足迹升高.产业结构和能源消费结构的回归系数也显著为正.中国第二产业具有高能耗、高污染、高排放等特征[37 ] ,而2006—2018年中国煤炭消费占能源消费总量的比重均值高达67.23%,与风能、水能等清洁能源相比,煤炭能源利用效率较低,不仅不利于“双碳”目标实现,还导致生态足迹居高不下. ...


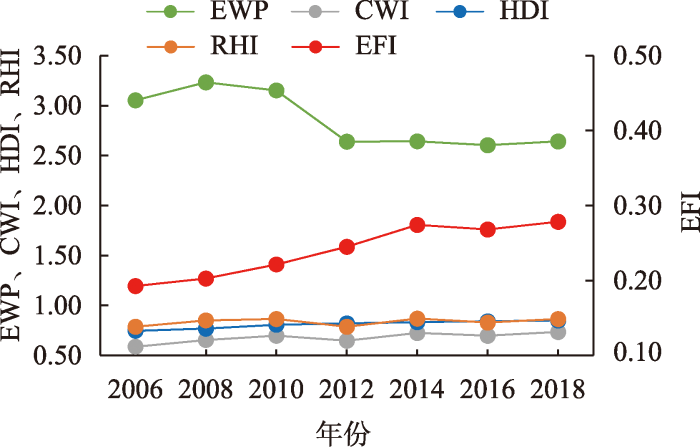
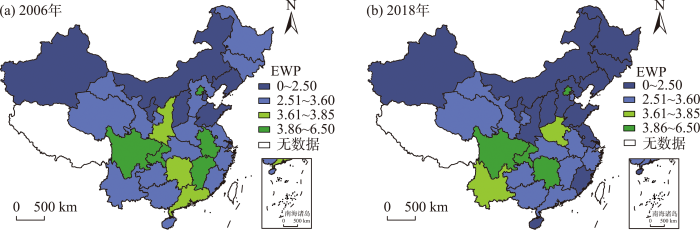
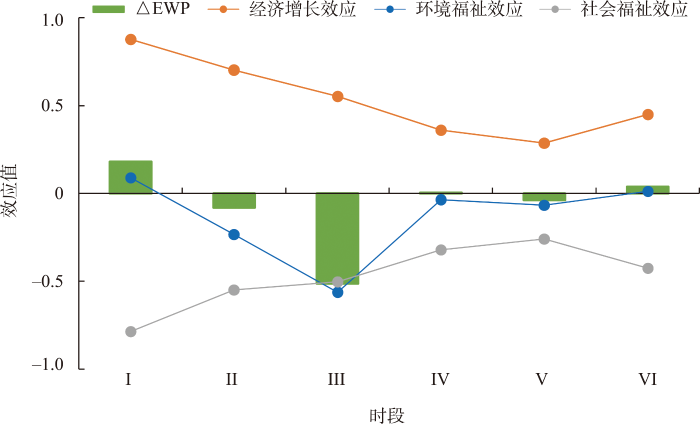

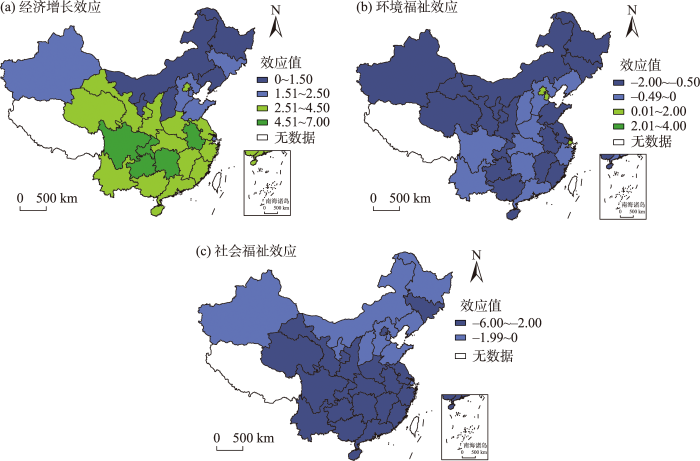

