

洱海作为云南九大高原湖泊之一,是大理市主要水源地,洱海水资源的开发与利用对大理经济可持续发展具有重要意义。洱海流域内主要来水源自降水和融雪,这些降水和融雪主要以湖面降水、地表径流和地下径流等方式进入湖泊[1]。21世纪以来,由于人们生产生活用水的需求增加,不断提高开发和利用洱海水资源以满足用水需求,加上当地旅游业的迅速发展,污染性物质通过不同方式进入洱海造成洱海外源污染负荷剧增,从而导致湖体水质恶化,水生态系统遭受破坏。研究洱海流域内流量的空间分布以及出入湖流量的变化情况,对于流域内水资源的可持续保护和发展具有深远意义。
水文模型可用于研究自然界复杂的水文过程以及对地区水资源进行合理规划与利用,是一种能对复杂的水文过程进行数学描述和简单化的重要工具[2-3]。水文模型的研究对象是整个水文系统,研究人员利用计算机,根据不同的气象条件进行数学模拟和数据分析,从而构建数学模型,对降雨径流的形成过程进行模拟,目前已被广泛运用于流域水文研究[4]。新安江模型是1973年由河海大学赵人俊等[5]研究开发的降雨径流模型,由于该模型结构清晰、层次分明,因此,在国内湿润、半湿润地区的湖泊水量研究中得到广泛运用。芮孝芳等[6]对新安江模型的起源、结构特点做了总结,并为模型发展的新方向提出了建议。李俊辉[7]将三水源新安江模型运用于涢水流域,对流域内的流量过程进行了模拟,评价标准系数好,说明新安江模型在径流模拟运用中效果良好。随着模型的发展和研究的不断深入,新安江模型在干旱半干旱地区也得到了运用。邵成国等[8]将有融雪结构的三江源水文模型运用于干旱地区的乌鲁木齐河,并且取得较好的模拟效果,说明新安江模型适用流域广泛。然而,该模型在研究高原湖泊的流域范围中使用较少。
洱海流域的流量资料较为匮乏,在获取流量数据较为困难的情况下,本文采用一维水动力模型(dynamic reservoir simulation model,DYRESM)对洱海出入湖水量进行反演。DYRESM在国内外已被广泛运用于计算湖泊出入湖水量的研究,例如:Fenocchi等[9]利用DYRESM修正了模拟水位和实测水位之间的每日误差,在没有实测入湖量数据的情况下估算了1998—2015年进入Maggiore湖的水量;Fadel等[10]利用DYRESM对Karaoun水库的水位波动情况进行模拟和迭代校准,获得了精确的入湖流量;Zhang等[11]在无实测流量数据情况下通过DYRESM模拟了滇池外海入湖水量,并计算了每年的外源负荷。因此,本文通过DYRESM对洱海流域2000—2020年出入湖水量进行反演,并且通过水量补偿法对模型中出入湖水量进行修正,当模拟水位与实测水位相关系数r接近1,模拟得到较为准确的逐日出入湖水量模拟值;并与新安江模型计算得到的流量数据进行对比,探讨DYRESM与新安江模型在洱海出入流重建中的应用对比,研究新安江模型在高原湖泊运用的可行性,分析新安江模型在高原湖泊与平原地区流域内运用中参数的差异性,并为在类似流域的运用和研究提供借鉴。
1 研究区概况
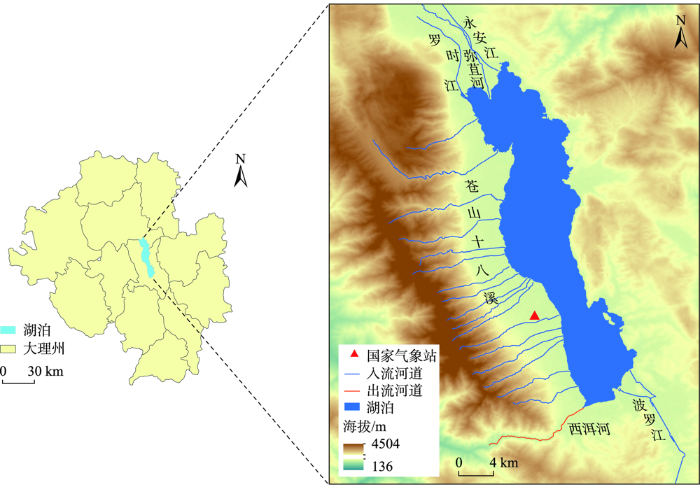
洱海(25°25′~26°10′N,100°05′~100°17′E,)位于云南省大理自治州中部(图1),是国家重点保护水域之一[1]。当洱海湖面高程为1966 m时,湖面面积为251 km²,相应的湖泊容量达2.88×10⁹ m³。洱海湖体形状似耳,呈北北西—南南东狭长走向,南北长42.5 km,东西平均宽度为6.3 km;湖泊最大湖深20.9 m,平均水深10.5 m,湖泊岸线长度达127.85 km。洱海流域全年气候温和、日照充足、干湿分明,属低纬高原亚热带季风气候[1],年均降水量1048 mm[12],湖面蒸发量1208 mm。洱海属于澜沧江—湄公河水系[1],主要河道包括弥苴河、西洱河、罗时江、波罗江、永安江以及苍山十八溪等[12]。
图1
2 数据与方法
2.1 数据来源
为确保DYRESM模拟的精度,也使得新安江模型运用的流量数据的合理性,本文收集了详细的有关洱海流域内的相关气象、水文和地形数据,详见表1。
表1 数据来源
Tab.1
| 类别 | 数据类型 | 数据时段 | 数据说明 | 数据来源 |
|---|---|---|---|---|
| 实测值 | 地形数据 | — | 水体等高线 (洱海湖底高程—面积生成) | 云南省生态环境厅 |
| 气象数据 | 2000—2020年 | 太阳辐射数据来自丽江市气象监测站,其余气象数据来自大理市气象监测站 (国家基本气象站) | 中国气象数据网 | |
| 水位数据 | 2000—2020年 | 逐日水位数据 | 洱海管理局 | |
| 计算值 | 入湖水量数据 | 2000—2020年 | 逐日入湖水量 | 水量补偿法计算、文献[13] |
| 河道出湖数据 | 2000—2020年 | 年均出湖水量 | 文献[13-16] | |
| 流域面积数据 | — | 入湖流域面积 | 文献[15] |
注:大理市气象监测站(25.7°N、100.18°E),站台号为56751;丽江市气象监测站(26.86°N、100.22°E),站台号为56651;气象数据包括降雨量和降雪量(mm)、蒸散发量(mm)、云量(0~1)、大气温度(℃)、水汽压(hPa)、空气相对湿度(0~1)、风速(m/s)、太阳辐射(W/m2)、太阳长波辐射(W/m2)。
2.2 研究方法
2.2.1 DYRESM
DYRESM包括7个重要文件,分别是气象文件(.met)、地形文件(.stg)、入流文件(.inf)、出流文件 (.wdr)、初始剖面文件(.pro)、参数文件(.par)和配置文件(.cfg)[19]。① 气象文件主要包括降雨量和降雪量、气温、平均风速、云量、水汽压、太阳辐射、太阳长波辐射[20];② 地形文件由湖底高程—面积关系生成,根据所需设置水深梯度,对水体进行分层并分别计算不同水层对应的水面面积;③ 入流文件包括洱海流域主要入湖河道水质数据、主要入湖河道逐日流量数据,出流文件为洱海流域主要出湖河道逐日出流量;④ 初始剖面文件即模拟起始时刻水体垂直剖面上水温与水质信息[21];⑤ 配置文件与参数文件中的各物理参数取值范围主要借鉴于文献,并且根据洱海流域的特征在建模过程中对参数进行调试,具体参数值如表2所示。
表2 DYRESM主要参数
Tab.2
2.2.2 水量补偿法
水量补偿的流程如图2所示。配置模型原始出入流文件后运行模型,DYRESM在运行中出现水量溢出情况,说明出入湖水量不平衡[9,16],在仅考虑湖面的降水和蒸发情况时,运行模型得到逐日模拟水位;根据洱海水下地形图(比例尺1∶2000),得到不同水深对应的湖体横剖面面积和体积,从而构建洱海湖体的水位—库容曲线,得到拟合方程为y=0.48x+11.52,其中x为水位(m),y为库容(108 m³),相关系数r为0.99(n=94);基于水位—库容曲线计算逐日的模拟库容差值,相对于前一天进行求差,得到每日的实测库容差值和模拟库容差值。实测库容差值与模拟库容差值间进行求差,即为模型每日需调整的水量补偿值,得到的补偿值数值出现正负不同的情况时,正值表示模拟库容值较实测库容值小,需要增加入流量,因此补充一条虚拟河道作为虚拟入流河道,补偿水量值加入虚拟河道中;出现负值说明模型的出流量较小,需要增加出流量,即取补偿值的绝对值后加入出流河道中,从而实现一次水量补偿流程的计算。补偿水量后再次运行DYRESM,将得出的实测水位与模拟水位进行对比,若对比结果显示模拟水位与实测水位之间误差较大,则重复使用水量平衡原理对洱海出入湖水量进行补偿,直到模拟水位与实测水位的拟合系数r接近1,即完成湖体水量平衡的计算,得到更接近河道中实测出入湖流量值的逐日出入湖流量模拟值。
图2

2.2.3 新安江模型
图3

式中:E、W、M分别为实际总蒸散发量、土壤总含水量和张力水总蓄水容量(mm);EU、EL、ED分别表示上、下、深各层的蒸散发量(mm);WU、WL、WD分别表示上、下、深各层的土壤含水量(mm);UM、LM、DM分别表示上、下、深各层土壤的张力水蓄水容量(mm)[35]。
表3 新安江模型参数
Tab.3
| 计算模块 | 参数符号 | 参数意义 | 取值范围 |
|---|---|---|---|
| 蒸散发计算 | UM(mm) | 上层张力水蓄水容量 | 5~100[36] |
| LM(mm) | 下层张力水蓄水容量 | 50~300[36] | |
| DM(mm) | 深层张力水蓄水容量 | 5~100[36] | |
| C | 深层蒸散发扩散系数 | 1~1.5[36] | |
| 产流计算 | B | 流域蓄水容量—面积分布曲线指数 | 0.05~0.4[36] |
| Im(%) | 不透水面积比例 | 0~0.5[36] | |
| 水源划分 | Sm(mm) | 自由水蓄水容量 | 5~100[36] |
| Ex | 自由水蓄水容量—面积分布曲线指数 | 0.5~2.0[36] | |
| Kg | 自由水蓄水容库对地下水的日出流系数 | Kg+Ki=0.7~0.8[36] | |
| Ki | 自由水蓄水容库对壤中流的日出流系数 | ||
| 汇流计算 | Cg | 壤中流消退系数 | 0.9~0.999[36] |
| Ci | 地下水消退系数 | 0.05~0.95[36] | |
| Cs | 地面径流消退系数 | 0.001~0.8[36] | |
| L | 滞后时间 | 0~3[36] |
2.2.4 模型的评估标准
模型模拟值和实际测量值之间的误差分析和模型精度评估主要是由以下3个指标进行验证:均方根误差(root mean square error,RMSE)、纳什效率系数(Nash-sutcliffe efficiency,NSE)和相关系数(r)。
各指标计算公式如下:
式中:
NSE常用于水文模型的精度拟合。当0<NSE≤1时,NSE值越接近1,表示模拟值越接近于实测值,模拟效果越好,NSE=1表示模拟值与实测值完全拟合;当NSE≤0时则表示拟合程度极差。RMSE的计算结果表示实测值与模拟值的离散程度,RMSE≤1,值越小表示拟合程度越好。在新安江模型的参数率定过程中,WBE值越接近0,表示模型的模拟值和实测越接近,模拟效果越好。
3 结果分析
3.1 DYRESM出入湖水量结果验证
3.1.1 水量补偿
图4
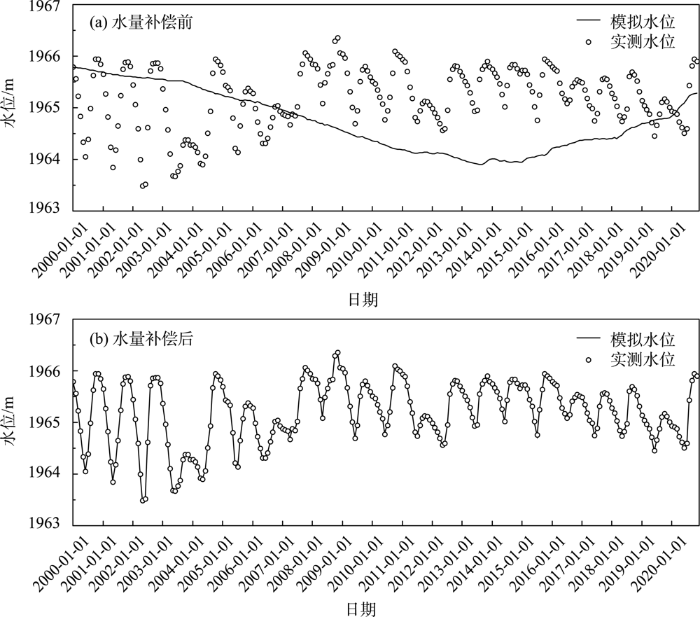
图4
2000—2020年水量补偿前(a)与水量补偿后(b)逐日水位模拟与实测对比
Fig.4
Comparison of simulated and measured daily water levels from 2000 to 2020 before water balancing (a) and after water balancing (b)
3.1.2 入湖水量与降水量拟合
图5
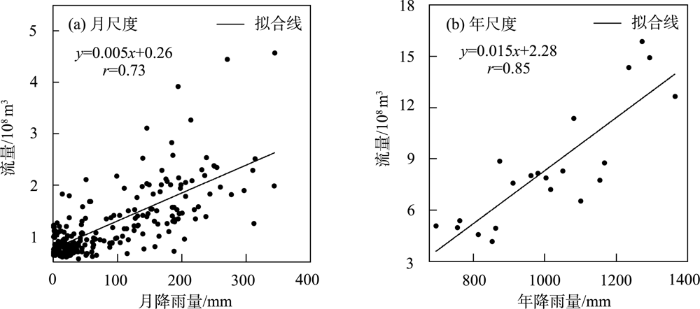
图5
2000—2020年月尺度和年尺度降水量—入湖水量拟合关系
Fig.5
Regressed equation between precipitation and inflow volume at monthly and annual temporal scales during 2000-2020
3.1.3 出入湖水量结果验证
洱海流域出入湖水量与流量占比见表4。洱海流域多年平均出湖水量为6.09×10⁸ m³ [13,40],包括洱海流域主要出湖河流西洱河、引洱入宾工程和工农业用水及生活用水部分。西洱河是洱海唯一的天然出水口,年均出湖量为3.10×10⁸ m³ [13];引洱入宾工程修建于1994年,年均引水量为0.71×10⁸ m³ [41];2000—2005年的农业用水年均消耗1.69×10⁸ m³,工业用水年均消耗0.14×10⁸ m³,生活用水年均消耗0.08×10⁸ m³ [42],总耗水量年均值为1.91×10⁸ m³。洱海流域多年平均入湖总径流量为5.69×10⁸ m³ [13]。弥苴河作为洱海最大的入湖河流,多年平均入湖量占总入湖流量的40.21%,年平均入湖径流量2.29×10⁸ m3;罗时江、永安江、波罗江年均入湖径流量分别为0.65×10⁸、0.70×10⁸、0.41×10⁸ m3;苍山十八溪年均入湖径流量1.64×10⁸ m3,占洱海入湖总径流量的28.87%。
表4 实测与模型计算出入湖流量对比
Tab.4
采用DYRESM计算得到洱海年平均入湖径流量为6.88×10⁸ m³,年平均出湖径流量为6.08×10⁸ m³,模型逐年入湖流量模拟值与文献[13]中的流量值相差较小,对模型模拟值与实测逐年总流量进行分析,逐年总入湖量模拟值与文献中逐年总入湖量间相关系数r为0.97(n=26),逐年总出湖量模拟值与文献逐年总出流值较接近,相关系数r达到0.99(n=26),可见在无实测数据基础上通过DYRESM模拟流域内出入流水量的可靠性。
3.2 新安江模型参数率定与结果验证
3.2.1 参数率定
本文以洱海流域的2条主要支流弥苴河、波罗江和洱海总流域为例,通过构建新安江模型进行率定和验证。采用流域径流数据时段的2/3用于模型率定,剩余1/3时段数据用于模型的验证,即用于模型率定时段为2000—2013年,验证时段为2014—2020年。
新安江模型在3个试验流域的优化参数值见表5,可以看出各参数值的取值在新安江模型中参数的取值范围内。将新安江模型在高原地区3个试验流域的优化参数与平原地区不同流域运用的参数进行对比,结果显示UM、LM、DM、Ki等参数无明显规律性差异;B、Kg、Cg与平原地区参数值相近;L、Ex小于平原地区参数值;Cs值具有明显地域性;C、Im、Sm、Ci均大于平原地区参数值。
表5 新安江模型在不同地区参数对比
Tab.5
| 参数 | 高原地区 | 平原地区 | |||||
|---|---|---|---|---|---|---|---|
| 弥苴河流域 | 波罗江流域 | 洱海流域 | 王家坝流域[43] | 息县流域[44] | |||
| UM/mm | 74.48 | 71.16 | 5.00 | 20.00 | 20.00 | ||
| LM/mm | 111.75 | 228.35 | 50.00 | 90.00 | 60.00 | ||
| DM/mm | 100.00 | 100.00 | 5.00 | 40.00 | — | ||
| C | 1.50 | 1.50 | 1.02 | 0.30 | 0.10 | ||
| B | 0.40 | 0.39 | 0.40 | 0.40 | 0.40 | ||
| Im/% | 0.17 | 0.13 | 0.13 | 0.03 | 0.01 | ||
| Sm/mm | 100.00 | 100.00 | 100.00 | 5.63 | 53.60 | ||
| Ex | 0.01 | 0.01 | 0.01 | 1.50 | 1.20 | ||
| Kg | 0.58 | 0.55 | 0.53 | 0.50 | 0.65 | ||
| Ki | 0.22 | 0.22 | 0.22 | 0.20 | 0.05 | ||
| Cg | 0.99 | 0.94 | 0.95 | 0.98 | 0.99 | ||
| Ci | 0.99 | 0.96 | 0.93 | 0.88 | 0.70 | ||
| Cs | 0.80 | 0.80 | 0.77 | 0.89 | 0.40 | ||
| L | 0.15 | 0.15 | 0.15 | 5.00 | 1.00 | ||
3.2.2 新安江模型评价
模型精度评价采用NSE与WBE两个指标比较率定期和验证期间新安江模型逐日模拟径流和DYRESM逐日模拟径流的拟合程度,如图6所示。新安江模型在3个流域的运用中,率定期间:弥苴河流域、波罗江流域和总流域NSE均为0.68,WBE分别为4.25%、-4.33%、-6.76%;验证期间:弥苴河流域、波罗江流域以及总流域NSE分别为0.52、0.51、0.55,WBE分别为-0.36%、-0.31%、5.23%。新安江模型在弥苴河、波罗江流域以及总流域的WBE的绝对值都不超过10%,3个流域的率定期与验证期的值都能均匀分布在1∶1直线两侧,说明较符合新安江模型精度要求。
图6
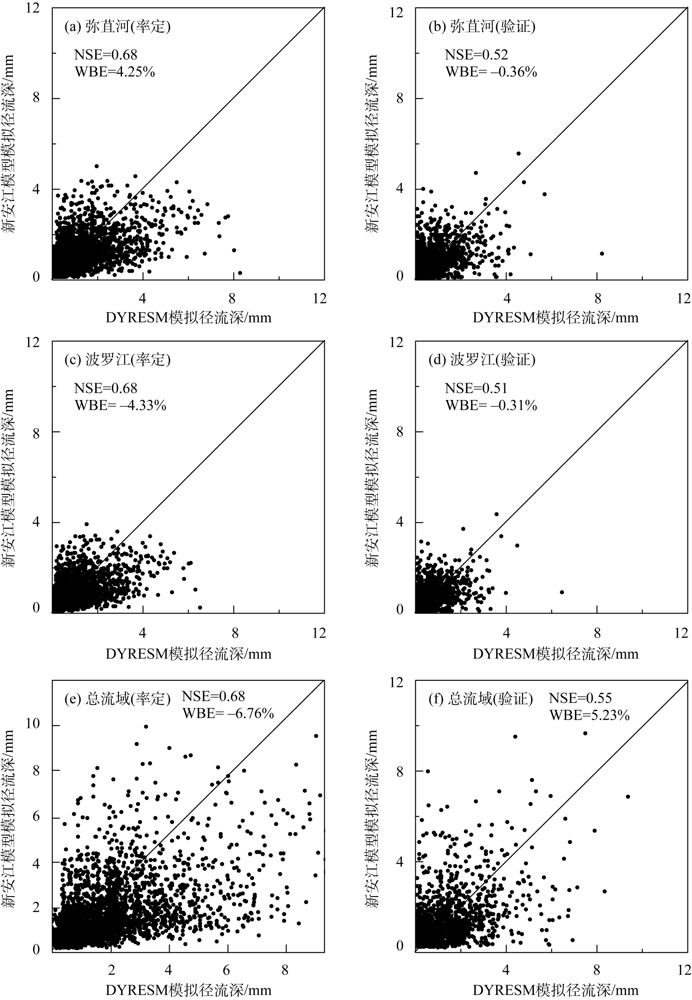
图6
率定期间与验证期间DYRESM与新安江模型模拟径流比较
Fig.6
Comparison of simulated streamflows by the Xin'anjiang Model and DYRESM in calibration and validation
3.2.3 新安江模型模拟结果
将弥苴河、波罗江流域和洱海总流域率定得到的模型用于洱海的各子流域,利用当地的气象数据作为模型的气象数据集,计算出各个子流域的逐日流量值,并且将计算结果分别与DYRESM计算得到的入流量和实测总入流量相比较。新安江模型逐年的总入流量比较结果显示,总流域的参数用于计算得到流量相差最小,因此,最终选用总流域率定得到的参数作为模型的最终参数值对其他流域的逐日流量进行计算。将新安江模型逐年模拟量与DYRESM模拟值、实测值入流总量之间进行比较(图7)。新安江模型与DYRESM模拟值相关系数r达到0.94(n=26);新安江模型模拟值与实测值之间相关性较好,r为0.92(n=26);DYRESM模拟值与实测值相关性显著,r=0.97(n=26)。可见,DYRESM拟合效果较好于新安江模型。
图7
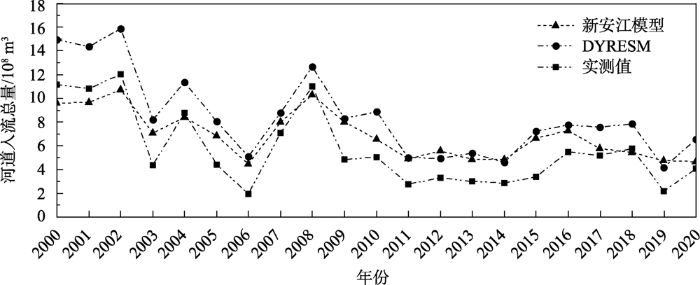
图7
2000—2020年新安江模型、DYRESM与实测逐年模拟总流量
Fig.7
Simulated yearly inflows by the Xin'anjiang Model and DYRESM and measured yearly inflows during 2000-2020
本文运用新安江模型主要计算了弥苴河流域、罗时江流域、永安江流域、波罗江流域、苍山十八溪的逐日入湖流量,将新安江模型得出的逐日入湖流量与DYRESM水量补偿后的逐日入湖流量进行拟合(图8),新安江模型参数值应用于不同支流流域内的模拟效果良好,除罗时江的NSE值为0.57,其余流域均大于0.6,WBE的绝对值均不超过20%。此外,各子流域的拟合线性相关性较高,计算得到弥苴河流域、罗时江流域、永安江流域、波罗江流域和苍山十八溪得到的模型年均值相关系数r分别达到0.87、0.85、0.85、0.88、0.87(n=26),可见,新安江模型与DYRESM的流量数据值拟合效果良好。
图8

图8
洱海各子流域内新安江模型、DYRESM逐日流量模拟值对比
Fig.8
Comparison of simulated daily inflows by the Xin'anjiang Model and DYRESM at different sub-catchments of Lake Erhai
4 讨论
4.1 DYRESM与新安江模型拟合效果分析
4.1.1 DYRESM拟合效果分析
根据DYRESM反演水量得出2000—2020年逐日入湖流量,对洱海流域入湖水量与降雨之间进行线性拟合,年尺度的拟合结果较好,对比历年文献中出入湖流量,可见模型的模拟效果良好,反演流量数据结果可靠。
在无实测数据流域,气象数据仅参考了国家气象站点,各个流域内气象站点数据的缺失导致模型运行结果准确性较低,使用DYRESM对流域内逐日出入流流量进行模拟,能较好地反演历史流量。在模拟结果中分别对2000—2020年间新安江模型逐年总入流模拟量与DYRESM逐年入流模拟量、实测值入流总量进行对比后,发现模型模拟数值较文献中实测值偏高。主要原因如下:
(1) 分不同入湖河道的入湖流量计算中,本文仅选择了洱海流域主要入湖河道,而部分径流量较小的入湖河道忽略不计,导致在主要入湖河道占比分配中出现误差,从而导致在对主要入湖河道的年均流量值模拟中出现的误差较大。
(2) 模型配置中考虑到洱海流域地下水部分。DYRESM能较精确地计算出降水带来的水量和通过蒸发损失的水量,因此,本文在配置主要入湖河道入湖流量数据之外,地下水也被视为入湖河流的一部分,导致DYRESM与新安江模型输出的模拟流量值较实测流量值偏高,洱海流域地下水成分的相关研究较少,具体地下水含量尚不明确,仍需进一步研究与探讨。
4.1.2 新安江模型拟合效果分析
根据新安江模型模拟得到2000—2020年逐日流量,由于无实测逐日入湖流量数据,将DYRESM模拟值作为参考与新安江模型结果进行对比,得到各个子流域在率定期模型精度NSE>0.6,WBE<10%,可见率定期拟合效果较好;验证期模型精度相对较低,NSE在0.5~0.6之间,WBE<10%,已是模型多次调整参数后精度最高的一组模拟值,且新安江模型结果是以DYRESM模拟结果作为参考进行对比,与实测数据之间可能存在一定的差异性,为了新安江模型在洱海流域得到更好的运用,仍需实测数据进行进一步探究。
湖泊的出入湖流量对于湖泊的保护与利用至关重要,相关部门应提高流量监测频率和数据记录,未来进行出入湖流量相关研究时,以便得出更为准确的结果,从而对水资源利用做出合理的管理和规划,为相关部门做决策时提供更好的参考。
4.2 新安江模型参数差异分析
(1) 新安江模型中B、Im、UM、LM、DM、C等参数一般具有固定的规律性。Kg和Ki之间存在相互约束的关系,两参数与退水天数相关[27],Ki+Kg取值范围为0.7~0.8,其中Kg取值与地下径流相关,Kg取值越大,地下径流的比例越大,根据参数对比结果显示,各个流域取值差异不大。
(2) 参数Cg和Ci的取值与流域内退水的时间之间是互为倒数的关系[27],各个流域参数值差异不大。与息县流域对比,到洱海流域的洪水期较少,且流域内退水过程快,因而得到洱海各子流域内的Cg与Ci参数值取值较大。
(3) Cs 参数值反映洪水发生时的洪水坦化程度[28],Cs值越小,表示模拟的洪峰越大,洪峰出现时间越短,洪水过程曲线则越消瘦。根据参数对比结果,息县流域Cs=0.4,参数值较小,分析得到息县流域地势平坦,符合湿润地区洪水陡涨陡落的特点;王家坝流域地处黄淮海冲积平原,与洱海流域的Cs值均较大,可见,流域内洪水量少,洪水涨落不明显,洪水坦化程度较大。
(4) 参数Sm在新安江模型中反映为对次洪模拟的影响,一般情况下,Sm值越大,则产生的洪量越小。根据参数对比结果可知,王家坝流域Sm=5.63,当地产生洪量较大;息县流域的值相较于王家坝流域偏大,与当地严重的水土流失相关[40];洱海流域的Sm值最大,可见,高原地区相较于平原地区流域洪量较少,出现洪水爆发情况较少。
4.3 DYRESM与新安江模型应用对比
DYRESM与实测值对比结果显示,相关系数r达到0.97(n=26);新安江模型模拟值与实测值之间相关性分析中r为0.92(n=26),与DYRESM模拟值相关系数r达到0.94(n=26),总体模拟效果较好。根据模拟数值与实测值比较结果显示,DYRESM模拟结果相对于新安江模拟结果更为精确。
DYRESM可以精确计算由于降雨而进入湖泊的水量和因蒸发而损失的水量,在出入湖流量模拟中运用较为广泛,然而DYRESM所需数据类型较多;新安江模型准备数据主要包括气象数据与率定期所需入湖流量数据,数据类型相对较为简单,两者在洱海流域模拟效果都较好,相关系数r均大于0.9,在流量数据较难获取的地区,可根据所获取的数据类型选择适用的模型,同时为其他流量数据缺失的高原湖泊出入湖流量反演提供参考。
5 结论
通过运用DYRESM对2000—2020年洱海流域的水量进行反演,得到洱海流域主要支流及总流域的出入湖水量,根据反演水量进行新安江模型的率定与验证,得到以下结论 :
(1) 在逐日入湖水量缺测的情况下,通过构建DYRESM和历史水位变化对洱海流域进行水量计算,最终模拟水位与实测水位拟合较好,RMSE为0.01 m,NSE为0.99,相关系数r为0.99(n=15342),洱海流域多年平均出湖模拟流量值为6.08×10⁸ m³,年均入湖模拟流量值为6.88×10⁸ m³,对比DYRESM逐年出湖、入湖流量模拟值与实测值,r分别达到0.99和0.97,得到的出入湖流量模拟值较为合理。
(2) 新安江模型在3个流域的运用中,率定期间,弥苴河、波罗江和总流域逐日入湖流量模拟值间NSE均为0.68,WBE分别为4.25%、-4.33%、 -6.76%;验证期间,弥苴河、波罗江以及总流域逐日入湖流量模拟值间NSE分别为0.52、0.51、0.55,WBE分别为-0.36%、-0.31%、5.23%,NSE均小于0.6,WBE的绝对值都不超过10%,可见模型的运用和模拟效果较好。
(3) 新安江模型参数分析结果表明,新安江模型参数在不同流域内取值存在差异性,具有特定物理意义的参数相差较小,差异性较明显的参数与地域相关性较大,主要包括地表径流消退系数Cs和自由水容量Sm,与流域内的降雨条件、蒸散发条件密切相关。
(4) DYRESM、新安江模型与文献中洱海实测逐年入湖流量对比结果表明,DYRESM逐年入湖流量模拟值与实测值间r=0.97;新安江模型逐年入湖流量模拟值与实测值间r=0.92,DYRESM拟合效果较好于新安江模型。
参考文献
云南高原湖泊洱海流域年降水量时空分布特征研究
[J].
Study on spatiotemporal distribution characteristics of annual precipitation of Erhai basin
大尺度水文模型参数不确定性分析的挑战与综合研究框架
[J].
Parameter uncertainty analysis for large scale hydrological model: Challenges and comprehensive study framework
青海北川河流域径流变化的机理研究: 基于模型和统计两种方法
[J].
DOI:10.18306/dlkxjz.2022.02.010
[本文引用: 1]

气候变化和下垫面变化是影响河道径流的两大驱动力,研究两者对径流的影响有利于深入理解流域水文过程,为水资源管理提供科学依据。鉴于利用不同方法获得的结果存在一定程度的差异,有必要使用多种方法进行交叉验证。论文基于Budyko水量平衡法和新增水库模块的分布式水文模型(DHSVM)法量化了气候变化和下垫面变化对青海省北川河流域径流变化的贡献。结果表明:① 自1960年以来流域出口流量以每年0.037 m<sup>3</sup>/s的趋势下降,突变年份发生在1969年。② 2种方法的分析结果均表明,年代际尺度上,气候变化对径流影响的贡献率由高到低依次为:1990—1999年>2000—2009年>1970—1979年>1980—1989年=2010—2019年,且下垫面变化是1970—2019年流域出口径流变化的主导因素,对应的贡献率分别为94.58% (Budyko法)和65.68% (DHSVM法)。③ Budyko方法只能揭示流域整体的变化,而DHSVM方法能够体现水文过程变化的时空差异,模型结果表明上中游、下游地区的年平均径流变化分别受气候变化、下垫面变化主导;流域出口处月径流变化则对下垫面条件中的水库调节更敏感。此外,文中就2种方法量化结果差异的原因也展开了讨论。
Investigating the mechanisms of streamflow change in the Beichuan River Basin, Qinghai Province: Based on modeling and statistic analyses
DOI:10.18306/dlkxjz.2022.02.010
[本文引用: 1]
Climate change and land use/cover change (LUCC) are two major drivers that impact streamflow. Deconvolving the impacts of climate change and LUCC on streamflow will benefit local water resources management. In this study, two methods—the Budyko water balance method and the Distributed-Hydrology-Soil-Vegetation Model (DHSVM) coupled with a new reservoir regulation scheme—were used to deconvolve the impacts of climate change and LUCC on the streamflow in the Beichuan River Basin, Qinghai Province, to reduce uncertainty in the results inherited from the individual methods through cross examination. The study found that: 1) Streamflow at the basin outlet decreased at 0.037 m3/s per year in 1967-2019, and the abrupt change occurred in 1969. 2) Both methods agree that the relative impacts of the decadal climate change during the past five decades were in the order of 1990s > 2000s > 1970s > 1980s = 2010s, and LUCC was the dominant driver for streamflow reduction at the outlet for 1970-2019, with 94.58% and 65.68% contributions for the Budyko method and the DHSVM, respectively. 3) The Budyko method specializes in assessing the change of the entire river basin, while the distributed hydrologic modeling can efficiently describe the spatiotemporal heterogeneity of the impacts across the basin. The modeling showed that streamflow changes in the upstream and midstream was dominated by climate change, but downstream flow change was controlled by LUCC. Reservoir regulation exerted important impact on monthly streamflow. The possible reasons of the discrepancies in climate change and LUCC impacts estimated by the two methods were also discussed.
流域水文模型的发展
[J].
Development of watershed hydrologic models
新安江模型的起源及对其进一步发展的建议
[J].
Origin of Xin'anjiang Model and its further development
新安江模型在涢水流域的适用性研究
[J].
Research on the applicability of Xin'anjiang Model in Yanshui Basin
新安江模型在乌鲁木齐河径流模拟中的运用
[J].
Application of Xin'anjiang Model in runoff simulation of Urumqi River
Relevance of inflows on the thermodynamic structure and on the modeling of a deep subalpine lake (Lake Maggiore, Northern Italy / southern Switzerland)
[J].DOI:10.1016/j.limno.2017.01.006 URL [本文引用: 2]
On the successful use of a simplified model to simulate the succession of toxic cyanobacteria in a hypereutrophic reservoir with a highly fluctuating water level
[J].DOI:10.1007/s11356-017-9723-9 URL [本文引用: 3]
Estimations of water volume and external loading based on DYRESM hydrodynamic model at Lake Dianchi
[J].There are many rivers flowing from complex paths into Lake Dianchi. At present, there is a lack of inflow and water quality monitoring data for some rivers, resulting in limited accuracy of statistical results regarding water volume and external loading estimations. In this study, we used DYRESM to estimate the water volume entering Waihai of Lake Dianchi from 2007 to 2019 without historical hydrological observation data. Then, we combined this information with the monthly monitoring data of water quality to calculate the annual external loading. Our results showed that: (1) DYRESM could effectively capture the extreme changes of water level at Waihai, showing its reliable applicability to Lake Dianchi. (2) The average annual inflow of rivers entering Waihai was about 6.69 × 10⁸ m3. The fitting relationship between river inflow and precipitation was significant on annual scale (r = 0.74), with a higher inner-annual fitting coefficient between them (r = 0.98), thus suggesting that precipitation and its caused river inflows are the main water source for Waihai. (3) From 2007 to 2010, the river loadings remained at a high level. They decreased to 2445.44 t (total nitrogen, TN) and 106.53 t (total phosphorus, TP) due to a followed drought in 2011. (4) The river loading had annual variation characteristics. The contribution rates of TN and TP loading in the rainy season were 63% and 67% respectively. (5) Panlong River, Daqing River, Jinjia River, Xinbaoxiang River, Cailian River and Hai River were the main inflow rivers. Their loadings accounted for 81.3% (TN) and 80.3% (TP) of the total inputs. (6) River loadings have gradually reduced and the water quality of Waihai has continually improved. However, Pearson analysis results showed that the water quality parameters were not significantly correlated with their corresponding external loading at Waihai, indicating that there might be other factors influencing the water quality. (7) The contribution rates of internal release to the total loads of TN and TP at Waihai were estimated to be 7.6% and 8.9% respectively, suggesting that the reductions of both external and internal loading should be considered in order to significantly improve the water quality at Waihai of Lake Dianchi.
Assessing the Influence of compounding factors to the water level variation of Erhai Lake
[J].Climate change and human activities cause lake water level (WL) fluctuations to exceed natural thresholds, with implications for the available water resources. Studies that explore WL change trends and the main driving forces that affect water level changes are essential for future lake water resource planning. This study uses the Mann–Kendall trend test method to explore the WL fluctuations trend and WL mutation in Erhai Lake (EL) during 1990–2019 and explore the main driving factors affecting water level changes, such as characteristic WL adjustments. We also use the principal component analysis to quantify the contribution of compound influencing factors to the water level change in different periods. The results showed that the WL rose at a rate of 47 mm/a during 1990–2019 but was influenced by the characteristic WL adjustment of EL in 2004 and the WL mutation in 2005. In 1990–2004, the WL showed a downtrend caused by the increase in water resource development and utilization intensity, and in 2005–2019, the WL showed an uptrend caused by the combined decrease in evaporation, outflow, and the increase in water supply for water conservancy projects. Additionally, the largest contributions of outflow to WL change were 19.34% and 21.61% in 1990–2019 and 1990–2004, respectively, while the largest contribution of cultivated area to WL change was 20.48% in 2005–2019, and it is worth noting that the largest contribution of climate change to WL change was 40.35% in 2013–2019. In the future, under the increase in outflow and evaporation and the interception of inflow, the WL will decline (Hurst exponent = 0.048). Therefore, planning for the protection and management of lakes should consider the impact of human activities, while also paying attention to the influence of climate change.
云南洱海水资源监测及分析评价
[J].
Monitoring and analysis of water resources in Lake Erhai
洱海流域水资源供需平衡预测分析
[C]//
Analysis of water resources supply and balance in future forcast. Yunnan Hydraulic engineering society
Application of the DYRESM-CAEDYM model to the Sau Reservoir situated in Catalonia, Spain
[J].DOI:10.1080/19443994.2015.1053530 URL [本文引用: 1]
Simulating the thermal dynamics of Lake Kinneret
[J].DOI:10.1016/S0304-3800(02)00380-0 URL [本文引用: 1]
抚仙湖历史水位反演与未来30年水位变化预测
[J].
Water level retrieval for the past and prediction for the next 30 years at Lake Fuxian
DOI:10.18307/2022.0320 URL [本文引用: 4]
基于DRYESM模型的红枫水库水体热分层特征及关键控制因素模拟研究
[J].
A numerical simulation study using the DRYESM Model on the thermal stratification and its controlling factors in the Hongfeng Reservoir
A preliminary numerical simulation of the thermodynamic conditions of Lugu Lake in recent years
An introduction to boundary layer meteorology
[M].
Modeling climate change impacts on the thermal dynamics of polymictic Oneida Lake, New York, United States
[J].DOI:10.1016/j.ecolmodel.2014.12.018 URL [本文引用: 3]
Estimation of total cloud cover from solar radiation observations at Lake Rotorua, New Zealand
[J].DOI:10.1016/j.solener.2010.01.012 URL [本文引用: 1]
Modeling the diurnal mixed layer
[J].DOI:10.4319/lo.1986.31.3.0533 URL [本文引用: 2]
Simulating water temperatures and stratification of a pre-alpine lake with a hydrodynamic model: Calibration and sensitivity analysis of climatic input parameters
[J].DOI:10.1002/hyp.v28.3 URL [本文引用: 6]
Study on water balance process of Guanting reservoir under variable conditions
[J].
新安江模型参数的分析
[J].
Analysis of Xin'anjiang Model parameters
The Xin'anjiang Model applied in China
[J].DOI:10.1016/0022-1694(92)90096-E URL [本文引用: 1]
基于新安江模型和 BP 神经网络的中小河流洪水模拟研究
[J].为探讨更加符合中小河流域防洪要求的预报方法,并提高洪水预报精度,以屯溪流域为例,结合中小河流实际洪水预报要求,采用以洪峰合格率和峰现时间合格率为主要约束的非等权重的参数率定方法(即目标函数中径流深、洪峰流量、峰现时间合格率和确定性系数的权重分别为(1∶2∶2∶1)对新安江模型进行参数率定,并采用算术平均法耦合新安江模型和BP神经网络模型计算结果,以期提高洪水预报精度。结果表明:以洪峰合格率和峰现时间合格率为主要约束的率定方法的新安江模型是可行的,相对于传统等权重的率定方法,在洪峰和峰现时间预报方面更具优势,符合中小河流防洪要求;新安江模型对洪峰和峰现时间模拟较好,BP神经网络模型对洪峰和径流深的模拟表现较好,采用算数平均法耦合两者的模拟结果,可以提高洪水预报精度。
Research on the flood simulation of medium and small rivers based on Xin'anjiang Model and BP neural network
基于栅格新安江模型的秦淮河流域洪水模拟及实时校正研究
[J].
Study on flood simulation and its real-time correction of Qinhuai River Basin based on grid-Xin'anjiang Model
新安江模型和人工神经网络的耦合应用
[J].
Application of Xin'anjiang Model coupling with artificial neural networks
分布式水文模型软件系统研究综述
[J].
DOI:10.11820/dlkxjz.2014.08.009
[本文引用: 2]
分布式水文模型软件系统作为分布式水文模型的技术外壳,是模型应用的重要技术保障。当前分布式水文模型应用呈现出多过程综合模拟、用户群范围广和计算量大的特点,对分布式水文模型软件系统的灵活性、易用性和高效性提出了更高的要求。本文首先分析了分布式水文模型应用的主要流程,之后从应用视角对现有分布式水文模型软件系统的特点进行了归纳,主要结论为:①软件系统按照模型结构灵活性的高低分为以下3种类型:不支持子过程选择和算法设置,不支持子过程选择、但支持算法设置,同时支持子过程选择和算法设置;②根据用户操作数据预处理软件方式的不同,参数提取方式分为菜单/命令行式和向导式;③按照模型的程序实现方法分为串行和并行方式,按照模型运行环境分为本地和网络模式。现有软件系统在灵活性、易用性和高效性方面存在如下问题:一是尚未解决模型结构灵活性和对用户知识依赖性之间的矛盾;二是现有菜单/命令行式和向导式的参数提取方式步骤繁琐,难以实现参数的自动提取;三是模型大多为串行方式和本地模式,容易遇到计算瓶颈问题。最后从模块化、智能化、网络化及移动化、并行化和虚拟仿真等方面探讨了分布式水文模型软件系统的发展趋势和研究方向。
Review on distributed hydrological modelling software systems
DOI:10.11820/dlkxjz.2014.08.009
[本文引用: 2]
Distributed hydrological modelling software systems are crucial because they provide technical support to the application of distributed hydrological models. Currently, applications of distributed hydrological models have exhibited new characteristics including multi-process synthesis simulation, a wide range of users, and intensive computation. Because of these new characteristics, the existing software systems are facing great challenges with respect to flexibility, usability, and efficiency. This paper reviews existing software systems for distributed hydrological models. Firstly, we analyzed the distributed hydrological modelling applications workflow including model structure determination, parameter extraction, model running, and calibration. The characteristics of existing software systems are discussed: (1) model structure flexibility of the existing software systems is divided into three types: no support of process and algorithm selection, only support of algorithm selection, and support of both process and algorithm selection; (2) parameter extraction methods of the existing software systems are divided into menu/command line and wizard method; (3) computing forms of the existing software systems are divided into parallel computing and serial computing; (4) computing modes of the existing software systems are divided into stand-alone and network mode. Secondly, we summarized the limitations of existing software systems with respect to their flexibility, usability, and efficiency. The limitations include the following: (1) contradiction between model structure flexibility and user knowledge dependence-the more flexible the model structure is, the more knowledge users need to have; (2) the existing methods of parameter extraction are too fussy for non-expert users; (3) the serial and stand-alone softwares usually encounter computing bottleneck as the appliaction scenario is data and/or computing intensive. In the last part of this paper, the emerging trends of distributed hydrological modelling software systems are discussed. These include (1) Modular modelling. The modular development ensures software reuse, but it is not enough when scale or semantic is unmatched, so the ontology knowledge needs to be considered; (2) Intelligent modelling. Using expert knowledge to realize model structure determination and parameter extraction and combining expert knowledge and optimization algorithm to parameter calibration is needed in future work; (3) On-line modelling. The development of cloud computing and network techniques makes on-line modelling practical. In addition, mobile terminals with powerful computing and storage capacity could be potential application platforms. This means that special user interface and data format are needed; (4) Parallel computing. Taking full advantage of new parallel programming standards (CUDA, OpenCL) and exploring the finer granularity parallelizability is an emerging trend. In addition, virtual simulation is another important trend.
新安江对千岛湖外源输入总量的贡献分析(2006—2016年)
[J].
Estimation of external nutrient loadings from the main tributary (Xin'anjiang) into Lake Qiandao, 2006-2016
DOI:10.18307/2019.0621 URL [本文引用: 1]
Assessing the uncertainty of the Xinan'jiang rainfall-runoff model: Effect of the likelihood function choice on the GLUE Method
[J].
隽水河上游降雨径流演变特性分析
[J].为研究实测气象水文序列和及其模拟序列演变特性的变化规律和相关性,研究基于隽水河上游流域通城水文站及气象站日尺度气象水文资料,首先使用线性回归法、五年滑动平均法、Pettitt检验法、M-K检验法和小波分析法对流域降雨量及径流深序列变化趋势、突变特性及周期等演变特性进行研究,再通过三水源新安江模型对该流域径流过程进行模拟,比较不同时段下模拟日径流与实测降雨、径流的相似性,最终分析水文模拟对流域降雨径流演变特征的还原程度和相关性。结果表明:隽水河上游降雨及径流总体呈波动上升趋势,并发生了数次趋势波动;降雨和径流演化过程中均存在12~32 a、8~11 a以及3~7 a的3类尺度的周期变化规律;降雨径流相关性良好,是水文模型可以精确模拟的基础。通城站日降雨径流模拟精度较高,且模拟系列演变特性和气象与水文序列相比在20世纪具有较好的相关性,但在21世纪产生了较大差异。水文模拟精度虽高,但其模拟序列特性与降雨更加相似,其更多反映降雨而非径流的特性变化。研究说明隽水河上游流域气象要素是径流的主要影响因素,而水文模拟虽难以准确展现径流的演变特性,但仍可为该流域未来长期水资源演变分析以及对应调配、防洪排涝工程建设等提供依据和支撑。
Analysis of rainfall and runoff evolution characteristics in the upper reaches of Junshui River
In order to study whether the observed and simulated meteorological and hydrological series have obvious similarity and evolution characteristics in history, based on the daily-scale meteorological and hydrological data of Tongcheng hydrological station and meteorological station. linear regression method, sliding 5-year average method, Pettitt test, M-K test and wavelet analysis were used to study the variation trend, abrupt change and period of precipitation and runoff depth series in the upper Junshui River basin. Then, the Xinanjiang model was used to simulate the runoff process, and the similarity between simulated daily runoff and measured rainfall and runoff in different periods was compared, so as to evaluate the reduction degree of hydrological simulation on the evolution characteristics. The results show that the rainfall and runoff in the upper reaches of Junshui River showed an upward trend and several trend fluctuations occurred. In the process of rainfall and runoff evolution, there are three kinds of periodic changes of 12~32, 8~11 and 3~7 years. High accuracy of Tongcheng station was shown. The daily rainfall and runoff series evolution characteristics of Tongcheng station have a good correlation in the 20th century, but have a great difference in the 21st century. And the hydrological simulation accuracy is high, but the characteristics are more similar to rainfall than the observed runoff. Even if evaporation or human activities disturb the hydrological simulation, the hydrological simulation reflects the characteristics of rainfall rather than runoff. Meteorological factors are the main influencing factors of runoff in the upper reaches of Junshui River basin, but the influence of human activities is gradually increasing. Although it is difficult to accurately show the evolution characteristics of runoff, hydrological simulation can still provide basis and support for long-term evolution analysis of water resources, corresponding allocation, flood control and drainage engineering construction in the basin in the future.
洱海流域水资源量变化趋势分析
[J].
Analysis of the change trend of water resources in Erhai Basin
洱海流域水环境问题诊断与水质保护措施研究
[J].
Study on diagnosis of water environmental problems and water quality protection countermeasures in Erhai Lake Basin
水文巡测方法与水量平衡计算洱海水资源量对比分析
[J].
An comparative analysis of the water resource amount of Lake Erhai based on hydrometric gauging method and water balance calculation
洪水概率预报评价指标研究
[J].
Research on assessment criteria in probabilistic flood forecasting
DOI:10.18307/2020.0222 URL [本文引用: 2]
淮河上游产沙模拟研究
[J].
Simulation of sediment yield in upper reaches of Huaihe River
水文模型参数敏感性分析—优化—区域化方法研究进展
[J].
DOI:10.18306/dlkxjz.2022.07.016
[本文引用: 1]
水文模型是认识水文科学规律、分析水文过程及研究水文循环机理的重要科学工具。水文模型模拟结果的不确定分析是提高模型可靠性、进行有效水情预报的一个重要研究内容。参数不确定性是影响水文模型模拟结果不确定性的关键因素之一,开展模型参数不确定性及其影响因素分析对水文预报具有重要现实意义。目前的参数不确定性分析方法大致可分为3类:参数敏感性分析、参数优化以及考虑无资料流域参数值估计的参数区域化方法。论文归纳总结了近年来国内外水文模型参数不确定性分析工作的主要研究进展,分析了不同方法的优点与不足,提出了未来水文模型不确定性分析方法研究的潜在发展方向。借助多学科理论和技术方法,加强水文模型不确定性分析系统性方法的研究,是水文学科当前的迫切需求及发展趋势。
Progress in parameter sensitivity analysis-optimization-regionalization methods for hydrological models
DOI:10.18306/dlkxjz.2022.07.016
[本文引用: 1]
Hydrological models are an important scientific tool for understanding the basic theory of hydrology disciplines, analyzing hydrological processes, and studying hydrological cycle mechanisms. The uncertainty analysis of simulation results is a prerequisite for improving the reliability of a model and for conducting an effective hydrological regime forecast. Parameter uncertainty is one of the important factors that affect the uncertainty of simulation results from hydrological models, and the analysis of model parameter uncertainty and its impact factors has important practical significance for hydrological forecasting. The current parameter uncertainty analysis methods can be roughly divided into three categories: parameter sensitivity analysis, parameter optimization, and parameter regionalization method that consider the parameter estimation in ungauged catchments. This?article reviewed the current development of technique and operation status of parameter sensitivity analysis for hydrological models, as well as the advantages and disadvantages of different analysis methods. We also identified the potential development direction of future research on the method of uncertainty analysis of hydrological models, that is, to strengthen the study of the systematic method of uncertainty analysis for hydrological models with the help of multidisciplinary theories and technical methods.
半湿润流域水文模型比较与集合预报
[J].
Hydrological models comparison and ensemble forecasting in semi-humid watersheds
DOI:10.18307/2017.0621 URL [本文引用: 1]
