

社会经济风险是指暴露于灾害中的人口和GDP的可能损失。不少研究者分析了未来气候情景下暴露于极端降水中的人口和GDP的情况[20⇓⇓⇓⇓-25]。也有少数研究者在全球和区域尺度上对未来社会经济的风险进行了预估。例如:Liu等[13]基于第五次耦合模式比较计划(CMIP5)的5个全球气候模式3种代表性浓度路径(RCP)以及共享社会经济路径中的人口和GDP预估数据,在全球尺度上分析了未来时期(2016—2035年和2046—2065年)相对基准时期(1986—2005年)的暴雨洪涝灾害风险及其变化。黄晓远等[26]基于CMIP6的5个气候模式3种情景(SSP1-2.6、SSP2-4.5、SSP5-8.5)下的降水预估数据,结合地形因子、社会经济数据和耕地面积百分比,对中国西南地区未来时期(2021—2040年和2041—2060年)相对基准时期(1995—2014年)的暴雨洪涝灾害风险及其变化进行了预估。
整体来说,基于CMIP6对于未来社会经济的风险评估还很不足。已有研究往往选用CMIP6中的若干个气候模式的模拟数据,然而来自不同国家和地区的模型之间差异较大,选取若干个的气候模式可能存在较大的不确定性,利用所有可用的模式模拟的降水数据进行评估可以减少评价结果不确定性。此外,已有研究更多关注的是暴雨风险中致灾因子即暴雨强度、历时、频率等特征的变化,对于暴雨风险的评估工作较少,特别是在全球尺度开展的暴雨风险更少,且没有对不同重现期下的全球暴雨社会经济风险的对比评估。同时考虑CMIP6是未来气候变化预估的最新版本,与CMIP5相比,实验设计更为完善,模型质量有了很大改进[27⇓-29],具有更好的分辨率。为此,本文基于ERA5全球历史降水数据和CMIP6中SSP2-4.5情景24个模式2030—2099年逐日降水模拟数据,结合历史和未来人口和GDP数据,在全球尺度上评估历史和未来4个不同重现期(5年、10年、20年和50年一遇)下极端降水的社会经济风险及其相对于历史风险的变化,对比分析不同重现期、不同区域的社会经济风险,找出社会经济风险变化显著的10个国家,并分析影响其风险变化的主要因子,从而为受极端降水影响区域的灾害风险研究提供借鉴和参考。
1 数据和方法
1.1 数据来源
本文所用的数据包括ERA5再分析数据、CMIP6未来气候情景数据、人口和GDP数据。ERA5是欧洲中期天气预报中心(ECWMF)推出的第五代再分析产品,提供了1950年以来大气、海洋和陆地表面的详细气候变量[30-31]。本文所用的是1979—2015年间ERA5的小时降水数据合成的日降水数据,空间分辨率为0.25°。CMIP6是世界气候研究计划(WCRP)发起的最新的国际耦合模式比较计划。本文采用CMIP6中接近于目前社会发展状况的中度发展和中度排放情景(SSP2-4.5)下的来自不同国家和地区的24个模式(表1)模拟的2030—2099年未来降水数据,其时间分辨率为1 d。人口和GDP数据来自日本国立环境研究所,SSP2路径下每10年的预测数据[32],空间分辨率为0.5°。
表1 研究所使用的CMIP6模型信息
Tab.1
| 模型 | 国家 | 分辨率 (经纬向格点数) | 一年中 天数/d |
|---|---|---|---|
| ACCESS-CM2 | 澳大利亚 | 192×144 | 365/366 |
| ACCESS-ESM1-5 | 澳大利亚 | 192×145 | 365/366 |
| BCC-CSM2-MR | 中国 | 320×160 | 365 |
| CanESM5 | 加拿大 | 128×64 | 365 |
| CESM2-WACCM | 美国 | 288×192 | 365 |
| CMCC-CM2-SR5 | 意大利 | 288×192 | 365 |
| CMCC-ESM2 | 意大利 | 288×192 | 365 |
| EC-Earth3-Veg | 10个欧洲国家 | 512×256 | 365/366 |
| EC-Earth3-Veg-LR | 10个欧洲国家 | 320×160 | 365/366 |
| GFDL-ESM4 | 美国 | 288×180 | 365 |
| IITM-ESM | 印度 | 192×94 | 365/366 |
| INM-CM4-8 | 俄罗斯 | 180×120 | 365 |
| INM-CM5-0 | 俄罗斯 | 180×120 | 365 |
| IPSL-CM6A-LR | 法国 | 144×143 | 365/366 |
| KACE-1-0-G | 韩国 | 192×144 | 360 |
| KIOST-ESM | 韩国 | 192×96 | 365 |
| MIROC6 | 日本 | 256×128 | 365/366 |
| MPI-ESM1-2-HR | 德国 | 384×192 | 365/366 |
| MPI-ESM1-2-LR | 德国 | 192×96 | 365/366 |
| MRI-ESM2-0 | 日本 | 320×160 | 365/366 |
| NESM3 | 中国 | 192×96 | 365/366 |
| NorESM2-LM | 挪威 | 144×96 | 365 |
| NorESM2-MM | 挪威 | 288×192 | 365 |
| TaiESM1 | 中国 | 288×192 | 365 |
1.2 研究方法
1.2.1 暴雨强度计算
世界气象组织将降水分为6个等级,其中日降水量大于50 mm被称为暴雨[33],因此,本文采用50 mm作为阈值来判定是否有暴雨发生,统计每年发生暴雨的日数,进而计算年暴雨日的平均降雨量,即年暴雨强度。具体来说,本文首先根据ERA5的日降水数据计算1979—2015年间的年暴雨强度序列,根据CMIP6中24个模式的日降水预估数据计算2030—2099年间的24个模式各自的年暴雨强度序列。然后,通过核密度函数分别得到历史基准期和未来24个模式在5年、10年、20年、50年4个重现期下的暴雨强度的数值[34-35]。核密度估计是一种用于估计概率密度函数的非参数方法,它不利用数据分布的先验知识,直接从数据样本本身出发研究数据的分布特征,其公式如下所示:
式中:
将历史和未来所有模型的4个重现期(5年、10年、20年、50年一遇)的年暴雨强度利用双线性插值法重采样到0.5°;对于未来数据,每个重现期的暴雨强度均取24个模型均值[36]。这里要说明的一点是:计算过程中对于不同重现期下计算得到的年暴雨强度小于50 mm/d的栅格,由于没有达到暴雨发生条件,将其栅格赋值为零。
1.2.2 社会经济风险评估
风险是指当有价值的东西处于危险之中而结果不确定时的潜在后果[16]。社会经济风险是指暴露于灾害中的人口和GDP的可能损失。为此,本文定义式(3)来计算人口和GDP在不同重现期暴雨灾害中的风险:
式中:Risk为暴雨所造成的社会经济风险;rintensity为标准化后的暴雨强度,首先计算历史和未来所有重现期下年暴雨强度的最大值和最小值,然后对所有的暴雨强度数据利用最大—最小值标准化处理法进行标准化处理,得到数值在0~1之间;spop、sgdp分别为标准化后的人口和GDP。历史时段的人口和GDP数据采用1980—2010年均值,未来时段则采用2030—2100年均值。类似暴雨强度标准化的方式,根据人口和GDP在历史和未来的最大、最小值,将人口和GDP数据标准化到0~1之间。
1.2.3 社会经济风险的变化评估与分析
每个重现期中暴雨的社会经济风险变化由该重现期中未来的社会经济风险减去历史的社会经济风险得到。进而通过每个重现期的差值与同一重现期历史风险数据的比值得到未来社会经济风险相对于历史社会经济风险的变化比例。通过固定值断点将4个重现期的风险变化比例分为6个等级:<0、[120%]和>120%。对于每一个重现期重复以下操作:统计每个国家每个级别的栅格数,提取每个级别栅格数排序前10的国家。进而在4个重现期提取的所有国家中得到出现频次最高的前10个国家,作为未来暴雨灾害社会经济风险变化的主要研究区域。对于筛选出的10个国家,以同样做差的方式计算4个重现期(5年、10年、20年、50年一遇)年暴雨强度、人口和GDP的变化值,进而使用地理探测器[37]计算不同重现期的人口、GDP以及年暴雨强度变化对风险变化的解释能力,以此来衡量引起风险变化的主要因子。地理探测器是一种检测空间异质性、探索空间异质性背后的决定因素的统计工具[37],它被广泛应用于洪涝灾害和地物空间分布格局演变等的驱动要素的研究中[38⇓-40]。在因子检测器中,q值用来衡量变量Y的空间异质性,以及因子X对变量Y的空间异质性的解释程度,q值越大,说明解释能力越强。q值的计算公式如下所示[37]:
式中:
2 结果分析
2.1 不同重现期下未来暴雨强度分析
图1为未来情景和历史时期年暴雨强度分布图。在5年、10年、20年、50年一遇下,全球未来年暴雨强度的均值依次为67.48、76.96、86.78、96.47 mm.d-1,全球历史年暴雨强度均值依次为76.92、89.92、102.83、120.78 mm.d-1。可见,在未来情景和历史时期随着重现期的增加,暴雨的范围扩张,强度增大。在各重现期下均有暴雨发生的区域主要集中在热带雨林气候区、热带季风气候区、亚热带季风区、亚热带润湿气候区、温带季风气候区。
图1
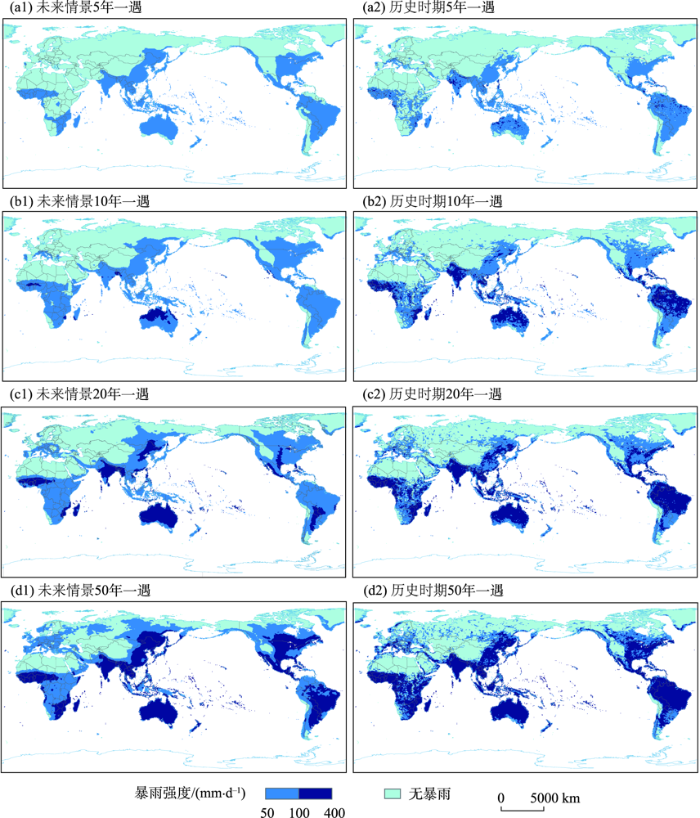
图1
未来情景(a1、b1、c1、d1)和历史时期(a2、b2、c2、d2)中4个重现期的全球年暴雨强度分布
注:本图基于自然资源部标准地图服务网站下载的审图号为GS(2016)1667号的标准地图制作,底图边界无修改。下同。
Fig.1
Global annual rainstorm intensity distribution at four return periods under future scenarios (a1, b1, c1, d1) and in history (a2, b2, c2, d2)
图2是未来情景中6个大洲的暴雨强度统计雷达图,图中统计了各重现期下年暴雨强度在6个大洲的极差(最大值-最小值)、均值及标准差。随着重现期的增加,6个大洲年暴雨强度的极差、均值、标准差都在增大。从极差来看,5年一遇和10年一遇的重现期下,大洋洲的极差最大,分别为43.97、64.54 mm.d-1;非洲次之;欧洲最小,分别为4.84、23.95 mm.d-1。20年一遇和50年一遇的重现期下,非洲的极差最大,分别为85.74、113.04 mm.d-1;北美洲次之;欧洲最小,分别为40.53、59.29 mm.d-1。从均值来看,大洋洲年暴雨强度的均值最大,范围是71.72~136.43 mm.d-1;南美洲次之;欧洲最小,范围为52.46~63.76 mm.d-1。从标准差来看,5年和10年一遇的重现期中非洲的标准差最大,分别为10.38和14.77 mm.d-1;20年和50年一遇的重现期中亚洲的标准差最大,分别为18.28、26.00 mm.d-1;4个重现期中欧洲的标准差最小,介于1.52~12.90 mm.d-1。
图2
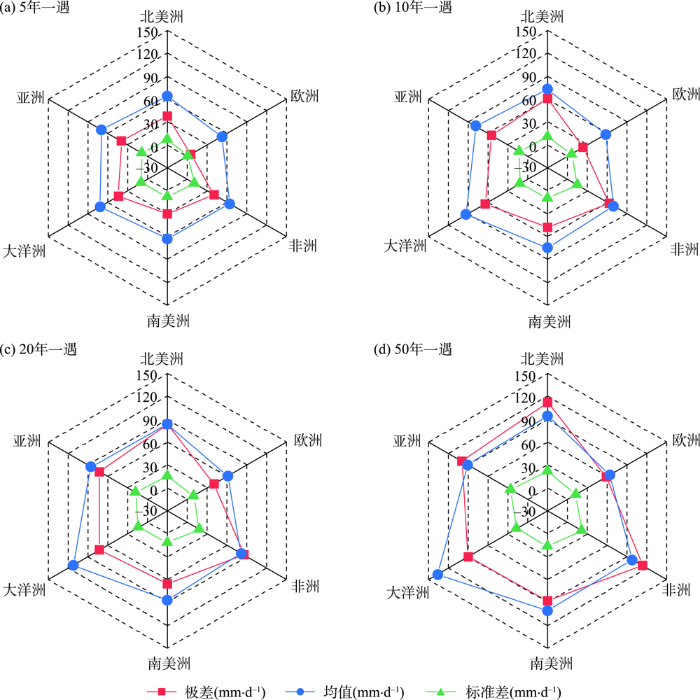
图2
未来情景中6个大洲的年暴雨强度统计
Fig.2
Statistical charts of annual rainstorm intensity on six continents under future scenarios
2.2 不同重现期下未来情景的暴雨社会经济风险分析
图3显示了未来全球人口和GDP均值的分布。人口和GDP分布具有很大的相关性,相关系数达到0.86,二者均呈现出在沿海、低海拔和低纬度地区分布密集,在沙漠、高海拔和高纬度地区分布稀疏的趋势。具体来说,人口和GDP暴露较大的地区集中分布在亚洲东部、南部和东南部,非洲西部和东部,北美洲的中部和南部,南美洲西北部和东部,欧洲的中部和南部,大洋洲的东部沿海等地区。在亚洲中部和北部、非洲北部沙漠地区、北美洲的北部、格陵兰岛、南美洲中部以及大洋洲的西部和中部等地区,人口和GDP暴露极低。
图3
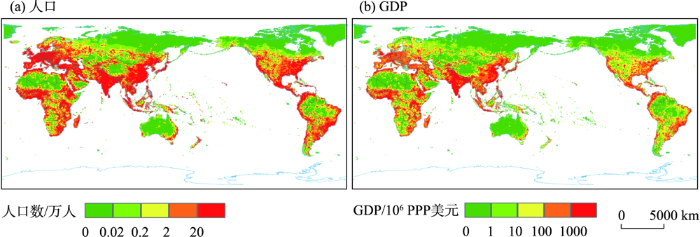
图3
未来情景中的全球(a)人口和(b)GDP分布
注:PPP指购买力平价(purchasing power parity)。
Fig.3
Global (a) population and (b) GDP distribution under future scenarios
图4是未来情景4个重现期的全球暴雨社会经济风险分级分布图。第一等级(G1)表示暴雨风险最小,第五等级(G5)表示暴雨风险最大。图中显示4个重现期的风险分布差异不大,风险级别最高的区域集中分布在亚洲的东部和南部,以及非洲的中北部和东南部;中等风险主要分布在北美洲的西部沿海、南部、东南部,南美洲的西北部和东部,欧洲南部,以及大洋洲的东部沿海区域;最低风险区所占比例最大,栅格数占全球的比例在76.43%~84.39%之间。
图4
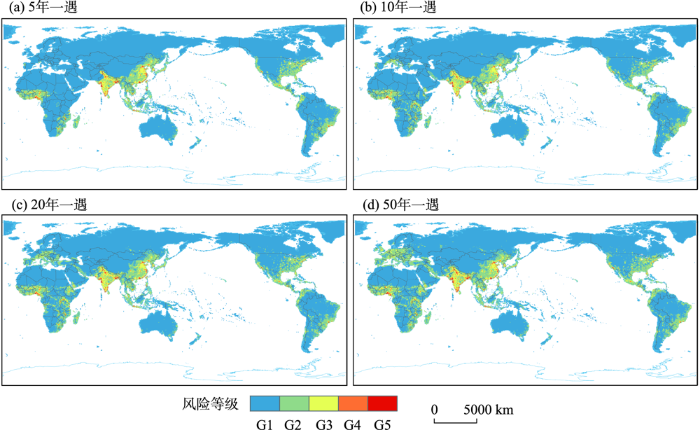
图4
未来情景4个重现期的全球暴雨社会经济风险等级
Fig.4
Global rainstorm socioeconomic risk levels at four return periods under future scenarios
图5是未来情景中4个重现期下5个等级的社会经济风险在6个大洲的栅格数比例统计图。在4个重现期中,第一等级的风险在各洲的比例均远大于其他等级,比例均在70%以上。北美洲和大洋洲在不同重现期下各风险等级的变化不大,第一等级的风险占比分别在84.71%~87.11%和91.72%~93.15%之间,其他4个等级的风险占比变化更小,大洋洲在4个重现期均不会出现第五等级的风险;而欧洲和非洲在不同重现期下各风险等级的变化比较大,随着重现期的增长,2个大洲第一等级的风险占比分别从99.46%和82.19%降到70.77%和68.18%,第二等级的风险占比分别从0.47%和14.31%增长到25.64%和25.92%,其他3个等级的风险占比小幅增加或不变。
图5
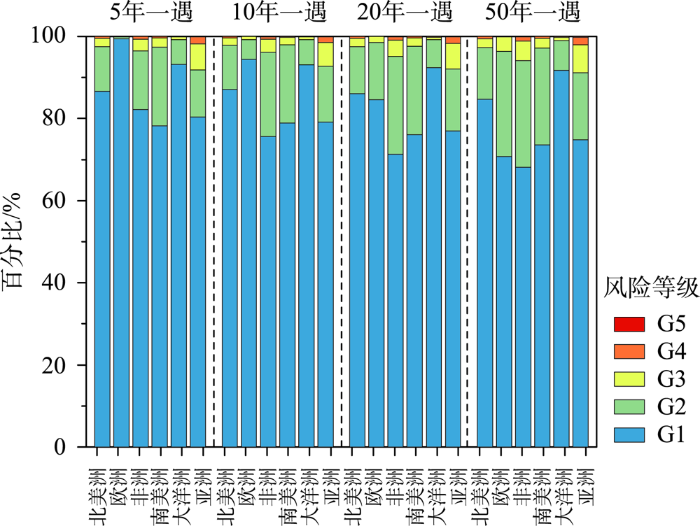
图5
未来情景4个重现期社会经济风险等级在6个大洲的比例统计
Fig.5
Proportional statistical charts of socioeconomic risk levels on six continents at four return periods under future scenarios
2.3 不同重现期下未来情景的暴雨社会经济风险变化分析
图6是4个重现期全球暴雨社会经济风险变化等级图。风险变化增加最明显的区域集中分布在亚洲的南部和东部沿海地区,非洲的中北部和东南部,北美洲的东部、西部和南部的沿海地区,主要包括印度、中国、美国、墨西哥、尼日利亚等国家。风险变化减少最明显的区域主要分布在欧洲中部和南部、非洲西北部、南美洲的北部等地区。
图6
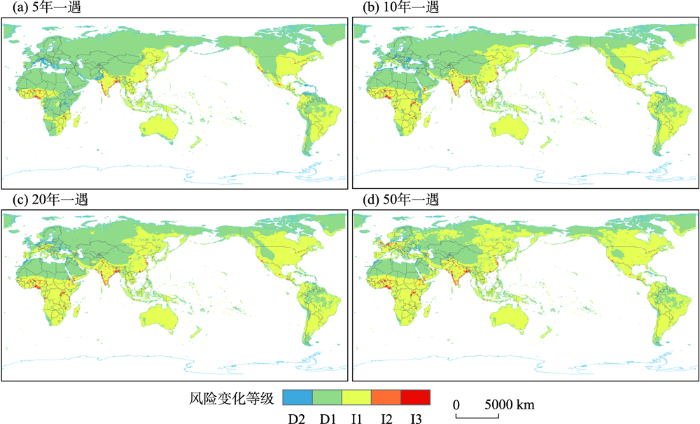
图6
未来情景4个重现期全球暴雨社会经济风险变化等级
注:D表示风险减少,D2减少幅度比D1大;I表示风险增加,I3增加幅度高于I2,I2高于I1。
Fig.6
Global rainstorm socioeconomic risk change scale at four return periods under future scenarios
表2统计了4个重现期下不同全球暴雨社会经济风险变化等级的栅格数占全球陆地栅格总数的比例。在5年一遇和10年一遇下全球暴雨风险减少的栅格数占比更高,分别为68.29%和56.86%。20年一遇下全球暴雨风险减少的栅格数和增加的栅格数基本相当,分别为50.8%和49.2%。50年一遇下全球暴雨风险增加的栅格数占比(57.86%)超过了暴雨风险减少的栅格数占比(42.14%)。随着重现期的增加,风险变化等级为D1的栅格数明显下降,风险变化等级为I1的栅格数占比明显增加。
表2 4个重现期全球暴雨社会经济风险变化等级占比统计
Tab.2
| 风险变化等级 | 5年一遇 | 10年一遇 | 20年一遇 | 50年一遇 |
|---|---|---|---|---|
| D2 | 1.44 | 1.23 | 0.90 | 0.52 |
| D1 | 66.85 | 55.64 | 49.90 | 41.62 |
| I1 | 30.69 | 41.83 | 47.65 | 55.89 |
| I2 | 0.93 | 1.19 | 1.41 | 1.78 |
| I3 | 0.09 | 0.11 | 0.14 | 0.19 |
全球不同地区因为经济发展状况、人口分布、气候条件等存在差异,因此,不同区域暴雨风险变化的主导因素各有不同。以风险变化比例前10的国家(美国、加拿大、俄罗斯、巴西、中国、印度、墨西哥、刚果民主共和国、阿根廷、澳大利亚)为例,计算4个重现期中这10个国家的人口、GDP及对应年暴雨强度变化对风险变化的解释能力,也即相关程度,结果如图7所示。由图可以看出,不同的国家在4个重现期下与风险变化相关程度最大的要素各有不同。除俄罗斯以外的9个国家,未来风险变化均与人口或GDP变化的相关程度最大。俄罗斯的风险变化与暴雨强度变化的相关程度最大,q值在0.14~0.32之间;美国、巴西、印度、墨西哥、刚果民主共和国、阿根廷、澳大利亚7个国家的风险变化与人口变化的相关程度最大,其中美国、巴西、印度和墨西哥在4个重现期中风险变化与人口变化的相关程度均在0.7以上,刚果民主共和国、阿根廷以及澳大利亚3个国家在5年一遇的重现期中人口变化与风险变化的相关程度较低,q值分别为0.37、0.56、0.55;加拿大和中国的风险变化与GDP变化的相关程度最大,4个重现期中加拿大的风险变化与GDP变化的相关程度在0.74~0.89之间,中国的风险变化与GDP变化的相关程度在0.65~0.75之间。
图7
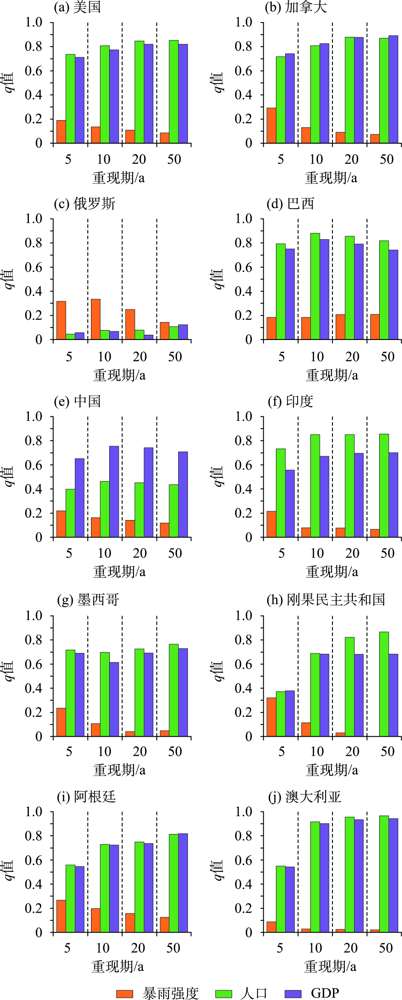
图7
在4个重现期中风险变化显著的10个国家的人口、GDP及对应重现期的年暴雨强度的变化与风险变化的相关程度统计
Fig.7
Statistical charts of the degree of correlation between population, GDP, and annual rainstorm intensity changes and risk changes in 10 countries with significant risk changes at four return periods
3 结论与讨论
3.1 结论
本文基于CMIP6中SSP2-4.5情景多个模式的未来2030—2099年日降水数据和ERA5的1979—2015年历史再分析数据以及历史和未来情景的人口与GDP模拟数据,计算得到了未来全球陆地暴雨灾害的社会经济风险及其相对于历史时期暴雨社会经济风险的变化。主要结论如下:
(1) 未来情景中大洋洲的暴雨强度最大,欧洲最小,且在东亚和南亚的季风区、北美洲的中部和东部及赤道附近的热带雨林气候区暴雨强度最大,在亚欧大陆的中部和北部、非洲北部的沙漠地区、北美洲的中部和北部以及南美洲的西部等高海拔、高纬度和热带沙漠区未来暴雨强度最小。随着重现期的增加,有暴雨发生的区域不断扩大,暴雨的强度也在不断增大。
(2) 4个重现期中第一级风险在全球陆地所占比例最大,第五级风险所占比例最小。随着重现期的增长,第一等级的风险所占比例变化趋势为减少,其他等级的风险所占比例呈现增加的趋势。不同重现期中欧洲和大洋洲的暴雨风险最小,亚洲和非洲的暴雨风险最大。
(3) 风险变化增加最明显的区域集中分布在亚洲的南部和东部沿海地区,非洲的中北部和东南部,以及北美洲的东部、西部和南部的沿海等地区。风险变化减少最明显的区域主要分布在欧洲中部和南部、非洲西北部和东部及南美洲的北部等地区。随着重现期的增长,风险变化表现为增加的栅格占比从31.71%扩大到57.86%。
(4) 不同国家的风险变化与人口、GDP、暴雨强度的变化的相关程度存在差异。风险变化与暴雨强度变化相关性最大的国家是俄罗斯,风险变化与人口变化的相关程度最大的国家有美国、巴西、印度、墨西哥、刚果民主共和国、阿根廷、澳大利亚,加拿大和中国的风险变化与GDP变化的相关程度最大。
3.2 讨论
本文的社会经济风险增加和减少区域的分布与已有研究结果类似[13,21]。对于暴雨社会经济风险变化主导因素的研究结果表明,大部分区域极端降水的社会经济风险变化与社会经济变化的相关程度大于与灾害危险性变化的相关程度,这与Liu等[13]和Chen等[41]的研究结果具有一致性。但具体细节上存在差异,主要原因是上述2个研究和本文研究在分析主导因素时所用的尺度不同。在SSP2-4.5情景中,Liu等[13]从大洲的角度计算,发现欧洲的社会经济风险变化与极端降水变化的相关程度大于与人口变化的相关程度,其他大洲的社会经济风险变化与人口和GDP变化的相关程度均大于与极端降水变化的相关程度;Chen等[41]从地区的角度分析,发现欧洲北部和亚洲北部(包括俄罗斯)的社会经济风险变化与极端降水变化的相关程度大于与人口变化的相关程度,其他地区的社会经济风险变化与人口变化的相关程度均大于与极端降水变化的相关程度。而本文在国家尺度开展分析,发现SSP2-4.5情景中未来俄罗斯社会经济风险变化与暴雨危险性变化的相关程度大于与社会经济变化的相关程度,其他9个国家社会经济风险变化与社会经济变化的相关程度均大于与暴雨危险性变化的相关程度。从防范全球灾害风险的角度来看,在国家尺度以及更小的局部区域分别开展风险主导因素研究更有利于制定防灾政策以及减少社会经济损失。
本文也存在一些不足之处:首先,未来气候变化的不确定性很大,CMIP6对多个社会经济发展路径下的未来降水进行了模拟,本文只选取了中间发展路径SSP2-4.5的降水数据对未来暴雨风险进行预估,有待使用SSP1-2.6、SSP5-8.5等未来不同发展路径的降水模拟数据,得到对未来暴雨风险变化的更为全面的评估。其次,CMIP6模拟数据空间尺度为全球,范围大,空间分辨率低,文中通过双线性方法将所有模式数据分辨率统一到0.5°,对于单个国家来说,分辨率较低,不利于局部地区内部风险异质性分析。再者,暴雨阈值的选择不同,研究的结果不同,本文以日降水大于50 mm为阈值来识别暴雨,未来有必要利用其他阈值选择方法,来进行极端降水风险的预估,以便更好地服务于防灾减灾政策的制定。最后,本文选取了10个风险变化显著的国家分析导致风险变化的主导因素。若使用风险变化均值或者风险变化比例均值,筛选出来的国家中会包括本身面积很小的国家。而栅格数过少会影响后续的统计分析。为此,本文使用风险变化比例分级数据对所有国家进行排序,提取每个级别栅格数排序前10的国家,进而在4个重现期提取的所有国家中筛选得到出现频次最高的前10个国家。然而,这种方法又会使得包含栅格数较多的国家容易被筛选出来。未来可以综合考虑国土面积、风险等级、风险变化大小、统计分析对样本量的要求等因素,来筛选更合理的对象。
参考文献
对IPCC第六次评估报告中有关干旱变化的解读
[J].
A brief interpretation of drought change from IPCC Sixth Assessment Report
气候变化背景下中国陆地水循环时空演变
[J].
Impact of climate change on terrestrial water cycle in China
Climate change in Malaysia: Trends, contributors, impacts, mitigation and adaptations
[J].
DOI:10.1016/j.scitotenv.2018.09.316
[本文引用: 1]

Purpose: This paper reviews the past and future trends of climate change in Malaysia, the major contributors of greenhouse gases and the impacts of climate change to Malaysia. It also reviews the mitigation and adaptations undertaken, and future strategies to manage the impacts of regional climate change. Methodology: The review encompasses historical climate data comprising mean daily temperature, precipitation, mean sea level and occurrences of extreme weather events. Future climate projections have also been reviewed in addition to scholarly papers and news articles related to impacts, contributors, mitigation and adaptations in relation to climate change. Findings: The review shows that annual mean temperature, occurrences of extreme weather events and mean sea level are rising while rainfall shows variability. Future projections point to continuous rise of temperature and mean sea level till the end of the 21st century, highly variable rainfall and increased frequency of extreme weather events. Climate change impacts particularly on agriculture, forestry, biodiversity, water resources, coastal and marine resources, public health and energy. The energy and waste management sectors are the major contributors to climate change. Mitigation of and adaptations to climate change in Malaysia revolve around policy setting, enactment of laws, formulation and implementation of plans and programmes, as well as global and regional collaborations, particularly for energy, water resources, agriculture and biodiversity. There are apparent shortcomings in continuous improvement and monitoring of the programmes as well as enforcement of the relevant laws. Originality/value: This paper presents a comprehensive review of the major themes of climate change in Malaysia and recommends pertinent ways forward to fill the gaps of mitigation and adaptations already implemented. (C) 2018 Elsevier B.V. All rights reserved.
Global observed changes in daily climate extremes of temperature and precipitation
[J].
Future property damage from flooding: Sensitivities to economy and climate change
[J].DOI:10.1007/s10584-015-1478-z URL [本文引用: 1]
Higher hydroclimatic intensity with global warming
[J].
DOI:10.1175/2011JCLI3979.1
URL
[本文引用: 1]
Because of their dependence on water, natural and human systems are highly sensitive to changes in the hydrologic cycle. The authors introduce a new measure of hydroclimatic intensity (HY-INT), which integrates metrics of precipitation intensity and dry spell length, viewing the response of these two metrics to global warming as deeply interconnected. Using a suite of global and regional climate model experiments, it is found that increasing HY-INT is a consistent and ubiquitous signature of twenty-first-century, greenhouse gas–induced global warming. Depending on the region, the increase in HY-INT is due to an increase in precipitation intensity, dry spell length, or both. Late twentieth-century observations also exhibit dominant positive HY-INT trends, providing a hydroclimatic signature of late twentieth-century warming. The authors find that increasing HY-INT is physically consistent with the response of both precipitation intensity and dry spell length to global warming. Precipitation intensity increases because of increased atmospheric water holding capacity. However, increases in mean precipitation are tied to increases in surface evaporation rates, which are lower than for atmospheric moisture. This leads to a reduction in the number of wet days and an increase in dry spell length. This analysis identifies increasing hydroclimatic intensity as a robust integrated response to global warming, implying increasing risks for systems that are sensitive to wet and dry extremes and providing a potential target for detection and attribution of hydroclimatic changes.
Anthropogenic influence on extreme Meiyu rainfall in 2020 and its future risk
[J].DOI:10.1007/s11430-020-9771-8 [本文引用: 1]
极端降水对水稻产量的影响研究综述
[J].
DOI:10.18306/dlkxjz.2021.10.011
[本文引用: 1]
极端降水在全球范围内呈现广泛增强的趋势,对农业生态系统的影响不容忽视。水稻作为重要的粮食作物,其产量的年际波动受到极端降水的影响,然而其响应机理和时空敏感性尚未厘清。论文总结了极端降水在水稻主产区的时空格局及对产量的影响程度,梳理了极端降水对水稻产量的生理、化学和物理过程的影响机制,对比分析了多个主流方法(统计模型和作物过程模型)的输入数据和应用上的优缺点。结果表明,极端降水增加1%导致水稻减产0.02%~0.5%,主要通过增加养分流失和造成淹水胁迫等途径。然而当前研究仍难以明确水稻产量如何响应于极端降水的不同特征值(强度、频次、持续时间等)及其敏感性的时空差异,尚未完善极端降水对水稻各产量组成的影响机理,同时缺乏作物模型与统计模型等相结合的研究方法,造成水稻产量预测的不确定性。建议未来相关研究应加强田间观测、控制性实验与模型改进,定量解析极端降水对产量的影响机理,促进模型—数据融合,提高数据精度以更好地模拟极端降水事件下的水稻产量,为优化当前稻作系统和建立气候智能型农业奠定理论基础。
A review of studies on the impacts of extreme precipitation on rice yields
DOI:10.18306/dlkxjz.2021.10.011
[本文引用: 1]
The increasing trend of extreme precipitation has become stronger globally, and is expected to have detrimental impact on agricultural ecosystems. Rice is one of the staple foods, and the inter-annual fluctuation of rice yield is highly affected by extreme precipitation. However, the mechanisms and spatiotemporal sensitivity of rice yield to extreme precipitation have not been clarified. This review summarized the temporal and spatial patterns of extreme precipitation in the main rice-producing regions of the world and its impact on rice yield, and explored the mechanism of extreme precipitation impact on rice growth and yield from the perspective of physiological, chemical, and physical processes. The input data and advantages and disadvantages in application of the main research methods, including statistical model and crop model, were evaluated and compared. The results indicate that an increase of 1% in extreme precipitation led to a decrease in rice yield by 0.02%-0.5%, mainly through increased nutrient loss and flooding. Yet, large uncertainties still exist in rice yield prediction of current studies, because it is difficult to clarify how rice yield responds to different characteristics (intensity, frequency, and duration) of extreme precipitation and its spatiotemporal sensitivity, and the mechanisms of extreme precipitation affecting rice yield components are not well understood. In addition, lacking the integration of crop models and statistical models also introduces uncertainties. We recommend to promote the integration of multi-methods, especially field observation, controlled experiment, and model improvement, to quantitatively analyze the mechanism of extreme precipitation impact on yield components, and to improve data accuracy to better simulate rice yields under extreme precipitation events in the future. Achieving these progresses will lay a foundation for optimizing the current rice cropping system and agricultural management to mitigate the impact of extreme precipitation.
气候变化背景下中国沿海地区灾害风险研究与应对思考
[J].
DOI:10.18306/dlkxjz.2021.05.013
[本文引用: 1]
沿海地区是城市化水平较高的区域,在全球气候变化背景下,该地区极端天气气候事件频发,灾害风险日益加大,已严重制约了该地区社会经济的可持续发展。论文立足气候变化背景,探讨沿海地区灾害风险变化的新特点,认为:当前极端天气气候灾害的发生仍具较大的不确实性,气候与灾害在时空尺度上呈现多样性变化特征,各气象灾害风险存在较大差异性,灾害系统构成要素也更加复杂。鉴于气候变化给沿海地区灾害风险研究带来新的挑战,文章提出在气候变化背景下,沿海地区灾害风险系统的构建应关注灾害的时空尺度变化、多灾种灾害的协同效应、城市化与气候变化,并构建了基于气候变化背景下的灾害风险系统框架。最后,为提升气候变化背景下我国沿海地区灾害风险应对能力建设,提出以下建议:注重灾害防御系统的多样化、注重灾害防御系统的稳健性、实现多灾种灾害信息的共享、强化承灾主体的自恢复能力、加强灾害风险分担与转移能力建设、逐步适应气候变化背景下的极端天气与自然灾害。
Understanding the climate change and disaster risks in coastal areas of China to develop coping strategies
DOI:10.18306/dlkxjz.2021.05.013
[本文引用: 1]
In the context of global climate change, extreme weather events and the concomitant natural disasters are becoming a primary risk restricting the socioeconomic development in coastal areas that are often highly urbanized. This study sets out to explore the new characteristics of natural hazards and disasters in the coastal areas of China against the backdrop of a changing climate. Major conclusions are as follows. First, the occurrences of extreme weather and climatic events are considerably uncertain. The climate and disasters are different across various temporal and spatial scales, and the components of the disaster risk system become more complicated. Second, in view of the new challenges brought by climate change, we suggest paying close attention to three issues in the future, including the change of temporal and spatial scales that are used to depict the disasters, the synergism of multi-disasters, and the effects of climate change and urbanization. Based on these, a new framework of disaster risk system is established to reflect the qualities of disasters in complex spatiotemporal contexts. Lastly, to develop more effective coping strategies for the climate and natural hazards and disasters in coastal areas, it is necessary to promote diversification of the disaster prevention system and enhance its robustness, and to strengthen the self-recovery capability of the social, economic, and ecological environments. Meanwhile, information sharing in multi-disaster management and risk sharing and transfer policies are also important for accommodating the negative impacts of extreme events and disasters coming with climate change.
Climate change and health in Earth's future
[J].DOI:10.1002/eft2.2014.2.issue-2 URL [本文引用: 1]
A review of global precipitation data sets: Data sources, estimation, and intercomparisons
[J].DOI:10.1002/rog.v56.1 URL [本文引用: 1]
全球气候变化背景下海岸洪水灾害风险评估研究进展与展望
[J].
DOI:10.18306/dlkxjz.2019.05.001
[本文引用: 1]
全球气候变化背景下,海平面上升以及高潮位和风暴潮引起的极值水位导致的海岸洪水对沿海社会经济和自然环境造成巨大影响,已是国内外关注的重点。论文梳理了广义和狭义海岸洪水的定义和要素,重点阐述了狭义海岸洪水的组成部分,从致灾因子、孕灾环境和承灾体以及风险评估方法与模型3个方面,系统总结了相关研究方法与研究成果的主要进展,以及存在的主要问题,并透视了未来拟加强的研究方向。建议加强沿海地区应对全球气候变化风险的研究,包括全球气候变化下多致灾因子耦合危险性和不确定性研究,沿海关键地区和关键暴露(关键基础设施)的风险评估研究,全球气候变化风险适应与减缓性措施的成本效益评价研究,提高沿海地区应对全球气候变化风险的韧性研究,以及建立多学科间的基础数据共享机制,采用交叉学科手段以便更综合、系统、动态研究海岸带问题,保障沿海地区开展全球气候变化下风险评估的需要。
A review of coastal flood risk research under global climate change
DOI:10.18306/dlkxjz.2019.05.001
[本文引用: 1]
The sea level rise under global climate change and coastal floods caused by extreme sea levels due to the high tide levels and storm surges have huge impacts on coastal society, economy, and natural environment. It has drawn great attention from global scientific researchers. This study examines the definitions and elements of coastal flooding in the general and narrow senses, and mainly focuses on the components of coastal flooding in the narrow sense. Based on the natural disaster system theory, the review systematically summarizes the progress of coastal flood research in China, then discusses existing problems in present studies and future research directions with regard to this issue. It is proposed that future studies need to strengthen research on adapting to climate change in coastal areas, including studies on the risk of multi-hazards and uncertainties of hazard impacts under climate change, risk assessment of key exposure (critical infrastructure) in coastal hotspots, and cost-benefit analysis of adaptation and mitigation measures in coastal areas. Efforts to improve the resilience of coastal areas under climate change should be given more attention. The research community also should establish the mechanism of data sharing among disciplines to meet the needs of future risk assessments, so that coastal issues can be more comprehensively, systematically, and dynamically studied.
Global socioeconomic risk of precipitation extremes under climate change
[J].
Daily extreme precipitation and trends over China
[J].DOI:10.1007/s11430-016-9117-8 URL [本文引用: 1]
High-temperature disaster risk assessment for urban communities: A case study in Wuhan, China
[J].High-temperature risk disaster, a common meteorological disaster, seriously affects people’s productivity, life, and health. However, insufficient attention has been paid to this disaster in urban communities. To assess the risk of high-temperature disasters, this study, using remote sensing data and geographic information data, analyzes 973 communities in downtown Wuhan with the geography-weighted regression method. First, the study evaluates the distribution characteristics of high temperatures in communities and explores the spatial differences of risks. Second, a metrics and weight system is constructed, from which the main factors are determined. Third, a risk assessment model of high-temperature disasters is established from disaster-causing danger, disaster-generating sensitivity, and disaster-bearing vulnerability. The results show that: (a) the significance of the impact of the built environment on high-temperature disasters is obviously different from its coefficient space differentiation; (b) the risk in the old city is high, whereas that in the area around the river is low; and (c) different risk areas should design built environment optimization strategies aimed specifically at the area. The significance of this study is that it develops a high-temperature disaster assessment framework for risk identification, impact differentiation, and difference optimization, and provides theoretical support for urban high-temperature disaster prevention and mitigation.
Future global socioeconomic risk to droughts based on estimates of hazard, exposure, and vulnerability in a changing climate
[J].
Characteristics of extreme precipitation over eastern Asia and its possible connections with Asian summer monsoon activity
[J].DOI:10.1002/joc.5837 URL [本文引用: 1]
Future changes in precipitation extremes over east Africa based on CMIP6 models
[J].This paper presents an analysis of projected precipitation extremes over the East African region. The study employs six indices defined by the Expert Team on Climate Change Detection Indices to evaluate extreme precipitation. Observed datasets and Coupled Model Intercomparison Project Phase six (CMIP6) simulations are employed to assess the changes during the two main rainfall seasons: March to May (MAM) and October to December (OND). The results show an increase in consecutive dry days (CDD) and decrease in consecutive wet days (CWD) towards the end of the 21st century (2081–2100) relative to the baseline period (1995–2014) in both seasons. Moreover, simple daily intensity (SDII), very wet days (R95 p), very heavy precipitation >20 mm (R20 mm), and total wet-day precipitation (PRCPTOT) demonstrate significant changes during OND compared to the MAM season. The spatial variation for extreme incidences shows likely intensification over Uganda and most parts of Kenya, while a reduction is observed over the Tanzania region. The increase in projected extremes may pose a serious threat to the sustainability of societal infrastructure and ecosystem wellbeing. The results from these analyses present an opportunity to understand the emergence of extreme events and the capability of model outputs from CMIP6 in estimating the projected changes. More studies are recommended to examine the underlying physical features modulating the occurrence of extreme incidences projected for relevant policies.
Global observed long-term changes in temperature and precipitation extremes: A review of progress and limitations in IPCC assessments and beyond
[J].DOI:10.1016/j.wace.2015.10.007 URL [本文引用: 1]
未来气候变化情景下湖北省极端降水的人口暴露分析
[J].
Analysis of population exposure to extreme precipitation in Hubei Province under the climate change scenarios
Impacts and socioeconomic exposures of global extreme precipitation events in 1.5 and 2.0 ℃ warmer climates
[J].
Global exposure to flooding from the new CMIP6 climate model projections
[J].Estimates of future flood risk rely on projections from climate models. The relatively few climate models used to analyze future flood risk cannot easily quantify of their associated uncertainties. In this study, we demonstrated that the projected fluvial flood changes estimated by a new generation of climate models, the collectively known as Coupled Model Intercomparison Project Phase 6 (CMIP6), are similar to those estimated by CMIP5. The spatial patterns of the multi-model median signs of change (+ or -) were also very consistent, implying greater confidence in the projections. The model spread changed little over the course of model development, suggesting irreducibility of the model spread due to internal climate variability, and the consistent projections of models from the same institute suggest the potential to reduce uncertainties caused by model differences. Potential global exposure to flooding is projected to be proportional to the degree of warming, and a greater threat is anticipated as populations increase, demonstrating the need for immediate decisions.
Increased population exposure to precipitation extremes under future warmer climates
[J].
Increased population exposure to precipitation extremes in China under global warming scenarios
[J].DOI:10.1080/16742834.2020.1697168 URL [本文引用: 1]
基于投入产出法的洪涝灾害间接经济损失评估: 以湖北省为例
[J].
DOI:10.18306/dlkxjz.2020.03.007
[本文引用: 1]
洪涝灾害对产业系统造成的经济影响既有直接经济损失也有间接经济损失,而间接经济损失远远高于直接经济损失,研究间接经济损失对灾害风险控制具有重要意义。论文基于投入产出模型,利用2016年湖北省洪涝灾害直接经济损失数据,从产业关联视角计算不同洪涝淹没水深下的产业部门间接经济损失。研究结果表明:① 随着淹没水深增加,不同产业部门受洪涝灾害冲击引起的直接经济损失与间接经济损失相应增加。② 大部分产业部门由于产业关联关系造成的间接经济损失高于直接经济损失;当淹没水深较小时,一些资产较密集的产业部门受洪涝灾害冲击较大,造成的直接经济损失高于间接经济损失。③ 全社会总直接经济损失与间接经济损失呈非线性关系,且间接经济损失随着直接经济损失增加而增加;当淹没水深大于2.093 m时,间接经济损失约是直接经济损失的1.15倍。
Indirect economic losses of flood disaster based on an input-output model: A case study of Hubei Province
DOI:10.18306/dlkxjz.2020.03.007
[本文引用: 1]
Flood disasters cause both direct and indirect economic losses to industrial systems, and indirect economic losses may be much higher than direct economic losses. Studying indirect economic losses is of great significance for disaster risk reduction. Based on the input-output model, this study used the direct economic loss data of flood disasters in Hubei Province in 2016 to evaluate indirect economic losses under different flood water depth, from the perspective of sectorial interconnectedness. The results show that: 1) With the increase of flood water depth, direct economic losses and indirect economic losses increase accordingly. 2) For most industrial sectors, indirect economic losses caused by industrial interconnectedness are higher than direct economic losses. However, when flood water depth is shallow, some industrial sectors with more intensive fixed assets are more affected by flood disasters, resulting in higher direct economic losses. 3) The total indirect economic losses show a nonlinear relationship with the total direct economic losses, but with the same trend. When the flood water depth is greater than 2.093 m, indirect economic losses are about 1.15 times of direct economic losses.
基于CMIP6的西南暴雨洪涝灾害风险未来预估
[J].
Future projection of rainstorm and flood disaster risk in Southwest China based on CMIP6
CMIP5 scientific gaps and recommendations for CMIP6
[J].
DOI:10.1175/BAMS-D-15-00013.1
[本文引用: 1]
The scientific gaps identified in the fifth phase of the Coupled Model Intercomparison Project (CMIP5) that guided the experiment for its next phase, CMIP6, are identified.
Overview of the Coupled Model Intercomparison Project Phase 6 (CMIP6) experimental design and organization
[J].
DOI:10.5194/gmd-9-1937-2016
URL
[本文引用: 1]
. By coordinating the design and distribution of global climate model simulations of the past, current, and future climate, the Coupled Model Intercomparison Project (CMIP) has become one of the foundational elements of climate science. However, the need to address an ever-expanding range of scientific questions arising from more and more research communities has made it necessary to revise the organization of CMIP. After a long and wide community consultation, a new and more federated structure has been put in place. It consists of three major elements: (1) a handful of common experiments, the DECK (Diagnostic, Evaluation and Characterization of Klima) and CMIP historical simulations (1850–near present) that will maintain continuity and help document basic characteristics of models across different phases of CMIP; (2) common standards, coordination, infrastructure, and documentation that will facilitate the distribution of model outputs and the characterization of the model ensemble; and (3) an ensemble of CMIP-Endorsed Model Intercomparison Projects (MIPs) that will be specific to a particular phase of CMIP (now CMIP6) and that will build on the DECK and CMIP historical simulations to address a large range of specific questions and fill the scientific gaps of the previous CMIP phases. The DECK and CMIP historical simulations, together with the use of CMIP data standards, will be the entry cards for models participating in CMIP. Participation in CMIP6-Endorsed MIPs by individual modelling groups will be at their own discretion and will depend on their scientific interests and priorities. With the Grand Science Challenges of the World Climate Research Programme (WCRP) as its scientific backdrop, CMIP6 will address three broad questions: – How does the Earth system respond to forcing? – What are the origins and consequences of systematic model biases? – How can we assess future climate changes given internal climate variability, predictability, and uncertainties in scenarios? This CMIP6 overview paper presents the background and rationale for the new structure of CMIP, provides a detailed description of the DECK and CMIP6 historical simulations, and includes a brief introduction to the 21 CMIP6-Endorsed MIPs.\n
Taking climate model evaluation to the next level
[J].
DOI:10.1038/s41558-018-0355-y
[本文引用: 1]
Earth system models are complex and represent a large number of processes, resulting in a persistent spread across climate projections for a given future scenario. Owing to different model performances against observations and the lack of independence among models, there is now evidence that giving equal weight to each available model projection is suboptimal. This Perspective discusses newly developed tools that facilitate a more rapid and comprehensive evaluation of model simulations with observations, process-based emergent constraints that are a promising way to focus evaluation on the observations most relevant to climate projections, and advanced methods for model weighting. These approaches are needed to distil the most credible information on regional climate changes, impacts, and risks for stakeholders and policy-makers.
The ERA5 global reanalysis
[J].DOI:10.1002/qj.v146.730 URL [本文引用: 1]
ERA5再分析降水数据在中国的适用性分析
[J].
Applicability of ERA5 reanalysis of precipitation data in China
Estimation of gridded population and GDP scenarios with spatially explicit statistical downscaling
[J].
Evaluation of six high-resolution satellite and ground-based precipitation products over Malaysia
[J].DOI:10.3390/rs70201504 URL [本文引用: 1]
Assessing the vulnerability and risk of maize to drought in China based on the AquaCrop model
[J].
基于CMIP6的中国未来暴雨危险性变化评估
[J].
DOI:10.11867/j.issn.1001-8166.2022.019
[本文引用: 1]
使用1961—2019年全国2 510个气象站点日值降水数据和2030—2100年第六次耦合模式比较计划的12个耦合模式的SSP2-4.5未来情景的降水模拟数据,基于核密度函数分别计算4个重现期(五年一遇、十年一遇、二十年一遇和五十年一遇)历史和未来情景中3个年暴雨要素(年暴雨日数、年暴雨量和年暴雨强度)的数值,在此基础上评估了中国未来暴雨危险性的变化。得到的主要结论如下:①从全国来看,在未来年暴雨日数和雨量呈增加趋势,而年暴雨强度在不同重现期下表现不一样。4个重现期下全国的年暴雨日数变化均值分别为0.36、0.57、0.73和0.92 d;年暴雨量变化均值分别为22.30、36.24、46.92和60.12 mm;年暴雨强度变化均值分别为2.43、0.27、-1.95和 -4.86 mm/d。②从不同气候区来看,年暴雨量和雨日在青藏高原、东部干旱区、东北地区、华北地区和西南地区呈增加趋势,在西部干旱(半干旱)区、华中地区和华南地区呈减少趋势。4个重现期下年暴雨强度在青藏高原均呈增加趋势,而其他地区以减少为主要趋势。③热点分析结果显示青藏高原东南部和南部是暴雨危险性增加最显著的区域;年暴雨日数和雨量减少的区域集中分布在西南地区的中部、华中和华南地区的中部和南部,年暴雨强度减少的区域集中在东部干旱区的中部、西南地区西部及华北地区北部和南部。
CMIP6 assessment of changes in hazard of future rainstorms in China
DOI:10.11867/j.issn.1001-8166.2022.019
[本文引用: 1]
Using the daily precipitation data of 2 510 meteorological stations in China from 1961 to 2019 and the precipitation simulation data of 12 coupling models of CMIP6 from 2030 to 2100 under the SSP2-4.5 future scenario, the values of three annual rainstorm elements (annual rainstorm days, annual rainstorm rainfall, and annual rainstorm intensity) in the historical and future scenarios were calculated based on the kernel density function under four return periods (5,10,20,50 years). Based on this, the future hazard change of rainstorms in China was assessed. The main conclusions are as follows: ① From a national perspective, the number of rainstorm days and rainfall amount are estimated to increase in the future, and the annual rainstorm intensity is estimated to change differently in different return periods. Under the four return periods, the mean change of annual rainstorm days in China is expected to be 0.36, 0.57, 0.73 and 0.92 days; the mean change of annual rainstorm rainfall is expected to be 22.30, 36.24, 46.92 and 60.12 mm; and the mean change of annual rainstorm intensity is expected to be 2.43, 0.27, -1.95 and -4.86 mm/d. ② From the perspective of different climatic zones, the annual rainstorm rainfall and rainstorm days showed an increasing trend in the Qinghai-Tibet Plateau, Eastern arid zone, Northeast China, North China, and Southwest China, and a decreasing trend in the western arid (semi-arid) zone, Central China, and South China. The annual rainstorm intensity is expected to increase in the Qinghai-Tibet Plateau and decrease in most other regions under the four return periods. ③ The hot spot analysis shows that the southeastern and southern Qinghai-Tibet Plateau are expected to be the areas with the most significant increases in rainstorm hazards. The areas with reduced annual rainstorm days and annual rainstorm rainfall are expected to be concentrated in the middle of Southwest China, the middle and south of Central China and South China. Finally, the areas with reduced annual rainstorm intensities are expected to be concentrated in the middle of the eastern arid zone, the west of Southwest China, and the north and south of North China.
Multimodel ensembles improve predictions of crop-environment-management interactions
[J].
DOI:10.1111/gcb.14411
PMID:30055118
[本文引用: 1]
A recent innovation in assessment of climate change impact on agricultural production has been to use crop multimodel ensembles (MMEs). These studies usually find large variability between individual models but that the ensemble mean (e-mean) and median (e-median) often seem to predict quite well. However, few studies have specifically been concerned with the predictive quality of those ensemble predictors. We ask what is the predictive quality of e-mean and e-median, and how does that depend on the ensemble characteristics. Our empirical results are based on five MME studies applied to wheat, using different data sets but the same 25 crop models. We show that the ensemble predictors have quite high skill and are better than most and sometimes all individual models for most groups of environments and most response variables. Mean squared error of e-mean decreases monotonically with the size of the ensemble if models are added at random, but has a minimum at usually 2-6 models if best-fit models are added first. Our theoretical results describe the ensemble using four parameters: average bias, model effect variance, environment effect variance, and interaction variance. We show analytically that mean squared error of prediction (MSEP) of e-mean will always be smaller than MSEP averaged over models and will be less than MSEP of the best model if squared bias is less than the interaction variance. If models are added to the ensemble at random, MSEP of e-mean will decrease as the inverse of ensemble size, with a minimum equal to squared bias plus interaction variance. This minimum value is not necessarily small, and so it is important to evaluate the predictive quality of e-mean for each target population of environments. These results provide new information on the advantages of ensemble predictors, but also show their limitations.© 2018 John Wiley & Sons Ltd.
地理探测器: 原理与展望
[J].
DOI:10.11821/dlxb201701010
[本文引用: 3]
空间分异是自然和社会经济过程的空间表现,也是自亚里士多德以来人类认识自然的重要途径。地理探测器是探测空间分异性,以及揭示其背后驱动因子的一种新的统计学方法,此方法无线性假设,具有优雅的形式和明确的物理含义。基本思想是:假设研究区分为若干子区域,如果子区域的方差之和小于区域总方差,则存在空间分异性;如果两变量的空间分布趋于一致,则两者存在统计关联性。地理探测器q统计量,可用以度量空间分异性、探测解释因子、分析变量之间交互关系,已经在自然和社会科学多领域应用。本文阐述地理探测器的原理,并对其特点及应用进行了归纳总结,以利于读者方便灵活地使用地理探测器来认识、挖掘和利用空间分异性。
Geodetector: Principle and prospective
DOI:10.11821/dlxb201701010
[本文引用: 3]
Spatial stratified heterogeneity is the spatial expression of natural and socio-economic process, which is an important approach for human to recognize nature since Aristotle. Geodetector is a new statistical method to detect spatial stratified heterogeneity and reveal the driving factors behind it. This method with no linear hypothesis has elegant form and definite physical meaning. Here is the basic idea behind Geodetector: assuming that the study area is divided into several subareas. The study area is characterized by spatial stratified heterogeneity if the sum of the variance of subareas is less than the regional total variance; and if the spatial distribution of the two variables tends to be consistent, there is statistical correlation between them. Q-statistic in Geodetector has already been applied in many fields of natural and social sciences which can be used to measure spatial stratified heterogeneity, detect explanatory factors and analyze the interactive relationship between variables. In this paper, the authors will illustrate the principle of Geodetector and summarize the characteristics and applications in order to facilitate the using of Geodetector and help readers to recognize, mine and utilize spatial stratified heterogeneity.
中国暴雨洪涝灾情时空格局及影响因素
[J].
DOI:10.11821/dlxb202105008
[本文引用: 1]
暴雨洪涝灾害给中国造成了巨大人口和经济损失。本文通过对中国气象灾情普查数据的分析,结合小时降水数据、统计年鉴等资料,研究了1984—2007年间中国极端降水和暴雨洪涝灾情时空分异特征。在此基础上,采用地理探测器研究了中国暴雨洪涝灾情时空格局的影响因素。结果表明,研究时段内全国极端降雨指标没有一致的变化趋势。长江、珠江及东南沿海等流域暴雨洪涝频次显著增加,但因灾人口死亡率下降,表明设防能力的提升对人口损失的缓减影响明显;西北地区因灾死亡人数和人口受灾率、经济损失等均增加,表明设防能力薄弱;因暴雨洪涝受灾人口贡献率最高的因子是气象致灾因素,又因暴雨洪涝死亡人口贡献率最高的是地理等孕灾环境和社会经济等承灾体因素,故暴雨洪涝直接经济损失贡献率最高的是地理等孕灾环境因素。该研究可为洪水灾情的影响因素定量化分析提供理论参考。
Spatiotemporal patterns and influencing factors of rainstorm-induced flood disasters in China
DOI:10.11821/dlxb202105008
[本文引用: 1]
Understanding the influencing factors and controls of rainstorm-induced floods, which have caused tremendous losses of human lives and national economy, is a pressing need for flood risk management in China. Based on the meteorological disaster census data of counties in China, hourly precipitation data at 2420 stations, statistical yearbook, terrain data and other data, the authors (1) investigated the spatiotemporal pattern of flood impacts in China over the period from 1984 to 2007 using trend analysis techniques and (2) explored the driving factors of the spatiotemporal pattern by adopting the geospatial statistical analysis tool (Geodetector). This study considered the spatiotemporal patterns and their interplays among county-level flood impacts (i.e., flood-induced mortality rate, proportion of population affected, and economic loss in percentage), disaster-formative environmental factors (i.e., population density, urban population percentages, average elevation, river density, average slope, and average distance to the seashore), and extreme precipitation characteristics (i.e., annual average volume and duration of extreme rainfall). The results show that: (1) there were no consistent temporal trends of extreme rainfall characteristics over the study period across China. (2) The frequencies of flood disasters in the Yangtze and Pearl rivers and southeast coastal areas increased significantly, but the casualties over these regions decreased. (3) Flood-induced casualties, proportion of population affected and economic loss in percentage increased in Northwest China; and meteorological factors, disaster-formative environment factors such as geographical conditions and social economy, and geographical conditions contribute mostly to the proportion of population affected, flood-induced death and economic loss in percentage. These results indicate that more attention should be paid to improving the flood control capacity of small or medium-sized cities in the inland river basins, especially in Northwest China, and we should recognize the important roles that disaster-formative environment plays in triggering flood losses.
基于参数最优地理探测器的江西省山洪灾害时空格局与驱动力研究
[J].
Spatial-temporal pattern and driving factors of flash flood disasters in Jiangxi Province analyzed by optimal parameters-based geographical detector
Analysis of change in maize plantation distribution and its driving factors in Heilongjiang Province, China
[J].Accurate identification of maize plantation distribution and timely examination of key spatial-temporal drivers is a practice that can support agricultural production estimates and development decisions. Previous studies have rarely used efficient cloud processing methods to extract crop distribution, and meteorological and socioeconomic factors were often considered independently in driving force analysis. In this paper, we extract the spatial distribution of maize using classification and regression tree (CART) and random forest (RF) algorithms based on the Google Earth Engine (GEE) platform. Combining remote sensing, meteorological and statistical data, the spatio-temporal variation characteristics of maize plantation proportion (MPP) at the county scale were analyzed using trend analysis, kernel density estimation, and standard deviation ellipse analysis, and the driving forces of MPP spatio-temporal variation were explored using partial correlation analysis and geodetectors. Our empirical results in Heilongjiang province, China showed that (1) the CART algorithm achieved higher classification accuracy than the RF algorithm; (2) MPP showed an upward trend in more than 75% of counties, especially in high-latitude regions; (3) the main climatic factor affecting the inter-annual fluctuation of MPP was relative humidity; (4) the impact of socioeconomic factors on MPP spatial distribution was significantly larger than meteorological factors, the temperature was the most important meteorological factor, and the number of rural households was the most important socioeconomic factor affecting MPP spatial distribution. The interaction between different factors was greater than a single factor alone; (5) the correlation between meteorological factors and MPP differed across different latitudinal regions and landforms. This research provides a key reference for the optimal adjustment of crop cultivation distribution and agricultural development planning and policy.
Significant increase of the global population exposure to increased precipitation extremes in the future
[J].
Exposure of population to droughts in the Haihe River Basin under global warming of 1.5 and 2.0 ℃ scenarios
[J].DOI:10.1016/j.quaint.2017.05.005 URL [本文引用: 1]
