2018年12月,中央经济工作会议首次提出“新基建”(新型基础设施建设)概念。随着在抗击新冠感染过程中对无接触、智能化产品和服务的需求加大,新基建发展的重要性和紧迫性愈发凸显。为此,全国各级政府积极部署新基建发展方案,旨在加快社会经济高质量发展。这客观上要求精准把握新基建发展现状及驱动因素,以此为各级政府的决策部署提供科学依据。
目前,学术界在新基建领域已经积累了一定的成果,但主要集中于顶层设计角度的策略布局[1 ⇓ -3 ] 。虽然有学者从描述统计角度分析了中国新基建发展现状[4 ] ,但并未直观展现出中国新基建的空间格局,对其综合量化评价方面更显不足。尽管如此,按照国家发展和改革委员会(简称“发改委”)对新基建包含信息基建、融合基建和创新基建等3个方面的权威解读[4 ] ,学术界在这3个方面的量化评价已经开展了大量研究。其中,在信息基建评价方面,主要使用固定电话、移动电话、互联网和邮电业务或信息基建领域中的相关专利数据等指标[5 -6 ] ;在融合基建评价方面,已有研究针对智慧能源或智慧交通多采用定性评价,而在智慧城市和智慧产业等领域也有学者构建了综合评价指标[7 -8 ] ,但多数指标仍采用互联网和电信业务等信息基建的内容;在创新基建评价方面,部分采用政策解读或案例解析的定性方法[9 ] ,也有学者采用研发支出等系列指标来综合评价创新基建质量[10 ] 。如吕拉昌等[11 ] 采用国家重大科技基础设施、科教基础设施、产业技术创新基础设施等指标进行衡量,基本吻合了新基建中创新基建的内容[12 ] 。除此之外,亦有学者尝试基于新基建3个方面对其做出综合评价[13 ] ,但所选指标并未体现新基建“新”的特征。在妥善选取新基建综合评价指标的基础上,对其综合评价的方法和驱动因素分析可以借鉴传统基建[14 ⇓ ⇓ -17 ] ,毕竟前者相对后者存在着继承与发展的关系[4 ] 。
综上所述,已有研究为新基建发展水平的综合评价积累了丰富经验,但仍存在以下几点可改进之处:第一,学者多基于单一领域对新基建发展水平进行测度,缺乏能够全面刻画新基建发展水平的优化指标;第二,由于数据的限制,部分学者虽尝试综合测度新基建发展水平,但在指标选取方面难以体现出新基建“新”的特性,导致新基建发展水平的综合评价缺乏相对合理性,因而亟需进行必要的修正与完善;第三,由于影响新基建发展水平的多个因素在相邻地理区位上常存在空间溢出效应,加之空间单元的划分或归并可导致空间数据误差的出现[18 -19 ] ,地区尺度上新基建的发展水平通常表现出较强的空间自相关性(spatial autocorrelation);然而,既有研究尚少讨论新基建发展的驱动因素,尤其是考虑空间自相关后的修正探讨。因此,全面综合评价新基建发展水平并分析全国尺度下新基建的时空演化格局,有利于更进一步把握和理解中国新基建发展现状及布局规律;同时,新型基础设施通常具备跨区域服务的特性,基于空间关联视角探讨新基建布局的驱动机制,不仅有利于通过揭示其布局规律来拓展和深化传统区位理论,而且有助于区域发展政策制定向跨行政单元思路上的突破。
基于此,本文拟结合国家发改委对新基建做出的权威解读和已有文献及政策文本的梳理,从信息基建、融合基建和创新基建3个方面的内容构建新基建发展水平的综合评价指标体系,并运用TOPSIS-熵值法测度中国新基建发展水平。在此基础上,利用空间统计标准差椭圆(SDE)等方法[20 ] 分析其时空演化特征,并运用空间计量模型探讨其驱动因素,以期为中国新基建发展提供一定价值的借鉴参考。
1 研究方法与数据来源
1.1 新基建发展水平的测度
尽管新基建自提出以来便引起了社会各界的高度关注,但截至目前并未形成统一的理解和认识。央视新闻曾在2019年3月2日的报道中提出,新基建包括5G、特高压、城际高速铁路和城际轨道交通、新能源汽车充电桩、大数据中心、人工智能、工业互联网等7大领域① (① http://jingji.cctv.com/2019/03/02/ARTIvuyfQ1gT9p5T0pXTWTkv190302.shtml?spm=C87458.PxZ1sQfyXDLK.S83118.3 。)。到2020年4月,国家发改委对新基建做出了详细解读,认为新基建包括信息基础设施、融合基础设施和创新基础设施等3个方面的内容,其中:信息基础设施主要包括5G、物联网、工业互联网、卫星互联网等通信网络基础设施,人工智能、云计算、区块链等新技术基础设施和数据中心、智能计算中心等算力基础设施;融合基础设施主要包括智能交通基础设施和智慧能源基础设施等;创新基础设施主要包括重大科技基础设施、科教基础设施、产业技术创新基础设施等。虽然“七领域说”因特高压输电、城市地铁等已建设多年而受到质疑,但新基建并不一定是新的基建,而是与传统基建存在继承与发展的关系[3 -4 ] 。此外,新基建在新冠疫情防控中发挥的作用有目共睹,诸如健康码、线上会议、智慧生活等配套设施的建立。
综上所述,本文基于已有文献和政策文本的回顾与梳理,从信息基础设施、融合基础设施和创新基础设施3个方面对新基建发展水平予以测度。具体而言,将城际高速铁路与城际轨道交通计入智慧交通基础设施,将特高压和充电桩计入智慧能源基础设施,将医疗IT和智慧城市纳入防疫基建,构建了新基建发展水平的综合评价指标(表1 )。其中,物联网、工业互联网和区块链等三级指标皆存在跨区域的天然属性,故而需要区分该类型设施对单个区域的影响评价。然而,区域某一类设施发展水平越高,即代表着该地区对相关设施的供给与需求能力越强,那么相关企业的数量自然就多,因此,本文采用区域内对应设施的相关企业数量作为代理变量。
另外,本文使用TOPSIS-熵值法测度新基建发展水平,TOPSIS-熵值法是对传统TOPSIS评价法的改进,通过熵值法确定评价指标的权重能够避免主观因素的影响,再通过TOPSIS法利用逼近理想解的技术确定评价对象的排序,进而得到新基建发展水平的综合评价结果[21 ] 。计算步骤如下:
(1) 假设被评价对象有m 个,每个被评价对象的评价指标有n 个,构建判断矩阵X
(1) X = x i j m × n i = 1,2 , ⋯ , m ; j = 1,2 , ⋯ , n
(2) 对判断矩阵进行标准化处理,本文指标均为正向指标,因此:
(2) Y i j = X i j - m i n ( X i ) m a x ( X i ) - m i n ( X i )
(3) E j = - k ∑ i = 1 m p i j l n p i j
式中:p i j = Y i j ∑ i = 1 m Y i j ; k = 1 l n m
(4) 确定各指标的权重,通过信息熵计算各个指标的权重w j
(4) w j = 1 - E j ∑ j = 1 n 1 - E j
(5) R = r i j m × n r i j = w j · x i j i = 1,2 , ⋯ , m ; j = 1,2 , ⋯ , n
(6) s j + = m a x r 1 j , r 2 j , ⋯ , r n j , s j - = m i n r 1 j , r 2 j , ⋯ , r n j
(7) 计算各种方案与最优解和最劣解的欧氏距离s e p i + s e p i -
(7) s e p i + = ∑ j = 1 n s j + - r i j 2 , s e p i - = ∑ j = 1 n s j - - r i j 2
(8) C i = s e p i - s e p i + + s e p i - , C i ∈ [ 0,1 ]
1.2 变量选取与模型说明
影响新基建发展的因素众多,为了确保核心因素不被遗漏,同时兼顾数据的可获得性,本文基于已有研究成果来选择新基建发展的驱动因素。第一,经济发展水平较高的国家往往更具有增加基础设施投资的动机[22 ] ,因为经济发展会提高基础设施的需求与供给能力[23 ] ,那么经济发展必定会增加新基建投资,更有能力维护、升级或改造传统基建;第二,产业结构可能会影响新基建的需求[24 ] ,因为工业互联网、物联网、云计算等新型基建将助力智慧产业的形成及运营[8 ] ,如智慧社会下的远程办公等[25 ] ;第三,任何基建的发展都需要足额的资金支撑,而且已有研究表明,金融发展水平是基础设施发展的影响因素[16 ] ,而需要较大投资规模的新基建自然离不开优良金融发展水平的加持;第四,新基建与新技术革命前沿紧密结合,以技术创新为驱动[1 ] ,所以创新基础也有可能是新基建发展的重要驱动力;第五,基础设施与城市化密切相关[26 ] ,农村人口转移到城市将增加配套基础设施的需求,拉动基础设施的投资[27 -28 ] ,因而城市化进程也可能影响新基建的发展;最后,人口规模可能对新基建发展产生影响,因为人口规模和基础设施的市场需求密切相关,人口规模越大对基础设施的需求往往越大。综上所述,本文将选择经济发展水平、产业结构高度化、产业结构合理化、金融发展水平、创新基础、城市化进程、人口规模等变量来探讨新基建发展水平的驱动因素,具体计算方法见表2 。
为检验新基建发展水平的影响因素,本文首先构建了各省域新基建发展水平影响因素估计的面板模型:
(9) D i t = β 0 + β 1 X i t + ε i t
式中:i 代表地区,t 代表年份;Dit 为i 地区t 年的新基建发展水平,Xit 为各省新基建发展水平的影响因素,β 1 为Xit 的系数,β 0 为常数项,εit 为残差项。
进一步考虑空间依赖性,选择空间杜宾模型进行估计。模型如下:
(10) D i t = β 0 + ρ W * D i t + β 1 X i t + ρ 1 W * X i t + ε i t
式中:W 为空间邻接权重,W *Dit 为新基建发展水平的空间滞后变量,W *Xit 为影响因素的空间滞后变量,ρ 、ρ 1 分别反映被解释变量Dit 和解释变量Xit 的空间溢出效应。所以,空间杜宾模型同时考察邻近地区新基建发展水平对本地新基建发展水平的影响和邻近地区影响因素对本地新基建发展水平的影响。
1.3 数据来源
本文以全国31省(市、区)(不含港澳台地区)为研究样本,考虑到“新基建”数据可得性与及时性而选取2013—2020年作为时期跨度。新基建发展水平综合指标数据主要来源于企查查平台(https://www.qcc.com/ )、《中国火炬统计年鉴(2013—2020)》、科塔学术网站(https://www.sciping.com/ )等,新基建发展的驱动因素数据主要来源于《中国统计年鉴(2013—2020)》和《国民经济和社会发展统计公报(2013—2020)》等,个别数据缺失值采用插值法补充。
2 中国新基建发展的时空演变特征
2.1 新基建发展水平的时间演变趋势
中国新基建发展水平逐年提高,而其变异系数(CV)整体呈下降趋势(图1 )。本文运用基于熵值法的TOPSIS模型对中国新基建发展水平进行评价,结果显示,2013—2020年全国新基建发展水平呈持续增长趋势,其增长率也在波动中不断增长,2020年增长率达29.95%。截至2020年,广东的新基建发展水平位居全国首位,其次是北京、江苏、山东、浙江、上海等,青海和宁夏等地区发展较为落后。然而,从变异系数来看,全国新基建发展水平的差异在波动中持续下降,特别是2020年较上一年直接下降了7.67%。究其原因,离不开全国各省(市)对新基建发展的重视,其中:福建、海南和西藏等地2013—2020年新基建发展水平翻了10余倍;其次是贵州,提高了近6倍;湖南、宁夏和广西等地也取得了长足的发展。
图1
图1
中国新基建发展水平
Fig.1
The development level of new infrastructure in China
2.2 新基建发展水平的空间演化
中国新基建发展水平存在着较大的空间异质性,东部地区远高于中部、西部和东北地区(图2 )。具体来看,4大区域的新基建发展水平持续提高,其中,东部地区新基建发展水平远远高于全国平均水平,而中部、西部和东北地区新基建发展水平均低于全国平均水平。从绝对值来看,2013—2020年期间,中部地区新基建发展水平一直领先于西部和东北地区,而西部地区在2019年后略微超过东北地区。就增长率而言,西部地区2014—2020年间的平均增长率最高,达21.39%,其次是中部地区(18.95%),均高于全国平均增速(16.67%),而东部地区(15.74%)和东北地区(8.22%)均低于全国平均水平。同时,西部地区新基建发展水平的增长率在2020年居4大板块第一位,高达31.34%;其次是东部地区,为30.84%,在拉动当年全国平均增长率方面起了重要作用;而中部和东北地区也存在着较大提升,增长率分别为29.17%和16.73%。
图2
图2
中国4大区域新基建发展水平
Fig.2
The development level of new infrastructure in the four main economic regions of China
与此同时,东部和西部地区新基建发展水平存在着较大的不均衡性,高于中部和东北地区。从4大区域新基建发展水平的变异系数来看,尽管东部地区的变异系数呈现出先增大后下降的趋势,且2014—2019年一直高于其他3大区域,到2020年被西部地区超越,但其内部各省(市)的差距仍很大,如北京和海南等;中部地区新基建发展水平的变异系数自2014年后一直呈下降态势,这可能源于中部崛起战略的持续深化;西部地区新基建发展水平的变异系数明显高于中部和东北地区,且其波动幅度以2018年为分界线呈现出先下降后增大的趋势,可能主要是因为2018年中国提出新基建之后,贵州、陕西、四川和重庆等地区新基建发展速度快于西部其他地区;东北地区的变异系数在4大区域一直处于最低状态,且2013—2020年在波动中基本维持稳定,体现了东北三省在新基建发展方面的步调基本一致。
此外,中国新基建发展水平的时空演化格局呈现出东西扩张态势,重心不断向西南方向移动。从图3 可以看出,2013—2020年中国省域尺度下新基建发展水平的重心由河南和安徽交界处经河南向湖北移动,大致向西位移97.42 km,向南移动176.22 km,总体移动201.35 km。与此同时,中国新基建发展水平空间分布标准差椭圆长轴与短轴的比值呈缩小趋势,即椭圆的东西方向呈扩张态势,体现出中国近年来西部地区新基建发展水平的增长拉动作用强劲。
图3
图3
中国新基建发展水平的时空格局
注:本图基于自然资源部标准地图服务网站下载的审图号为GS(2020)4628号的标准地图绘制,底图无修改。
Fig.3
Temporal and spatial patterns of China's new infrastructure development level
3 新基建发展水平的驱动因素分析
通过空间自相关分析(Moran's I )证明了新基建发展水平具有一定空间正相关性,对于具有较强空间自相关性的空间数据而言,采用最小二乘法回归是有偏误的[30 ] ,故探讨其影响因素应考虑空间依赖性,宜采用空间计量模型。在进行空间计量分析之前,本文通过LM检验、Hausman检验、LR检验和Wald检验等方法进行比较空间滞后模型(spatial lag model,SLM)、空间误差模型(spatial error model,SEM)和空间杜宾模型(spatial Durbin model,SDM)的适配性(表3 ),最终确定采用固定效应下的空间杜宾模型(SDM)来探讨新基建发展水平的驱动因素。
基于空间邻接权重矩阵,本文采用固定效应下的SDM估计新基建发展水平的驱动因素,结果如表4 所示。其中,模型1(M1)采用了时间固定效应,模型2(M2)采用了个体固定效应,模型3(M3)采用了混合固定效应,结果显示:模型1的拟合度高于模型2和模型3,可信度较更强(R 2 =0.815),故本文重点关注模型1的回归结果。
从具体结果来看,模型1空间滞后项系数(ρ )通过了1%的显著性水平检验(P <0.01),且空间效应显著为负,表明新基建发展水平在省域之间具有负向的空间溢出效应。
经济发展水平(PGDP)对新基建发展水平具有显著正向影响(P <0.01)。由于人均GDP是区域综合经济实力的反映,一个地区的经济实力越强,往往越有能力解决新基建的供需矛盾,从而为新基建的发展提供良好的基础环境。同时,经济发展水平的空间滞后项对新基建发展水平的估计结果也通过了5%的正向显著性水平检验,说明经济发展水平具有明显的空间溢出效应,即周边地区经济发展水平对当地新基建发展的传导作用明显。
产业结构高度化(AIS1)对新基建发展水平具有显著正向影响(P <0.01)。这表明中国第三产业相对第二产业更有助于推进新基建发展,间接体现了中国服务业数字化的程度高于制造业的客观现实。然而,产业结构高度化的空间滞后项对新基建发展水平的估计结果并不显著,即周边地区产业结构对当地新基建发展的传导效果不明显,可能的原因在于以现代服务业为主的第三产业的空间服务范围集中于本地区。
产业结构合理化(AIS2)对新基建发展水平具有显著正向影响(P <0.01)。这表明产业结构合理化,即产业之间协调能力和资源有效利用程度[31 ] 对新基建发展具有促进作用。然而,产业结构合理化的空间滞后项对新基建发展水平的估计结果也没通过显著性水平检验,表明周边地区产业结构合理化对本地新基建发展的作用不明显,原因可能在于目前跨区域的产业协调和资源利用还没充分利用新基建的价值,从而对新基建发展的促进作用未得到完全发挥。
金融发展水平(FD)对新基建发展水平具有显著正向影响(P <0.01)。因为金融发展水平往往代表着地区的投融资能力,而新基建对投资规模要求较高,所以新基建的发展离不开发达的金融发展。与此同时,金融发展的空间滞后项对新基建发展水平的估计结果也通过了5%的显著性水平检验,说明周边地区金融发展对当地新基建发展具有明显的正向传导作用,这符合现实中跨区域参与投融资的基本事实。
创新基础(INNO)对新基建发展水平具有显著正向影响(P <0.01)。新基建对技术水平的要求较高,而领先的技术水平需要优良的创新基础作为根基,所以创新基础对新基建的发展具有正向促进作用。与此同时,创新基础的空间滞后项对新基建发展水平的估计结果也通过了1%的显著性水平检验,且方向为正,表明周边地区的创新基础有助于本地新基建发展,反映了创新具有较强的空间溢出效应[32 -33 ] 。
城市化进程(UP)对新基建发展水平具有显著的正向影响(P <0.01)。由于新基建旨在推进数字化、网络化和智能化等转型,而城市对其供给与需求能力往往更高,所以城市化进程有助于新基建发展。然而,城市化进程的空间滞后项对新基建发展水平的估计结果显示,周边地区城市化进程对当地新基建发展具有显著的负向传导作用,可能的原因在于城市的虹吸效应大于溢出效应[34 ] ,进而对本地新基建发展更有利。
人口规模(POP)对新基建发展水平具有显著正向影响(P <0.01)。原因主要在于人口规模和新基建的市场需求密切相关,人口规模越大,新基建的需求量自然也就越高,从而推进新基建的发展。与此同时,人口规模的空间滞后项对新基建发展水平具有显著负向影响,估计结果通过了1%的显著性水平检验,表明周边地区的人口规模越大会反向抑制本地新基建发展,原因可能在于周边地区人口规模越大,往往对新基建的市场需求就越大,而相对来说本地较小的市场需求使新基建发展的动机减少。
此外,为了更好地体现各影响因素空间溢出的方向和大小,本文借鉴LeSage等[35 ] 的做法,根据拟合优度较好的时间固定效应SDM模型估计结果,求得偏微分进而估计各影响因素对新基建发展水平的直接影响和间接影响,结果见表5 。其中,经济发展水平(PGDP)对新基建发展水平的直接效应和总效应显著为正,表明经济发展对新基建发展的正向作用主要来源于本地,原因可能在于新基建的发展需要本地拥有足够的经济实力,同时地区经济发展,特别是在当前逐渐向数字经济转型的过程中又加大了对新基建的需求[36 ] ;产业结构高度化(AIS1)对新基建发展水平的直接效应显著为正,间接效应和总效应均未通过显著性水平检验,说明产业结构对新基建发展的影响集中体现于本地,原因主要在于本地区的产业结构决定着新基建的布局与发展方向,如工业为主的地区转型升级过程中会增加对工业互联网等新型基础设施的需求[37 ] ;产业结构合理化(AIS2)对新基建发展水平的直接效应和总效应均通过了1%的显著性水平检验,且方向为正,而其间接效应未通过显著性水平检验,表明产业结构合理化对新基建发展水平的影响主要来自本地,原因可能在于行政区划和市场分割等因素不利于跨区域的产业协调和资源流动[38 ] ,从而导致周边地区产业结构合理化对新基建的促进作用不明显;金融发展水平(FD)对新基建发展水平的直接效应和总效应均通过了显著性水平检验,方向均为正,表明金融发展水平对新基建建设的影响主要来自于本地,原因可能在于新基建的发展对资金的需求往往较大,需要大量的投融资,但由于当前关键核心技术能力不足、技术路线不确定、网络和信息安全、投融资机制不畅等问题的存在[4 ] ,导致周边地区金融能力对本地新基建发展的促进作用不明显;创新基础(INNO)对新基建发展水平的直接、间接和总效应均通过了显著性水平检验,表明区域内及周边地区创新基础均对本区域新基建发展具有积极影响,原因可能在于创新基础是人工智能、物联网、区块链等新型基础设施建设与维护的必要条件,而且创新又具有明显的溢出效应[39 ] ;城市化进程(UP)对新基建发展水平的直接效应和间接效应均通过了显著性水平检验,但两者的方向相反,证明了城市化进程对本地新基建发展有促进作用,而周边区域城市化进程对本地新基建发展具有抑制作用,即城市化进程主要以虹吸原理推进新基建发展,原因主要在于中国城市的智慧化转型加大了新基建的需求[40 ] ,而本地城市化进程对新基建的需求往往只需要在本地进行满足;人口规模(POP)对新基建发展水平的直接效应和间接效应均通过了1%的显著性水平检验,但直接效应的方向为正,间接效应的方向为负,进一步验证了人口规模与新基建的发展密切相关,人口规模越大越有利于新基建的发展,原因可能在于出于集约化考虑,新基建的建设更倾向于人口规模较大的区域。
4 结论与讨论
新基建是应对新一轮科技革命和产业变革的核心支撑。为了准确把握中国新基建发展状况及其时空演化特征,本文首先构建了新基建发展水平的综合评价指标体系,进而测度并刻画出中国新基建发展水平及时空演化特征,在此基础上探讨了其驱动因素。得出以下主要结论:
(1) 2013—2020年期间,中国新基建发展水平逐年增长,且增长幅度有增大的趋势;但各省域新基建发展水平的差距呈逐年缩小趋势,其变异系数不断降低。
(2) 中国新基建发展水平存在着较大的空间异质性,东部地区新基建发展水平远远高于全国平均水平,其次是中部、西部地区,东北地区的新基建发展水平最低;整体时空演化格局呈现出东西扩张态势,重心不断向西南方向移动。
(3) 新基建发展水平受到多种因素的影响,其中,经济发展水平、创新基础、城市化进程和人口规模等是关键性驱动因素。
伴随着中国新基建发展步伐加快,未来必须结合区域比较优势,合理规划布局新基建。基于上述分析,进一步落实新基建发展战略可以从2个方面入手:一是结合区域新基建发展现状,综合考虑本地及周边地区经济发展、创新基础、城市化进程、人口规模等因素,科学评估区域实际供需能力,优化新基建布局策略;二是鉴于新基建发展驱动因素的空间溢出效应,应在加强本地与周边地区经济社会联系的基础上从区域整体或跨区域的角度制定新基建的布局政策。随着新基建驱动因素可识别性与可控性的增强,区域发展条件将成为新基建布局优化研究更有效的依据。
本文还存在一定局限性,由于数据限制,在测算新基建发展水平时较多地以不同类型新基建相关企业数量作为代理变量,使新基建发展水平的评价结果可能存在一定偏差。因此,在数据可获取的前提下,未来研究还可以用更为可靠的数据探讨中国新基建发展现状和影响因素,以及进行新基建类型异质性等问题的探讨。
参考文献
View Option
[1]
金凤君 . 以“新基建”为牵引促进东北地区融合创新发展
[J]. 学习与探索 , 2021 (1 ): 120 -124 .
[本文引用: 2]
[Jing Fengjun . Promoting the integrated and innovative development of Northeast China under the guidance of "new infrastructure"
Study & Exploration , 2021 (1 ): 120 -124 .]
[本文引用: 2]
[2]
李晓华 . 面向智慧社会的“新基建”及其政策取向
[J]. 改革 , 2020 (5 ): 34 -48 .
[本文引用: 1]
[Li Xiaohua . New infrastructure construction and policy orientation for a smart society
Reform , 2020 (5 ): 34 -48 .]
[本文引用: 1]
[3]
郭朝先 , 王嘉琪 , 刘浩荣 . “新基建”赋能中国经济高质量发展的路径研究
[J]. 北京工业大学学报(社会科学版) , 2020 , 20 (6 ): 13 -21 .
[本文引用: 2]
[Guo Chaoxian Wang Jiaqi Liu Hao-rong . Studies on how new infrastructure empowers high-quality development of China's economy
Journal of Beijing University of Technology (Social Sciences Edition) , 2020 , 20 (6 ): 13 -21 .]
[本文引用: 2]
[4]
刘艳红 , 黄雪涛 , 石博涵 . 中国“新基建”: 概念、现状与问题
[J]. 北京工业大学学报(社会科学版) , 2020 , 20 (6 ): 1 -12 .
[本文引用: 5]
[Liu Yanhong Huang Xuetao Shi Bohan . China's new infrastructure construction: Concepts, current situations and problems
Journal of Beijing University of Technology (Social Sciences Edition) , 2020 , 20 (6 ): 1 -12 .]
[本文引用: 5]
[5]
Huang J Li W Guo L , et al . Information and communications technology infrastructure and firm growth: An empirical study of China's cities
[J]. Telecommunications Policy , 2021 , 46 (3 ): 102263 . doi: 10.1016/j.telpol.2021.102263 .
URL
[本文引用: 1]
[6]
Qiao L Li L Fei J . Information infrastructure and air pollution: Empirical analysis based on data from Chinese cities
[J]. Economic Analysis and Policy , 2022 , 73 : 563 -573 .
DOI:10.1016/j.eap.2021.12.014
URL
[本文引用: 1]
[7]
张建伟 , 李贝歌 , 毕东方 , 等 . 中国智慧城市发展水平空间差异研究
[J]. 世界地理研究 , 2017 , 26 (2 ): 82 -90 .
[本文引用: 1]
采用因子分析、聚类分析、ESDA等方法,探讨中国77个智慧城市2011年和2014年空间结构演变,分析影响智慧城市发展的主因子。研究表明:(1)影响智慧城市空间结构和区域差异的主因子动态变化不大,主要是综合实力因子;(2)中国地级以上智慧城市的总体水平空间差异明显;(3)中国智慧城市的发展格局呈现出由单极向多极、由“塔”型向“梭”型转变的趋势;(4)智慧城市发展主要受到城市发展的内在需求、对原有资源禀赋的惯性依赖、政策的影响及智慧文化,尤其是政策的作用非常显著。
[Zhang Jianwei Li Beige Bi Dongfang , et al . Study on spatial difference of smart city development level in China
World Regional Studies , 2017 , 26 (2 ): 82 -90 .]
[本文引用: 1]
By factor analysis, cluster analysis,ESDA and other methods,the spatial structure evolution of 77 Small Cities in China in 2011 and 2013 is discussed,and the actors that influence the development of Small City are analyzed.The research shows that (1)The main factors that affect the spatial structure and the regional differences of the Small City are not big,and the main factors are comprehensive strength factors ;(2)The overall level of the Small City in China is more obvious differences ;(3)The development pattern of the Small City in China is from the unipolar to the multistage,from the “tower” type to “shuttle” type of the trend ;(4)The development of Small City is mainly influenced by the inherent requirement of the city,and the inertia dependence and policy of the original resources endowment,and smart culture.The policy function is very significant.
[8]
刘鸿雁 , 雷磊 . 中国智慧产业发展水平综合评价与时空特征
[J]. 经济地理 , 2017 , 37 (2 ): 106 -113 .
[本文引用: 2]
[Liu Hongyan Lei Lei . Comprehensive evaluation on development level of regional smart industry in China
Economic Geography , 2017 , 37 (2 ): 106 -113 .]
[本文引用: 2]
[9]
Feldman M P Richard F . The geographic sources of innovation: Technological infrastructure and product innovation in the United States
[J]. Annals of the Association of American Geographers , 1994 , 84 (2 ): 210 -229 .
DOI:10.1111/j.1467-8306.1994.tb01735.x
URL
[本文引用: 1]
[11]
吕拉昌 , 辛晓华 , 陈东霞 . 城市创新基础设施空间格局与创新产出: 基于中国290个地级及以上城市的实证分析
[J]. 人文地理 , 2021 , 36 (4 ): 104 -113 , 125.
[本文引用: 1]
[Lv Lachang Xin Xiaohua Chen Dongxia . Urban innovation infrastructure and innovation output: An empirical analysis based on 290 cities at the prefecture level or above in China
Human Geography , 2021 , 36 (4 ): 104 -113 , 125.]
[本文引用: 1]
[12]
姚冠辉 , 郑晓年 . 面向“十四五”谋篇布局统筹推进创新基础设施建设
[J]. 中国科学院院刊 , 2020 , 35 (11 ): 1366 -1372 .
[本文引用: 1]
[Yao Guanhui Zheng Xiaonian . Structuring and organizing for 14th Five-year Plan, balancedly promoting the construction of innovation infrastructure
Bulletin of Chinese Academy of Sciences , 2020 , 35 (11 ): 1366 -1372 .]
[本文引用: 1]
[13]
伍先福 , 黄骁 , 钟鹏 . 新型基础设施建设与战略性新兴产业耦合协调发展测度及其耦合机制
[J]. 地理科学 , 2021 , 41 (11 ): 1969 -1979 .
DOI:10.13249/j.cnki.sgs.2021.11.010
[本文引用: 1]
利用2013—2018年中国30个省(市、区)数据,运用耦合协调模型对“新基建”发展水平及其与战略性新兴产业间的耦合协调度进行测度,结果发现:中国“新基建”及其三大子系统的发展水平均偏低,其中以“创新基建”发展水平最低;总体看,各省(市、区)的“新基建”与战略性新兴产业发展尚未达到良性耦合状态,且其失调风险趋于扩大;历年各省(市、区)的耦合协调发展存在“高者恒高、低者恒低”的锁定效应,并在数量分布上呈耦合水平两头区域少而中间区域多的“橄榄”形结构,且多数区域的“新基建”领先于其战略性新兴产业发展。分子系统来看,“信息基建”与战略性新兴产业耦合发展的锁定效应最强,“融合基建”与战略性新兴产业的耦合发展突破了“橄榄”形结构,“创新基建”与战略性新兴产业的耦合协调水平相对最低,而东部地区经济社会强省的3类耦合协调发展均具辐射引领效应。实证检验发现,除自身因素驱动效应外,经济集聚、人力资本、固定资产投资、产业结构、研发投入、市场化程度等能不同程度促进“新基建”与战略性新兴产业的耦合协调发展。
[Wu Xianfu Huang Xiao Zhong Peng . Measurement and coupling mechanism of the coupling and coordinated development of new infrastructure construction and strategic emerging industries
Scientia Geographica Sinica , 2021 , 41 (11 ): 1969 -1979 .]
DOI:10.13249/j.cnki.sgs.2021.11.010
[本文引用: 1]
Using the data of 30 provinces in China (Excluding Tibet, Hong Kong, Macao and Taiwan) from 2013 to 2018, the coupling coordination model was used to measure the development level of ‘new infrastructure’ and the coupling coordination degree between ‘new infrastructure’ and strategic emerging industries. The results showed that the development level of ‘new infrastructure’ and its three subsystems was relatively low, and the development level of innovative infrastructure was relatively the lowest. In general, the development of ‘new infrastructure’ and strategic emerging industries in various provinces has not yet reached a benign coupling state, and the risk of imbalance tends to expand. There was a lock-in effect of ‘the high was always high, the low was always low’ about the coupled and coordinated development of various provinces over the years, and the number distribution showed an ‘olive’ structure with fewer provinces at the two ends and more provinces in the middle, and then the ‘new infrastructure’ of most provinces leaded the development of their strategic emerging industries. From a molecular system perspective, the locking effect of the coupled development of ‘information infrastructure’ and strategic emerging industries was the strongest. The coupled development of ‘integrated infrastructure’ and strategic emerging industries had broken through the ‘olive’ structure, and the level of coupling and coordination of industries on ‘innovative infrastructure’ and strategic emerging industries was relatively lowest, while the three types of coupling and coordinated development of strong economic and social provinces in the eastern region all had radiation leading effects. Through further empirical testing, the article found that in addition to the driving effects of its own factors, economic agglomeration, human capital, fixed asset investment, industrial structure, R&D investment, and degree of marketization could promote the coupling and coordinated development of ‘new infrastructure’ and strategic emerging industries to varying degrees.
[14]
Wang S H . Fuzzy evaluations applied in analysis of infrastructure development based on national competitiveness perspectives
[J]. Journal of Economic Policy Reform , 2014 , 17 (2 ): 178 -200 .
DOI:10.1080/17487870.2013.802543
URL
[本文引用: 1]
[15]
Chen Z H Haynes K E . Multilevel assessment of public transportation infrastructure: A spatial econometric computable general equilibrium approach
[J]. The Annals of Regional Science , 2015 , 54 (3 ): 663 -685 .
DOI:10.1007/s00168-015-0671-3
URL
[本文引用: 1]
[16]
陈银娥 , 孙琼 . 中国基础设施发展水平测算及影响因素: 基于省级面板数据的实证研究
[J]. 经济地理 , 2016 , 36 (8 ): 23 -30 .
[本文引用: 2]
[Chen Yin'e Sun Qiong . A study on calculation of development of China's infrastructure and its influencing factors: The emprical research based on provincial panel data
Economic Geography , 2016 , 36 (8 ): 23 -30 .]
[本文引用: 2]
[17]
黄金川 , 黄武强 , 张煜 . 中国地级以上城市基础设施评价研究
[J]. 经济地理 , 2011 , 31 (1 ): 47 -54 .
[本文引用: 1]
[Huang Jin-chuan Huang Wuqiang Zhang Yu . Study on infrastructure assessment of cities in China
Economic Geography , 2011 , 31 (1 ): 47 -54 .]
DOI:10.2307/142410
URL
[本文引用: 1]
[18]
肖凡 , 任建造 , 伍敏冬 , 等 . 21世纪以来中国高新技术企业的时空分布和影响机制
[J]. 经济地理 , 2018 , 38 (2 ): 27 -35 .
[本文引用: 1]
[Xiao Fan Ren Jianzao Wu Mindong , et al . The spatiotemporal evolution and the influence mechanism of high-tech enterprise locations in China during the twenty-first century
Economic Geography , 2018 , 38 (2 ): 27 -35 .]
[本文引用: 1]
[19]
古恒宇 , 肖凡 , 沈体雁 , 等 . 中国城市流动人口居留意愿的地区差异与影响因素: 基于2015年流动人口动态监测数据
[J]. 经济地理 , 2018 , 38 (11 ): 22 -29 .
[本文引用: 1]
[Gu Hengyu Xiao Fan Shen Tiyan , et al . Spatial difference and influencing factors of settlement intention of urban floating population in China: Evidence from the 2015 national migrant population dynamic monitoring survey
Economic Geography , 2018 , 38 (11 ): 22 -29 .]
[本文引用: 1]
[20]
赵璐 , 赵作权 . 基于特征椭圆的中国经济空间分异研究
[J]. 地理科学 , 2014 , 34 (8 ): 979 -986 .
DOI:10.13249/j.cnki.sgs.2014.08.979
[本文引用: 1]
根据克鲁格曼的“两个自然”理论,运用空间统计SDE方法,在GIS技术的支持下,基于中国国土空间特征椭圆系列——国土均衡分布椭圆、国土地形分布椭圆、人口分布椭圆等,在空间上定量刻画了中国经济空间分异的基本特征,并为分析经济空间分异提供了新的方法参考。主要结论如下:① 在“两个自然”的分异作用下,中国经济空间分异主要以东-西方向为主。相对于国土均衡分布椭圆,国土地形分布椭圆明显偏西,长、短轴均明显减小,这反映出中国高地势主要集中分布在西部;中国人口空间分布靠近东部地区,其椭圆长、短轴长度均显著减小,充分表现出了经济活动的空间分异特征和空间聚集特征;② 国土地形等“第一自然”要素对社会经济活动的控制作用显著。人口分布椭圆对于地形分布椭圆的空间分异系数为89.55%,其93%的空间展布范围位于胡焕庸线的东南,且分布轴线基本与胡焕庸线平行;③ 在“第二自然”聚集机制的作用下,中国城市体系人口、GDP主体集中在胡焕庸线东南方约20%的大陆国土面积上,且二者之间也存在着明显的空间差异。从“第一自然”要素的空间分异和控制作用来看,胡焕庸线以西地区,特别是西北侧地区发展经济、集聚人口的功能较弱。同时,由于区域发展的内在核心动力聚集机制的空间差异性,区域发展的过程也呈现不平衡的特征。从兼顾效率和公平的角度出发,可通过重点培育人口分布较为集中的成渝城市群、关中城市群等中西部经济增长极拉动中国经济增长和市场空间向中西部发展;可通过制定相关政策吸引人口向GDP分布椭圆北部地区流动、聚集,发挥人口的红利作用,推进经济增长由南向北发展。
[Zhao Lu Zhao Zuoquan . Projecting the spatial variation of economic based on the specific ellipses in China
Scientia Geographica Sinica , 2014 , 34 (8 ): 979 -986 .]
DOI:10.13249/j.cnki.sgs.2014.08.979
[本文引用: 1]
:This study described the spatial variation in China spatial explicitly through a series of ellipses according to Krugman's "first and second natural" theory. The ellipse of national geometric profile in China was taken as the original state of spatial variation. The first nature variation could be explained through the ellipse of topographical distribution in China, and the second nature variation was represented by the spatial distribution of population. The results are as followings. 1)The spatial variation is mainly between the eastern and the western area in China. The spatial coverage of topographical distribution ellipse is in the west, and it is much smaller than the equilibrium distribution ellipse which is in accordance with the topographical characteristics that the west is higher than the east in China. The population distribution ellipse is mainly covering the North China Plain and the Middle and Lower Yangtze Valley Plain and its spatial coverage is much smaller. It is proved the spatial variation of the first nature and the spatial agglomeration of the second nature. 2)The spatial variation from the first natural factors is significant in China. 93% of the population distribution ellipse range is located in the southeast of Hu's line, and the main axis is almost parallel to Hu's line. The spatial variation index of population distribution ellipse to the topographical distribution ellipse is 89.55%. 3)For the prefectural-level cities, the population ellipse and GDP ellipse are aggregated in the southeast of Hu's line which is 20% of the mainland area in China. There is the spatial disparity between the population and GDP distribution. In general, the natural endowments between the east and west in China resulted in the unbalanced beginning of regional development. It is shown that the regions in the north of Hu's line, especially in the northwest area, is weak to gathering the population. Meanwhile, spatial differences of the agglomeration which is the inner core of the regional developing momentum present the unbalanced process of regional development. From the perspective of both efficiency and equity, the promotion of Chengdu-Chongqing, Guanzhong and other major economic zones which is with the large population is relatively could stimulate the economic growth in central and western China, and to attract the population concentration in the north part of GDP distribution ellipse could promote the economy development from the south to the north. In addition, Standard deviation ellipse method can not only subtly describe the spatial variation of the different features, but also can quantitatively analyze the extent of spatial variation, and it is proved to be a new method for reference to study the economic spatial variation.
[21]
曹贤忠 , 曾刚 . 基于熵权TOPSIS法的经济技术开发区产业转型升级模式选择研究: 以芜湖市为例
[J]. 经济地理 , 2014 , 34 (4 ): 13 -18 .
[本文引用: 1]
[Cao Xianzhong Zeng Gang . The mode of transformation and upgrading based on the Methods of entropy weight and TOPSIS in case of Wuhu economic and technological development zone
Economic Geography , 2014 , 34 (4 ): 13 -18 .]
[本文引用: 1]
[22]
Holtz-Eakin D . Public-sector capital and the productivity puzzle
[J]. The Review of Economics and Statistics , 1994 , 76 (1 ): 12 -21 .
DOI:10.2307/2109822
URL
[本文引用: 1]
[23]
Chen S T Kuo H I Chen C C . The relationship between GDP and electricity consumption in 10 Asian countries
[J]. Energy Policy , 2007 , 35 (4 ): 2611 -2621 .
DOI:10.1016/j.enpol.2006.10.001
URL
[本文引用: 1]
[24]
王鹏飞 , 李红波 . 基于产业结构关联视角的区域经济韧性作用机理研究: 以江苏省为例
[J]. 地理科学进展 , 2022 , 41 (2 ): 224 -238 .
DOI:10.18306/dlkxjz.2022.02.004
[本文引用: 1]
探讨经济韧性的作用机理有助于增强经济体对冲击的抵抗能力,并提高冲击后的复苏成效。因此,论文从自身对比的纵向角度剖析了江苏省经济韧性水平,并通过网络分析方法研究其多年投入产出表以明晰产业结构变化状况与经济韧性作用机理,得出以下结论:① 从自身对比的纵向角度而言,江苏省经济韧性在经济危机冲击中呈现出“高—低—中”的状态;② 核心行业及其关联占据了产业网络结构中的主要位置,通过刺激现有核心行业能够实现经济体的高韧性;③ 发掘并扩展新的经济增长点能有效提升经济系统的综合韧性,其内涵在于以更强的增长中和、弥补衰落;④ 经济韧性的作用机理可以理解为经济体在面对冲击时,通过放弃网络边缘行业以集中发展要素维系其核心行业架构的正常运转,传统核心行业的受损状态与新型行业成长速度共同决定了区域经济韧性发挥效果。
[Wang Pengfei Li Hongbo . Mechanism of regional economic resilience from the perspective of industrial structure relevance: Taking Jiangsu Province as an example
Progress in Geography , 2022 , 41 (2 ): 224 -238 .]
DOI:10.18306/dlkxjz.2022.02.004
[本文引用: 1]
Exploring the mechanism of regional economic resilience is of great significance for realizing the rapid recovery of the economy after shocks. As a major province of economic activities, Jiangsu Province's industrial structure changes are the epitome of China's economic transformation. An analysis of its resilience changes and the inherent logic can provide a reference for other provinces. This research analyzed the economic resilience level of Jiangsu Province based on a longitudinal comparison. It used network analysis methods to study the multi-year input-output table of the province to clarify the changes in industrial structure and the mechanism of economic resilience, and arrived at the following conclusions: 1) From the longitudinal perspective of self-comparison, the economic resilience of Jiangsu Province has shown a "high-low-medium" state in the face of the impact of economic crises. 2) Core industries and links occupy the main position in the industrial network structure. By stimulating the existing core industries to achieve high resilience of the economy, the essence lies in the interconnections between core industries to induce and drive the overall industrial structural change, but this strategy is difficult to maintain in the long run. 3) Discovering and expanding new economic growth points can effectively improve the overall resilience of the economic system. Its connotation is to neutralize and compensate for declines with stronger growth, thereby reducing the intensity of economic shocks and reducing the risks of subsequent industrial structural reforms. 4) The mechanism of economic resilience can be understood as that, in the face of shocks, an economy maintains the normal operation of its core industrial structure by abandoning network edge industries to concentrate development factors. The damage state of traditional core industries and the growth rate of new industries together determine the effect of regional economic resilience. This research provides a new perspective for regional economic resilience. Based on input-output data, it can effectively interpret regional development status and identify economic resilience.
[25]
王波 , 甄峰 , 谢金燕 , 等 . 智慧社会下的远程通勤: 基于全天和非全天在家办公选择及影响因素的分析
[J]. 地理科学 , 2021 , 41 (5 ): 788 -796 .
DOI:10.13249/j.cnki.sgs.2021.05.006
[本文引用: 1]
智慧社会下,信息与通信技术的快速发展降低工作的时空限制,丰富居民工作的时空间组织形式。从时间维度,划分全天和非全天在家办公2种在家办公形式,并以南京608位有互联网办公经历的全职就业者为研究对象,分析全天和非全天在家办公的实际选择和影响因素。研究发现: ① 虽然56.1%的受访者表示能够在家完成部分工作任务,但仅13.5%和30.4%的受访者表示在半个月内有全天和非全天在家办公经历,非全天在家办公相较于全天在家办公相对普遍。② 全天和非全天在家办公选择受到个人/家庭社会经济属性、互联网使用经历、工作主观态度、以及居住地建成环境的不同影响;不控制自选择因素(工作主观态度)的模型夸大建成环境对在家办公选择的影响。③ 在298次非全天办公经历中,有4.0%和71.1%的通勤发生上班和下班时间调整,非全天在家办公为缓解晚高峰交通拥堵提供有效的交通需求管理对策。
[Wang Bo Zhen Feng Xie Jinyan , et al . Telecommuting in the e-society: An empirical study of full-day and part-day home-based working adoption and influencing factors
Scientia Geographica Sinica , 2021 , 41 (5 ): 788 -796 .]
DOI:10.13249/j.cnki.sgs.2021.05.006
[本文引用: 1]
In the e-society, the advancement of information and communication technology has lowered the spatiotemporal constraints of working activities and thereby influencing the spatio-temporal patterns of working activities. From the perspective of time use on working, this study proposes two types of home-based telecommuting, namely, full-day and part-day home-based working. Using a survey of 608 full-time paid employees who had e-working experience in Nanjing, this study aims to analyze the actual choice of full-day and part-day home-based working during the last two weeks and their influencing factors. The findings demonstrate that although around 56.1% of respondents claim that they are able to work at home, however, only 13.5% and 30.4% of them had full-day and part-day home-based working experience. The part-day home-based working is more common than its counterpart in the e-society. Besides, we find that personal and household socio-demographic context, Internet use, residential built environment, and attitudes towards working, although with different impacts, have influenced the participation of full-day and part-day home-based working. Geographically, respondents living further away from the workplace but close to shopping centers tend to have full-day and part-day home-based working. Driving cars and living close to metro stations are significantly associated with a high probability of part-day home-based e-working, while its relationship with full-day home-based e-working is insignificant. The differences of the actual choice and influencing factors between full-day and part-day home-based working reveal the necessity of differentiating the two types of telecommuting. Moreover, both full-day and part-day home-based e-working hold the potential of alleviating the serious traffic jams by reducing long-distance commuting or spreading the evening peak hour traffic flow. 4.0% and 71.1% of commuting trips in part-day home-based working experiences have changed their departure time in the morning and evening, respectively. It is increasingly necessary to highlight the time use analysis in urban activity space research given both spatial and temporal fragmentation of people’s daily activities.
[26]
尹向来 , 黄彩虹 . 基础设施与城市化水平耦合协调关系演变: 基于285个地级市的实证研究
[J]. 世界地理研究 , 2018 , 27 (6 ): 77 -87 , 97.
[本文引用: 1]
[Yin Xianglai Huang Caihong . Research on the evolution of coupling and coordinating relationship between infrastructure and urbannization: Empirical analysis of China's 285 prefecture-level city
World Regional Studies , 2018 , 27 (6 ): 77 -87 , 97.]
[本文引用: 1]
[27]
高喆 , 顾朝林 , 顾江 . “新型城镇化”与“乡村振兴”场景下新基建对产业转型的启示
[J]. 经济地理 , 2021 , 41 (4 ): 8 -14 .
[本文引用: 1]
[Gao Zhe Gu Chaolin Gu Jiang . The enlightenment of new infrastructure to industrial transformation under the background of new urbanization and rural revitalization
Economic Geography , 2021 , 41 (4 ): 8 -14 .]
[本文引用: 1]
[28]
曹琳剑 , 王杰 , 王欢欢 , 等 . 京津冀基础设施建设与人口集聚耦合演进分析: 基于推拉理论解析
[J]. 地理科学 , 2019 , 39 (8 ): 1256 -1264 .
DOI:10.13249/j.cnki.sgs.2019.08.007
[本文引用: 1]
引入效用函数解析推拉理论,对系统发展模型、协调模型、耦合模型和相对发展度模型进行了改进并综合,构建了耦合-协调模型;分析了城市基础设施建设与人口集聚存在先促进后抑制的倒“U”形关系;对2006~2016年京津冀基础设施建设与人口集聚耦合的演进规律进行了解析。研究表明,基础设施建设与人口集聚两系统的发展指数、耦合度均呈现递增趋势,协同基础良好,耦合驱动潜力巨大;系统耦合由拮抗阶段趋向高水平耦合阶段发展;系统在时序上多处于同步发展状态,区域间耦合趋同基本实现;系统耦合度在空间分布存在差异性,并达到倒“U”形关系的顶峰;未来应着重考虑避免“城市病”问题的发生。
[Cao Linjian Wang Jie Wang Huanhuan , et al . Evolutional analysis of coupling between infrastructure and population agglomeration in Beijing-Tianjin-Hebei region: An analysis based on Push-pull theory
Scientia Geographica Sinica , 2019 , 39 (8 ): 1256 -1264 .]
DOI:10.13249/j.cnki.sgs.2019.08.007
[本文引用: 1]
By introducing utility function into the analysis of push-pull theory and drawing lessons from existing research, this article builts the coupling-coordination model to analyze the coupling between infrastructure and population agglomeration in Beijing-Tianjin-Hebei region based on the improvement and integration of the system development model, coordination model, coupling model and relative degree of development model. And the inverted U-shaped relationship between urban infrastructure construction and population agglomeration is analyzed; a comprehensive index system covering 11 aspects and 31 indicators of urban infrastructure construction and population agglomeration is constructed; an empirical analysis of the evolution laws of the coupling between infrastructure construction and population agglomeration in Beijing, Tianjin and Hebei region from 2006 to 2016 is made and an in-depth analysis of the characteristics of comprehensive development index, coupling status and coordinated development stage between the two systems is also part of the research. The research results reveal that the development index and coupling degree of the two systems, infrastructure construction and population agglomeration, show similar trend of increase, and there exists a good foundation for the coordinated development and a great coupling driving potential in Beijing, Tianjin and Hebei Region; the system coupling is developing from antagonistic stage to high-level coupling stage; the systems mostly develop synchronously in time sequence, and the inter-regional coupling degree is basically realized; there are differences in spatial distribution of system coupling degree which has reached the top of the inverted U-shaped relationship. In the future, we should focus on avoiding the occurrence of“urban diseases” and do more research on the two systems from the dynamic perspective.
[29]
袁航 , 朱承亮 . 国家高新区推动了中国产业结构转型升级吗
[J]. 中国工业经济 , 2018 (8 ): 60 -77 .
[本文引用: 1]
[Yuan Hang Zhu Chengliang . Do national high-tech zones promote the transformation and upgrading of China's industrial structure
China Industrial Economics , 2018 (8 ): 60 -77 .]
[本文引用: 1]
[30]
沈体雁 , 于瀚辰 . 空间计量经济学 [M]. 2版 . 北京 : 北京大学出版社 , 2019 .
[本文引用: 1]
[Shen Tiyan Yu Hanchen . Spatial econometrics . 2nd ed. Beijing, China : Peking University Press , 2019 .]
[本文引用: 1]
[31]
干春晖 , 郑若谷 , 余典范 . 中国产业结构变迁对经济增长和波动的影响
[J]. 经济研究 , 2011 , 46 (5 ): 4 -16 , 31.
[本文引用: 1]
[Gan Chunhui Zheng Ruogu Yu Dianfan . An empirical study on the effects of industrial structure on economic growth and fluctuations in China
Economic Research Journal , 2011 , 46 (5 ): 4 -16 , 31.]
[本文引用: 1]
[32]
宓泽锋 , 曾刚 . 本地知识基础对新兴产业知识流动的影响: 以中国燃料电池产业为例
[J]. 地理学报 , 2021 , 76 (4 ): 1006 -1018 .
DOI:10.11821/dlxb202104015
[本文引用: 1]
经济地理学者对于新兴产业的产生区位长期存在争论,在中美贸易战背景下,探究其区位规律既是重要的学科问题,又对国家培育新兴产业具有重要指导意义。通过梳理“区域产业分叉”和“区位机会窗口”的观点,辨析出知识流动是影响新兴产业区位的关键点;以燃料电池产业为例,结合“相关多样化”假说的观点,采用面板空间自回归模型对知识基础的具体影响进行测度,结论如下:① 北京、上海、大连是燃料电池技术创新的三大知识流动中心,各地区“增长极”城市间的强联系是当前知识流动的空间格局的基础,而地理邻近的作用并不显著;② 相关技术知识基础对知识吸收能力具有稳定且显著的积极作用,且除用工成本外的多数控制变量显著为正;而非相关技术知识基础在早期呈现显著负相关。正是由于早期不同知识基础与控制变量的不同作用,导致了既集中于发达城市、又具有一定自由度的空间格局。研究结果表明知识经济时代下,知识基础对创新的锚定效应明显,区域产业分叉出现的概率加大,区位机会窗口较难打开。③ 非相关多样化的作用会随着新兴产业技术的持续发展而产生变化,由早期的消极影响逐渐转变为积极影响,应从演化视角重新审视非相关多样化的作用。
[Mi Zefeng Zeng Gang . The impact of local knowledge base on knowledge low of emerging industry: A case of China's fuel cell industry
Acta Geographica Sinica , 2021 , 76 (4 ): 1006 -1018 .]
DOI:10.11821/dlxb202104015
[本文引用: 1]
Economic geographers have long argued about the location of emerging industry. Under the background of Sino-US trade war, exploring the location laws of emerging industries is not only a critical theoretical issue, but also has an important guiding significance for the country to cultivate emerging industry. Starting from the debate between "Regional Branching" and "Windows of Locational Opportunity", this paper identifies that knowledge flow is the key to affecting the location of emerging industry. According to the discussion of the relationship between variety and technological innovation in the related variety hypothesis, we use patent citation data to define related and unrelated variety. Then we use panel spatial autoregressive model to measure the specific impact of each factor in this paper. Finally, we can draw the following conclusions: (1) Beijing, Shanghai and Dalian are the three major knowledge flow centers of China's fuel cell industry. The strong connection between these "growth pole" cities is the basis of the current spatial pattern of knowledge flow, while the role of geographical proximity is not significant. (2) The related technology knowledge base has a stable and significant positive effect on knowledge absorption capacity, and most of the control variables are significantly positive except labor cost. The unrelated technology knowledge base has a significant negative impact in the early stage (the regression coefficient in the first stage was -0.038). Because of the different roles of different knowledge bases and control variables in the early stage (more positive effects and less negative effects), the overall spatial pattern is not only concentrated in the developed cities, but also has some freedom. The research results show that the anchoring effect of knowledge base on innovation is obvious, so "Regional Branching" is more likely to appear in the era of knowledge economy. (3) The impact of unrelated variety has gradually changed from negative in the early stage (-0.038) to positive in the final stage (0.079), which shows that the role of unrelated variety may change with the technological development of emerging industry. We should re-examine the role of unrelated variety from an evolutionary perspective.
[33]
王腾飞 , 谷人旭 , 马仁锋 , 等 . “集聚—扩散”视角下中国区域创新极及其知识溢出区位
[J]. 经济地理 , 2021 , 41 (5 ): 11 -18 , 185.
[本文引用: 1]
[Wang Tengfei Gu Renxu Ma Renfeng , et al . Regional innovation pole and its location of knowledge spillovers in China from the perspective of "agglomeration diffusion"
Economic Geography , 2021 , 41 (5 ): 11 -18 , 185.]
[本文引用: 1]
[34]
丁任重 , 许渤胤 , 张航 . 城市群能带动区域经济增长吗? 基于7个国家级城市群的实证分析
[J]. 经济地理 , 2021 , 41 (5 ): 37 -45 .
[本文引用: 1]
[Ding Renzhong Xu Boyin Zhang Hang . Can urban agglomeration drive regional economic growth? Empirical analysis based on seven state-level urban agglomerations
Economic Geography , 2021 , 41 (5 ): 37 -45 .]
[本文引用: 1]
[35]
LeSage J Pace R K . Introduction to spatial econometrics [M]. New York, USA : CRC Press , 2009 .
[本文引用: 1]
[36]
潘为华 , 贺正楚 , 潘红玉 . 中国数字经济发展的时空演化和分布动态
[J]. 中国软科学 , 2021 (10 ): 137 -147 .
[本文引用: 1]
[Pan Weihua He Zhengchu Pan Hongyu . Research on spatiotemporal evolution and distribution dynamics of digital economy development in China
China Soft Science , 2021 (10 ): 137 -147 .]
[本文引用: 1]
[37]
张佩 , 赵作权 . 世界级先进制造业集群竞争力提升机制及启示: 以德国工业4.0旗舰集群为例
[J]. 区域经济评论 , 2020 (5 ): 131 -139 .
[本文引用: 1]
[Zhang Pei Zhao Zuoquan . Competitiveness improvement mechanisms of world-class advanced manufacturing clusters and their implications: Taken the German industry 4.0 flagship cluster as an example
Regional Economic Review , 2020 (5 ): 131 -139 .]
[本文引用: 1]
[38]
刘秉镰 , 朱俊丰 . 区域市场分割的影响因素及其空间邻近效应分析: 基于1989—2014年中国省际面板数据
[J]. 经济地理 , 2018 , 38 (10 ): 36 -45 .
[本文引用: 1]
[Liu Binglian Zhu Junfeng . The analysis on the influencing factors of regional market segmentation and its spatial neighbor effects: Based on the panel data of China's provinces in 1989-2014
Economic Geography , 2018 , 38 (10 ): 36 -45 .]
[本文引用: 1]
[39]
焦敬娟 , 王姣娥 , 程珂 . 中国区域创新能力空间演化及其空间溢出效应
[J]. 经济地理 , 2017 , 37 (9 ): 11 -18 .
[本文引用: 1]
[Jiao Jingjuan Wang Jiao'e Cheng Ke . Spatial-temporal evolution and spillover effects of regional innovation ability in China
Economic Geography , 2017 , 37 (9 ): 11 -18 .]
[本文引用: 1]
[40]
郭杰 , 王珺 , 姜璐 , 等 . 从技术中心主义到人本主义: 智慧城市研究进展与展望
[J]. 地理科学进展 , 2022 , 41 (3 ): 488 -498 .
DOI:10.18306/dlkxjz.2022.03.011
[本文引用: 1]
随着5G网络、物联网、云计算、大数据分析、地理信息系统等新技术的兴起,探索更具包容性和创新潜力的参与式治理,引导高效的技术研发与运用,实现城市“以地方现实为基础、以社会需求为导向”的智慧化转型,已成为国内外城市地理学的重要与前沿议题。人本主义视角下的智慧城市研究,为地理学者介入这一领域提供了理论工具。不同于技术中心主义将智慧城市视作由数字技术构成的物理空间集合,人本主义强调特定情境下的技术、社会(人文治理)与空间的互动。该视角呼吁对多方行动者参与技术研发、基础设施建设与治理决策的合作互动开展微观研究,以揭示智慧城市的共建过程与地方性驱动机制。论文梳理了国内外人本主义研究的最新进展,认为该视角下的研究仍然沿袭“技术中心”或采用与之对立的“知识中心”立场,而缺少技术—社会互动的视角来理解城市智慧化转型。论文提出未来值得深入探讨的议题,即技术与社会(治理)的共生性、围绕技术研发的社会关系互动复杂性、技术研发与关系互动的语境化分析。探讨以上议题有助于理解智慧城市如何作为一个复杂地域系统,在人与技术的持续互动中发生转型,也可为未来中国相关研究提供理论借鉴。
[Guo Jie Wang Jun Jiang Lu , et al . From technocentrism to humanism: Progress and prospects of smart city research
Progress in Geography , 2022 , 41 (3 ): 488 -498 .]
DOI:10.18306/dlkxjz.2022.03.011
[本文引用: 1]
With the implementation of new technologies such as 5G networks, the Internet of Things, cloud computing, big data analysis, and so on, inclusive and innovative governance and efficient innovation and application of technologies that lead cities towards smartness have become crucial and frontier topics of exploration in current international urban geography. The study of smart cities from the perspective of humanism provides an effective theoretical tool for geographiers in this field. Different from the perspective of technocentrism that regards smart cities as a collection of physical spaces composed of a communication infrastructure network and digital technology, the humanism perspective emphasizes the interaction of technology, humanistic governance (society), and space in a specific (local) context. It calls for a micro-survey of the local cooperation mechanism of information and communication technology (ICT) innovation and smart city construction, as well as governance decision making carried out by multiple actors, with a view to revealing the construction process and localized driving mechanism of smart cities, and with an emphasis on the data analysis of individual actions to find out a development path consistent with local conditions. This study examined the latest developments in humanistic research on smart cities, arguing that current studies still follow the technocentric perspective or adopt the opposite knowledge-centric position, but lack a technology-society synergy perspective. On this basis, this article proposes future research topics that are worthy of in-depth discussion, namely, the symbiosis of technology and society, the complexity of social interactions on technology innovation, and the contextual analysis of technology innovation and interactions. Our discussion may help to understand how smart cities, as a complex human-environment system, undergo transformation in the continuous interaction of people and technology, and provide some theoretical references for the study of smart cities in China.
以“新基建”为牵引促进东北地区融合创新发展
2
2021
... 目前,学术界在新基建领域已经积累了一定的成果,但主要集中于顶层设计角度的策略布局[1 ⇓ -3 ] .虽然有学者从描述统计角度分析了中国新基建发展现状[4 ] ,但并未直观展现出中国新基建的空间格局,对其综合量化评价方面更显不足.尽管如此,按照国家发展和改革委员会(简称“发改委”)对新基建包含信息基建、融合基建和创新基建等3个方面的权威解读[4 ] ,学术界在这3个方面的量化评价已经开展了大量研究.其中,在信息基建评价方面,主要使用固定电话、移动电话、互联网和邮电业务或信息基建领域中的相关专利数据等指标[5 -6 ] ;在融合基建评价方面,已有研究针对智慧能源或智慧交通多采用定性评价,而在智慧城市和智慧产业等领域也有学者构建了综合评价指标[7 -8 ] ,但多数指标仍采用互联网和电信业务等信息基建的内容;在创新基建评价方面,部分采用政策解读或案例解析的定性方法[9 ] ,也有学者采用研发支出等系列指标来综合评价创新基建质量[10 ] .如吕拉昌等[11 ] 采用国家重大科技基础设施、科教基础设施、产业技术创新基础设施等指标进行衡量,基本吻合了新基建中创新基建的内容[12 ] .除此之外,亦有学者尝试基于新基建3个方面对其做出综合评价[13 ] ,但所选指标并未体现新基建“新”的特征.在妥善选取新基建综合评价指标的基础上,对其综合评价的方法和驱动因素分析可以借鉴传统基建[14 ⇓ ⇓ -17 ] ,毕竟前者相对后者存在着继承与发展的关系[4 ] . ...
... 影响新基建发展的因素众多,为了确保核心因素不被遗漏,同时兼顾数据的可获得性,本文基于已有研究成果来选择新基建发展的驱动因素.第一,经济发展水平较高的国家往往更具有增加基础设施投资的动机[22 ] ,因为经济发展会提高基础设施的需求与供给能力[23 ] ,那么经济发展必定会增加新基建投资,更有能力维护、升级或改造传统基建;第二,产业结构可能会影响新基建的需求[24 ] ,因为工业互联网、物联网、云计算等新型基建将助力智慧产业的形成及运营[8 ] ,如智慧社会下的远程办公等[25 ] ;第三,任何基建的发展都需要足额的资金支撑,而且已有研究表明,金融发展水平是基础设施发展的影响因素[16 ] ,而需要较大投资规模的新基建自然离不开优良金融发展水平的加持;第四,新基建与新技术革命前沿紧密结合,以技术创新为驱动[1 ] ,所以创新基础也有可能是新基建发展的重要驱动力;第五,基础设施与城市化密切相关[26 ] ,农村人口转移到城市将增加配套基础设施的需求,拉动基础设施的投资[27 -28 ] ,因而城市化进程也可能影响新基建的发展;最后,人口规模可能对新基建发展产生影响,因为人口规模和基础设施的市场需求密切相关,人口规模越大对基础设施的需求往往越大.综上所述,本文将选择经济发展水平、产业结构高度化、产业结构合理化、金融发展水平、创新基础、城市化进程、人口规模等变量来探讨新基建发展水平的驱动因素,具体计算方法见表2 . ...
面向智慧社会的“新基建”及其政策取向
1
2020
... 目前,学术界在新基建领域已经积累了一定的成果,但主要集中于顶层设计角度的策略布局[1 ⇓ -3 ] .虽然有学者从描述统计角度分析了中国新基建发展现状[4 ] ,但并未直观展现出中国新基建的空间格局,对其综合量化评价方面更显不足.尽管如此,按照国家发展和改革委员会(简称“发改委”)对新基建包含信息基建、融合基建和创新基建等3个方面的权威解读[4 ] ,学术界在这3个方面的量化评价已经开展了大量研究.其中,在信息基建评价方面,主要使用固定电话、移动电话、互联网和邮电业务或信息基建领域中的相关专利数据等指标[5 -6 ] ;在融合基建评价方面,已有研究针对智慧能源或智慧交通多采用定性评价,而在智慧城市和智慧产业等领域也有学者构建了综合评价指标[7 -8 ] ,但多数指标仍采用互联网和电信业务等信息基建的内容;在创新基建评价方面,部分采用政策解读或案例解析的定性方法[9 ] ,也有学者采用研发支出等系列指标来综合评价创新基建质量[10 ] .如吕拉昌等[11 ] 采用国家重大科技基础设施、科教基础设施、产业技术创新基础设施等指标进行衡量,基本吻合了新基建中创新基建的内容[12 ] .除此之外,亦有学者尝试基于新基建3个方面对其做出综合评价[13 ] ,但所选指标并未体现新基建“新”的特征.在妥善选取新基建综合评价指标的基础上,对其综合评价的方法和驱动因素分析可以借鉴传统基建[14 ⇓ ⇓ -17 ] ,毕竟前者相对后者存在着继承与发展的关系[4 ] . ...
“新基建”赋能中国经济高质量发展的路径研究
2
2020
... 目前,学术界在新基建领域已经积累了一定的成果,但主要集中于顶层设计角度的策略布局[1 ⇓ -3 ] .虽然有学者从描述统计角度分析了中国新基建发展现状[4 ] ,但并未直观展现出中国新基建的空间格局,对其综合量化评价方面更显不足.尽管如此,按照国家发展和改革委员会(简称“发改委”)对新基建包含信息基建、融合基建和创新基建等3个方面的权威解读[4 ] ,学术界在这3个方面的量化评价已经开展了大量研究.其中,在信息基建评价方面,主要使用固定电话、移动电话、互联网和邮电业务或信息基建领域中的相关专利数据等指标[5 -6 ] ;在融合基建评价方面,已有研究针对智慧能源或智慧交通多采用定性评价,而在智慧城市和智慧产业等领域也有学者构建了综合评价指标[7 -8 ] ,但多数指标仍采用互联网和电信业务等信息基建的内容;在创新基建评价方面,部分采用政策解读或案例解析的定性方法[9 ] ,也有学者采用研发支出等系列指标来综合评价创新基建质量[10 ] .如吕拉昌等[11 ] 采用国家重大科技基础设施、科教基础设施、产业技术创新基础设施等指标进行衡量,基本吻合了新基建中创新基建的内容[12 ] .除此之外,亦有学者尝试基于新基建3个方面对其做出综合评价[13 ] ,但所选指标并未体现新基建“新”的特征.在妥善选取新基建综合评价指标的基础上,对其综合评价的方法和驱动因素分析可以借鉴传统基建[14 ⇓ ⇓ -17 ] ,毕竟前者相对后者存在着继承与发展的关系[4 ] . ...
... 尽管新基建自提出以来便引起了社会各界的高度关注,但截至目前并未形成统一的理解和认识.央视新闻曾在2019年3月2日的报道中提出,新基建包括5G、特高压、城际高速铁路和城际轨道交通、新能源汽车充电桩、大数据中心、人工智能、工业互联网等7大领域① (① http://jingji.cctv.com/2019/03/02/ARTIvuyfQ1gT9p5T0pXTWTkv190302.shtml?spm=C87458.PxZ1sQfyXDLK.S83118.3 .).到2020年4月,国家发改委对新基建做出了详细解读,认为新基建包括信息基础设施、融合基础设施和创新基础设施等3个方面的内容,其中:信息基础设施主要包括5G、物联网、工业互联网、卫星互联网等通信网络基础设施,人工智能、云计算、区块链等新技术基础设施和数据中心、智能计算中心等算力基础设施;融合基础设施主要包括智能交通基础设施和智慧能源基础设施等;创新基础设施主要包括重大科技基础设施、科教基础设施、产业技术创新基础设施等.虽然“七领域说”因特高压输电、城市地铁等已建设多年而受到质疑,但新基建并不一定是新的基建,而是与传统基建存在继承与发展的关系[3 -4 ] .此外,新基建在新冠疫情防控中发挥的作用有目共睹,诸如健康码、线上会议、智慧生活等配套设施的建立. ...
中国“新基建”: 概念、现状与问题
5
2020
... 目前,学术界在新基建领域已经积累了一定的成果,但主要集中于顶层设计角度的策略布局[1 ⇓ -3 ] .虽然有学者从描述统计角度分析了中国新基建发展现状[4 ] ,但并未直观展现出中国新基建的空间格局,对其综合量化评价方面更显不足.尽管如此,按照国家发展和改革委员会(简称“发改委”)对新基建包含信息基建、融合基建和创新基建等3个方面的权威解读[4 ] ,学术界在这3个方面的量化评价已经开展了大量研究.其中,在信息基建评价方面,主要使用固定电话、移动电话、互联网和邮电业务或信息基建领域中的相关专利数据等指标[5 -6 ] ;在融合基建评价方面,已有研究针对智慧能源或智慧交通多采用定性评价,而在智慧城市和智慧产业等领域也有学者构建了综合评价指标[7 -8 ] ,但多数指标仍采用互联网和电信业务等信息基建的内容;在创新基建评价方面,部分采用政策解读或案例解析的定性方法[9 ] ,也有学者采用研发支出等系列指标来综合评价创新基建质量[10 ] .如吕拉昌等[11 ] 采用国家重大科技基础设施、科教基础设施、产业技术创新基础设施等指标进行衡量,基本吻合了新基建中创新基建的内容[12 ] .除此之外,亦有学者尝试基于新基建3个方面对其做出综合评价[13 ] ,但所选指标并未体现新基建“新”的特征.在妥善选取新基建综合评价指标的基础上,对其综合评价的方法和驱动因素分析可以借鉴传统基建[14 ⇓ ⇓ -17 ] ,毕竟前者相对后者存在着继承与发展的关系[4 ] . ...
... [4 ],学术界在这3个方面的量化评价已经开展了大量研究.其中,在信息基建评价方面,主要使用固定电话、移动电话、互联网和邮电业务或信息基建领域中的相关专利数据等指标[5 -6 ] ;在融合基建评价方面,已有研究针对智慧能源或智慧交通多采用定性评价,而在智慧城市和智慧产业等领域也有学者构建了综合评价指标[7 -8 ] ,但多数指标仍采用互联网和电信业务等信息基建的内容;在创新基建评价方面,部分采用政策解读或案例解析的定性方法[9 ] ,也有学者采用研发支出等系列指标来综合评价创新基建质量[10 ] .如吕拉昌等[11 ] 采用国家重大科技基础设施、科教基础设施、产业技术创新基础设施等指标进行衡量,基本吻合了新基建中创新基建的内容[12 ] .除此之外,亦有学者尝试基于新基建3个方面对其做出综合评价[13 ] ,但所选指标并未体现新基建“新”的特征.在妥善选取新基建综合评价指标的基础上,对其综合评价的方法和驱动因素分析可以借鉴传统基建[14 ⇓ ⇓ -17 ] ,毕竟前者相对后者存在着继承与发展的关系[4 ] . ...
... [4 ]. ...
... 尽管新基建自提出以来便引起了社会各界的高度关注,但截至目前并未形成统一的理解和认识.央视新闻曾在2019年3月2日的报道中提出,新基建包括5G、特高压、城际高速铁路和城际轨道交通、新能源汽车充电桩、大数据中心、人工智能、工业互联网等7大领域① (① http://jingji.cctv.com/2019/03/02/ARTIvuyfQ1gT9p5T0pXTWTkv190302.shtml?spm=C87458.PxZ1sQfyXDLK.S83118.3 .).到2020年4月,国家发改委对新基建做出了详细解读,认为新基建包括信息基础设施、融合基础设施和创新基础设施等3个方面的内容,其中:信息基础设施主要包括5G、物联网、工业互联网、卫星互联网等通信网络基础设施,人工智能、云计算、区块链等新技术基础设施和数据中心、智能计算中心等算力基础设施;融合基础设施主要包括智能交通基础设施和智慧能源基础设施等;创新基础设施主要包括重大科技基础设施、科教基础设施、产业技术创新基础设施等.虽然“七领域说”因特高压输电、城市地铁等已建设多年而受到质疑,但新基建并不一定是新的基建,而是与传统基建存在继承与发展的关系[3 -4 ] .此外,新基建在新冠疫情防控中发挥的作用有目共睹,诸如健康码、线上会议、智慧生活等配套设施的建立. ...
... 此外,为了更好地体现各影响因素空间溢出的方向和大小,本文借鉴LeSage等[35 ] 的做法,根据拟合优度较好的时间固定效应SDM模型估计结果,求得偏微分进而估计各影响因素对新基建发展水平的直接影响和间接影响,结果见表5 .其中,经济发展水平(PGDP)对新基建发展水平的直接效应和总效应显著为正,表明经济发展对新基建发展的正向作用主要来源于本地,原因可能在于新基建的发展需要本地拥有足够的经济实力,同时地区经济发展,特别是在当前逐渐向数字经济转型的过程中又加大了对新基建的需求[36 ] ;产业结构高度化(AIS1)对新基建发展水平的直接效应显著为正,间接效应和总效应均未通过显著性水平检验,说明产业结构对新基建发展的影响集中体现于本地,原因主要在于本地区的产业结构决定着新基建的布局与发展方向,如工业为主的地区转型升级过程中会增加对工业互联网等新型基础设施的需求[37 ] ;产业结构合理化(AIS2)对新基建发展水平的直接效应和总效应均通过了1%的显著性水平检验,且方向为正,而其间接效应未通过显著性水平检验,表明产业结构合理化对新基建发展水平的影响主要来自本地,原因可能在于行政区划和市场分割等因素不利于跨区域的产业协调和资源流动[38 ] ,从而导致周边地区产业结构合理化对新基建的促进作用不明显;金融发展水平(FD)对新基建发展水平的直接效应和总效应均通过了显著性水平检验,方向均为正,表明金融发展水平对新基建建设的影响主要来自于本地,原因可能在于新基建的发展对资金的需求往往较大,需要大量的投融资,但由于当前关键核心技术能力不足、技术路线不确定、网络和信息安全、投融资机制不畅等问题的存在[4 ] ,导致周边地区金融能力对本地新基建发展的促进作用不明显;创新基础(INNO)对新基建发展水平的直接、间接和总效应均通过了显著性水平检验,表明区域内及周边地区创新基础均对本区域新基建发展具有积极影响,原因可能在于创新基础是人工智能、物联网、区块链等新型基础设施建设与维护的必要条件,而且创新又具有明显的溢出效应[39 ] ;城市化进程(UP)对新基建发展水平的直接效应和间接效应均通过了显著性水平检验,但两者的方向相反,证明了城市化进程对本地新基建发展有促进作用,而周边区域城市化进程对本地新基建发展具有抑制作用,即城市化进程主要以虹吸原理推进新基建发展,原因主要在于中国城市的智慧化转型加大了新基建的需求[40 ] ,而本地城市化进程对新基建的需求往往只需要在本地进行满足;人口规模(POP)对新基建发展水平的直接效应和间接效应均通过了1%的显著性水平检验,但直接效应的方向为正,间接效应的方向为负,进一步验证了人口规模与新基建的发展密切相关,人口规模越大越有利于新基建的发展,原因可能在于出于集约化考虑,新基建的建设更倾向于人口规模较大的区域. ...
Information and communications technology infrastructure and firm growth: An empirical study of China's cities
1
2021
... 目前,学术界在新基建领域已经积累了一定的成果,但主要集中于顶层设计角度的策略布局[1 ⇓ -3 ] .虽然有学者从描述统计角度分析了中国新基建发展现状[4 ] ,但并未直观展现出中国新基建的空间格局,对其综合量化评价方面更显不足.尽管如此,按照国家发展和改革委员会(简称“发改委”)对新基建包含信息基建、融合基建和创新基建等3个方面的权威解读[4 ] ,学术界在这3个方面的量化评价已经开展了大量研究.其中,在信息基建评价方面,主要使用固定电话、移动电话、互联网和邮电业务或信息基建领域中的相关专利数据等指标[5 -6 ] ;在融合基建评价方面,已有研究针对智慧能源或智慧交通多采用定性评价,而在智慧城市和智慧产业等领域也有学者构建了综合评价指标[7 -8 ] ,但多数指标仍采用互联网和电信业务等信息基建的内容;在创新基建评价方面,部分采用政策解读或案例解析的定性方法[9 ] ,也有学者采用研发支出等系列指标来综合评价创新基建质量[10 ] .如吕拉昌等[11 ] 采用国家重大科技基础设施、科教基础设施、产业技术创新基础设施等指标进行衡量,基本吻合了新基建中创新基建的内容[12 ] .除此之外,亦有学者尝试基于新基建3个方面对其做出综合评价[13 ] ,但所选指标并未体现新基建“新”的特征.在妥善选取新基建综合评价指标的基础上,对其综合评价的方法和驱动因素分析可以借鉴传统基建[14 ⇓ ⇓ -17 ] ,毕竟前者相对后者存在着继承与发展的关系[4 ] . ...
Information infrastructure and air pollution: Empirical analysis based on data from Chinese cities
1
2022
... 目前,学术界在新基建领域已经积累了一定的成果,但主要集中于顶层设计角度的策略布局[1 ⇓ -3 ] .虽然有学者从描述统计角度分析了中国新基建发展现状[4 ] ,但并未直观展现出中国新基建的空间格局,对其综合量化评价方面更显不足.尽管如此,按照国家发展和改革委员会(简称“发改委”)对新基建包含信息基建、融合基建和创新基建等3个方面的权威解读[4 ] ,学术界在这3个方面的量化评价已经开展了大量研究.其中,在信息基建评价方面,主要使用固定电话、移动电话、互联网和邮电业务或信息基建领域中的相关专利数据等指标[5 -6 ] ;在融合基建评价方面,已有研究针对智慧能源或智慧交通多采用定性评价,而在智慧城市和智慧产业等领域也有学者构建了综合评价指标[7 -8 ] ,但多数指标仍采用互联网和电信业务等信息基建的内容;在创新基建评价方面,部分采用政策解读或案例解析的定性方法[9 ] ,也有学者采用研发支出等系列指标来综合评价创新基建质量[10 ] .如吕拉昌等[11 ] 采用国家重大科技基础设施、科教基础设施、产业技术创新基础设施等指标进行衡量,基本吻合了新基建中创新基建的内容[12 ] .除此之外,亦有学者尝试基于新基建3个方面对其做出综合评价[13 ] ,但所选指标并未体现新基建“新”的特征.在妥善选取新基建综合评价指标的基础上,对其综合评价的方法和驱动因素分析可以借鉴传统基建[14 ⇓ ⇓ -17 ] ,毕竟前者相对后者存在着继承与发展的关系[4 ] . ...
中国智慧城市发展水平空间差异研究
1
2017
... 目前,学术界在新基建领域已经积累了一定的成果,但主要集中于顶层设计角度的策略布局[1 ⇓ -3 ] .虽然有学者从描述统计角度分析了中国新基建发展现状[4 ] ,但并未直观展现出中国新基建的空间格局,对其综合量化评价方面更显不足.尽管如此,按照国家发展和改革委员会(简称“发改委”)对新基建包含信息基建、融合基建和创新基建等3个方面的权威解读[4 ] ,学术界在这3个方面的量化评价已经开展了大量研究.其中,在信息基建评价方面,主要使用固定电话、移动电话、互联网和邮电业务或信息基建领域中的相关专利数据等指标[5 -6 ] ;在融合基建评价方面,已有研究针对智慧能源或智慧交通多采用定性评价,而在智慧城市和智慧产业等领域也有学者构建了综合评价指标[7 -8 ] ,但多数指标仍采用互联网和电信业务等信息基建的内容;在创新基建评价方面,部分采用政策解读或案例解析的定性方法[9 ] ,也有学者采用研发支出等系列指标来综合评价创新基建质量[10 ] .如吕拉昌等[11 ] 采用国家重大科技基础设施、科教基础设施、产业技术创新基础设施等指标进行衡量,基本吻合了新基建中创新基建的内容[12 ] .除此之外,亦有学者尝试基于新基建3个方面对其做出综合评价[13 ] ,但所选指标并未体现新基建“新”的特征.在妥善选取新基建综合评价指标的基础上,对其综合评价的方法和驱动因素分析可以借鉴传统基建[14 ⇓ ⇓ -17 ] ,毕竟前者相对后者存在着继承与发展的关系[4 ] . ...
中国智慧产业发展水平综合评价与时空特征
2
2017
... 目前,学术界在新基建领域已经积累了一定的成果,但主要集中于顶层设计角度的策略布局[1 ⇓ -3 ] .虽然有学者从描述统计角度分析了中国新基建发展现状[4 ] ,但并未直观展现出中国新基建的空间格局,对其综合量化评价方面更显不足.尽管如此,按照国家发展和改革委员会(简称“发改委”)对新基建包含信息基建、融合基建和创新基建等3个方面的权威解读[4 ] ,学术界在这3个方面的量化评价已经开展了大量研究.其中,在信息基建评价方面,主要使用固定电话、移动电话、互联网和邮电业务或信息基建领域中的相关专利数据等指标[5 -6 ] ;在融合基建评价方面,已有研究针对智慧能源或智慧交通多采用定性评价,而在智慧城市和智慧产业等领域也有学者构建了综合评价指标[7 -8 ] ,但多数指标仍采用互联网和电信业务等信息基建的内容;在创新基建评价方面,部分采用政策解读或案例解析的定性方法[9 ] ,也有学者采用研发支出等系列指标来综合评价创新基建质量[10 ] .如吕拉昌等[11 ] 采用国家重大科技基础设施、科教基础设施、产业技术创新基础设施等指标进行衡量,基本吻合了新基建中创新基建的内容[12 ] .除此之外,亦有学者尝试基于新基建3个方面对其做出综合评价[13 ] ,但所选指标并未体现新基建“新”的特征.在妥善选取新基建综合评价指标的基础上,对其综合评价的方法和驱动因素分析可以借鉴传统基建[14 ⇓ ⇓ -17 ] ,毕竟前者相对后者存在着继承与发展的关系[4 ] . ...
... 影响新基建发展的因素众多,为了确保核心因素不被遗漏,同时兼顾数据的可获得性,本文基于已有研究成果来选择新基建发展的驱动因素.第一,经济发展水平较高的国家往往更具有增加基础设施投资的动机[22 ] ,因为经济发展会提高基础设施的需求与供给能力[23 ] ,那么经济发展必定会增加新基建投资,更有能力维护、升级或改造传统基建;第二,产业结构可能会影响新基建的需求[24 ] ,因为工业互联网、物联网、云计算等新型基建将助力智慧产业的形成及运营[8 ] ,如智慧社会下的远程办公等[25 ] ;第三,任何基建的发展都需要足额的资金支撑,而且已有研究表明,金融发展水平是基础设施发展的影响因素[16 ] ,而需要较大投资规模的新基建自然离不开优良金融发展水平的加持;第四,新基建与新技术革命前沿紧密结合,以技术创新为驱动[1 ] ,所以创新基础也有可能是新基建发展的重要驱动力;第五,基础设施与城市化密切相关[26 ] ,农村人口转移到城市将增加配套基础设施的需求,拉动基础设施的投资[27 -28 ] ,因而城市化进程也可能影响新基建的发展;最后,人口规模可能对新基建发展产生影响,因为人口规模和基础设施的市场需求密切相关,人口规模越大对基础设施的需求往往越大.综上所述,本文将选择经济发展水平、产业结构高度化、产业结构合理化、金融发展水平、创新基础、城市化进程、人口规模等变量来探讨新基建发展水平的驱动因素,具体计算方法见表2 . ...
The geographic sources of innovation: Technological infrastructure and product innovation in the United States
1
1994
... 目前,学术界在新基建领域已经积累了一定的成果,但主要集中于顶层设计角度的策略布局[1 ⇓ -3 ] .虽然有学者从描述统计角度分析了中国新基建发展现状[4 ] ,但并未直观展现出中国新基建的空间格局,对其综合量化评价方面更显不足.尽管如此,按照国家发展和改革委员会(简称“发改委”)对新基建包含信息基建、融合基建和创新基建等3个方面的权威解读[4 ] ,学术界在这3个方面的量化评价已经开展了大量研究.其中,在信息基建评价方面,主要使用固定电话、移动电话、互联网和邮电业务或信息基建领域中的相关专利数据等指标[5 -6 ] ;在融合基建评价方面,已有研究针对智慧能源或智慧交通多采用定性评价,而在智慧城市和智慧产业等领域也有学者构建了综合评价指标[7 -8 ] ,但多数指标仍采用互联网和电信业务等信息基建的内容;在创新基建评价方面,部分采用政策解读或案例解析的定性方法[9 ] ,也有学者采用研发支出等系列指标来综合评价创新基建质量[10 ] .如吕拉昌等[11 ] 采用国家重大科技基础设施、科教基础设施、产业技术创新基础设施等指标进行衡量,基本吻合了新基建中创新基建的内容[12 ] .除此之外,亦有学者尝试基于新基建3个方面对其做出综合评价[13 ] ,但所选指标并未体现新基建“新”的特征.在妥善选取新基建综合评价指标的基础上,对其综合评价的方法和驱动因素分析可以借鉴传统基建[14 ⇓ ⇓ -17 ] ,毕竟前者相对后者存在着继承与发展的关系[4 ] . ...
The determinants of national innovative capacity
1
2002
... 目前,学术界在新基建领域已经积累了一定的成果,但主要集中于顶层设计角度的策略布局[1 ⇓ -3 ] .虽然有学者从描述统计角度分析了中国新基建发展现状[4 ] ,但并未直观展现出中国新基建的空间格局,对其综合量化评价方面更显不足.尽管如此,按照国家发展和改革委员会(简称“发改委”)对新基建包含信息基建、融合基建和创新基建等3个方面的权威解读[4 ] ,学术界在这3个方面的量化评价已经开展了大量研究.其中,在信息基建评价方面,主要使用固定电话、移动电话、互联网和邮电业务或信息基建领域中的相关专利数据等指标[5 -6 ] ;在融合基建评价方面,已有研究针对智慧能源或智慧交通多采用定性评价,而在智慧城市和智慧产业等领域也有学者构建了综合评价指标[7 -8 ] ,但多数指标仍采用互联网和电信业务等信息基建的内容;在创新基建评价方面,部分采用政策解读或案例解析的定性方法[9 ] ,也有学者采用研发支出等系列指标来综合评价创新基建质量[10 ] .如吕拉昌等[11 ] 采用国家重大科技基础设施、科教基础设施、产业技术创新基础设施等指标进行衡量,基本吻合了新基建中创新基建的内容[12 ] .除此之外,亦有学者尝试基于新基建3个方面对其做出综合评价[13 ] ,但所选指标并未体现新基建“新”的特征.在妥善选取新基建综合评价指标的基础上,对其综合评价的方法和驱动因素分析可以借鉴传统基建[14 ⇓ ⇓ -17 ] ,毕竟前者相对后者存在着继承与发展的关系[4 ] . ...
城市创新基础设施空间格局与创新产出: 基于中国290个地级及以上城市的实证分析
1
2021
... 目前,学术界在新基建领域已经积累了一定的成果,但主要集中于顶层设计角度的策略布局[1 ⇓ -3 ] .虽然有学者从描述统计角度分析了中国新基建发展现状[4 ] ,但并未直观展现出中国新基建的空间格局,对其综合量化评价方面更显不足.尽管如此,按照国家发展和改革委员会(简称“发改委”)对新基建包含信息基建、融合基建和创新基建等3个方面的权威解读[4 ] ,学术界在这3个方面的量化评价已经开展了大量研究.其中,在信息基建评价方面,主要使用固定电话、移动电话、互联网和邮电业务或信息基建领域中的相关专利数据等指标[5 -6 ] ;在融合基建评价方面,已有研究针对智慧能源或智慧交通多采用定性评价,而在智慧城市和智慧产业等领域也有学者构建了综合评价指标[7 -8 ] ,但多数指标仍采用互联网和电信业务等信息基建的内容;在创新基建评价方面,部分采用政策解读或案例解析的定性方法[9 ] ,也有学者采用研发支出等系列指标来综合评价创新基建质量[10 ] .如吕拉昌等[11 ] 采用国家重大科技基础设施、科教基础设施、产业技术创新基础设施等指标进行衡量,基本吻合了新基建中创新基建的内容[12 ] .除此之外,亦有学者尝试基于新基建3个方面对其做出综合评价[13 ] ,但所选指标并未体现新基建“新”的特征.在妥善选取新基建综合评价指标的基础上,对其综合评价的方法和驱动因素分析可以借鉴传统基建[14 ⇓ ⇓ -17 ] ,毕竟前者相对后者存在着继承与发展的关系[4 ] . ...
面向“十四五”谋篇布局统筹推进创新基础设施建设
1
2020
... 目前,学术界在新基建领域已经积累了一定的成果,但主要集中于顶层设计角度的策略布局[1 ⇓ -3 ] .虽然有学者从描述统计角度分析了中国新基建发展现状[4 ] ,但并未直观展现出中国新基建的空间格局,对其综合量化评价方面更显不足.尽管如此,按照国家发展和改革委员会(简称“发改委”)对新基建包含信息基建、融合基建和创新基建等3个方面的权威解读[4 ] ,学术界在这3个方面的量化评价已经开展了大量研究.其中,在信息基建评价方面,主要使用固定电话、移动电话、互联网和邮电业务或信息基建领域中的相关专利数据等指标[5 -6 ] ;在融合基建评价方面,已有研究针对智慧能源或智慧交通多采用定性评价,而在智慧城市和智慧产业等领域也有学者构建了综合评价指标[7 -8 ] ,但多数指标仍采用互联网和电信业务等信息基建的内容;在创新基建评价方面,部分采用政策解读或案例解析的定性方法[9 ] ,也有学者采用研发支出等系列指标来综合评价创新基建质量[10 ] .如吕拉昌等[11 ] 采用国家重大科技基础设施、科教基础设施、产业技术创新基础设施等指标进行衡量,基本吻合了新基建中创新基建的内容[12 ] .除此之外,亦有学者尝试基于新基建3个方面对其做出综合评价[13 ] ,但所选指标并未体现新基建“新”的特征.在妥善选取新基建综合评价指标的基础上,对其综合评价的方法和驱动因素分析可以借鉴传统基建[14 ⇓ ⇓ -17 ] ,毕竟前者相对后者存在着继承与发展的关系[4 ] . ...
新型基础设施建设与战略性新兴产业耦合协调发展测度及其耦合机制
1
2021
... 目前,学术界在新基建领域已经积累了一定的成果,但主要集中于顶层设计角度的策略布局[1 ⇓ -3 ] .虽然有学者从描述统计角度分析了中国新基建发展现状[4 ] ,但并未直观展现出中国新基建的空间格局,对其综合量化评价方面更显不足.尽管如此,按照国家发展和改革委员会(简称“发改委”)对新基建包含信息基建、融合基建和创新基建等3个方面的权威解读[4 ] ,学术界在这3个方面的量化评价已经开展了大量研究.其中,在信息基建评价方面,主要使用固定电话、移动电话、互联网和邮电业务或信息基建领域中的相关专利数据等指标[5 -6 ] ;在融合基建评价方面,已有研究针对智慧能源或智慧交通多采用定性评价,而在智慧城市和智慧产业等领域也有学者构建了综合评价指标[7 -8 ] ,但多数指标仍采用互联网和电信业务等信息基建的内容;在创新基建评价方面,部分采用政策解读或案例解析的定性方法[9 ] ,也有学者采用研发支出等系列指标来综合评价创新基建质量[10 ] .如吕拉昌等[11 ] 采用国家重大科技基础设施、科教基础设施、产业技术创新基础设施等指标进行衡量,基本吻合了新基建中创新基建的内容[12 ] .除此之外,亦有学者尝试基于新基建3个方面对其做出综合评价[13 ] ,但所选指标并未体现新基建“新”的特征.在妥善选取新基建综合评价指标的基础上,对其综合评价的方法和驱动因素分析可以借鉴传统基建[14 ⇓ ⇓ -17 ] ,毕竟前者相对后者存在着继承与发展的关系[4 ] . ...
Fuzzy evaluations applied in analysis of infrastructure development based on national competitiveness perspectives
1
2014
... 目前,学术界在新基建领域已经积累了一定的成果,但主要集中于顶层设计角度的策略布局[1 ⇓ -3 ] .虽然有学者从描述统计角度分析了中国新基建发展现状[4 ] ,但并未直观展现出中国新基建的空间格局,对其综合量化评价方面更显不足.尽管如此,按照国家发展和改革委员会(简称“发改委”)对新基建包含信息基建、融合基建和创新基建等3个方面的权威解读[4 ] ,学术界在这3个方面的量化评价已经开展了大量研究.其中,在信息基建评价方面,主要使用固定电话、移动电话、互联网和邮电业务或信息基建领域中的相关专利数据等指标[5 -6 ] ;在融合基建评价方面,已有研究针对智慧能源或智慧交通多采用定性评价,而在智慧城市和智慧产业等领域也有学者构建了综合评价指标[7 -8 ] ,但多数指标仍采用互联网和电信业务等信息基建的内容;在创新基建评价方面,部分采用政策解读或案例解析的定性方法[9 ] ,也有学者采用研发支出等系列指标来综合评价创新基建质量[10 ] .如吕拉昌等[11 ] 采用国家重大科技基础设施、科教基础设施、产业技术创新基础设施等指标进行衡量,基本吻合了新基建中创新基建的内容[12 ] .除此之外,亦有学者尝试基于新基建3个方面对其做出综合评价[13 ] ,但所选指标并未体现新基建“新”的特征.在妥善选取新基建综合评价指标的基础上,对其综合评价的方法和驱动因素分析可以借鉴传统基建[14 ⇓ ⇓ -17 ] ,毕竟前者相对后者存在着继承与发展的关系[4 ] . ...
Multilevel assessment of public transportation infrastructure: A spatial econometric computable general equilibrium approach
1
2015
... 目前,学术界在新基建领域已经积累了一定的成果,但主要集中于顶层设计角度的策略布局[1 ⇓ -3 ] .虽然有学者从描述统计角度分析了中国新基建发展现状[4 ] ,但并未直观展现出中国新基建的空间格局,对其综合量化评价方面更显不足.尽管如此,按照国家发展和改革委员会(简称“发改委”)对新基建包含信息基建、融合基建和创新基建等3个方面的权威解读[4 ] ,学术界在这3个方面的量化评价已经开展了大量研究.其中,在信息基建评价方面,主要使用固定电话、移动电话、互联网和邮电业务或信息基建领域中的相关专利数据等指标[5 -6 ] ;在融合基建评价方面,已有研究针对智慧能源或智慧交通多采用定性评价,而在智慧城市和智慧产业等领域也有学者构建了综合评价指标[7 -8 ] ,但多数指标仍采用互联网和电信业务等信息基建的内容;在创新基建评价方面,部分采用政策解读或案例解析的定性方法[9 ] ,也有学者采用研发支出等系列指标来综合评价创新基建质量[10 ] .如吕拉昌等[11 ] 采用国家重大科技基础设施、科教基础设施、产业技术创新基础设施等指标进行衡量,基本吻合了新基建中创新基建的内容[12 ] .除此之外,亦有学者尝试基于新基建3个方面对其做出综合评价[13 ] ,但所选指标并未体现新基建“新”的特征.在妥善选取新基建综合评价指标的基础上,对其综合评价的方法和驱动因素分析可以借鉴传统基建[14 ⇓ ⇓ -17 ] ,毕竟前者相对后者存在着继承与发展的关系[4 ] . ...
中国基础设施发展水平测算及影响因素: 基于省级面板数据的实证研究
2
2016
... 目前,学术界在新基建领域已经积累了一定的成果,但主要集中于顶层设计角度的策略布局[1 ⇓ -3 ] .虽然有学者从描述统计角度分析了中国新基建发展现状[4 ] ,但并未直观展现出中国新基建的空间格局,对其综合量化评价方面更显不足.尽管如此,按照国家发展和改革委员会(简称“发改委”)对新基建包含信息基建、融合基建和创新基建等3个方面的权威解读[4 ] ,学术界在这3个方面的量化评价已经开展了大量研究.其中,在信息基建评价方面,主要使用固定电话、移动电话、互联网和邮电业务或信息基建领域中的相关专利数据等指标[5 -6 ] ;在融合基建评价方面,已有研究针对智慧能源或智慧交通多采用定性评价,而在智慧城市和智慧产业等领域也有学者构建了综合评价指标[7 -8 ] ,但多数指标仍采用互联网和电信业务等信息基建的内容;在创新基建评价方面,部分采用政策解读或案例解析的定性方法[9 ] ,也有学者采用研发支出等系列指标来综合评价创新基建质量[10 ] .如吕拉昌等[11 ] 采用国家重大科技基础设施、科教基础设施、产业技术创新基础设施等指标进行衡量,基本吻合了新基建中创新基建的内容[12 ] .除此之外,亦有学者尝试基于新基建3个方面对其做出综合评价[13 ] ,但所选指标并未体现新基建“新”的特征.在妥善选取新基建综合评价指标的基础上,对其综合评价的方法和驱动因素分析可以借鉴传统基建[14 ⇓ ⇓ -17 ] ,毕竟前者相对后者存在着继承与发展的关系[4 ] . ...
... 影响新基建发展的因素众多,为了确保核心因素不被遗漏,同时兼顾数据的可获得性,本文基于已有研究成果来选择新基建发展的驱动因素.第一,经济发展水平较高的国家往往更具有增加基础设施投资的动机[22 ] ,因为经济发展会提高基础设施的需求与供给能力[23 ] ,那么经济发展必定会增加新基建投资,更有能力维护、升级或改造传统基建;第二,产业结构可能会影响新基建的需求[24 ] ,因为工业互联网、物联网、云计算等新型基建将助力智慧产业的形成及运营[8 ] ,如智慧社会下的远程办公等[25 ] ;第三,任何基建的发展都需要足额的资金支撑,而且已有研究表明,金融发展水平是基础设施发展的影响因素[16 ] ,而需要较大投资规模的新基建自然离不开优良金融发展水平的加持;第四,新基建与新技术革命前沿紧密结合,以技术创新为驱动[1 ] ,所以创新基础也有可能是新基建发展的重要驱动力;第五,基础设施与城市化密切相关[26 ] ,农村人口转移到城市将增加配套基础设施的需求,拉动基础设施的投资[27 -28 ] ,因而城市化进程也可能影响新基建的发展;最后,人口规模可能对新基建发展产生影响,因为人口规模和基础设施的市场需求密切相关,人口规模越大对基础设施的需求往往越大.综上所述,本文将选择经济发展水平、产业结构高度化、产业结构合理化、金融发展水平、创新基础、城市化进程、人口规模等变量来探讨新基建发展水平的驱动因素,具体计算方法见表2 . ...
中国地级以上城市基础设施评价研究
1
2011
... 目前,学术界在新基建领域已经积累了一定的成果,但主要集中于顶层设计角度的策略布局[1 ⇓ -3 ] .虽然有学者从描述统计角度分析了中国新基建发展现状[4 ] ,但并未直观展现出中国新基建的空间格局,对其综合量化评价方面更显不足.尽管如此,按照国家发展和改革委员会(简称“发改委”)对新基建包含信息基建、融合基建和创新基建等3个方面的权威解读[4 ] ,学术界在这3个方面的量化评价已经开展了大量研究.其中,在信息基建评价方面,主要使用固定电话、移动电话、互联网和邮电业务或信息基建领域中的相关专利数据等指标[5 -6 ] ;在融合基建评价方面,已有研究针对智慧能源或智慧交通多采用定性评价,而在智慧城市和智慧产业等领域也有学者构建了综合评价指标[7 -8 ] ,但多数指标仍采用互联网和电信业务等信息基建的内容;在创新基建评价方面,部分采用政策解读或案例解析的定性方法[9 ] ,也有学者采用研发支出等系列指标来综合评价创新基建质量[10 ] .如吕拉昌等[11 ] 采用国家重大科技基础设施、科教基础设施、产业技术创新基础设施等指标进行衡量,基本吻合了新基建中创新基建的内容[12 ] .除此之外,亦有学者尝试基于新基建3个方面对其做出综合评价[13 ] ,但所选指标并未体现新基建“新”的特征.在妥善选取新基建综合评价指标的基础上,对其综合评价的方法和驱动因素分析可以借鉴传统基建[14 ⇓ ⇓ -17 ] ,毕竟前者相对后者存在着继承与发展的关系[4 ] . ...
21世纪以来中国高新技术企业的时空分布和影响机制
1
2018
... 综上所述,已有研究为新基建发展水平的综合评价积累了丰富经验,但仍存在以下几点可改进之处:第一,学者多基于单一领域对新基建发展水平进行测度,缺乏能够全面刻画新基建发展水平的优化指标;第二,由于数据的限制,部分学者虽尝试综合测度新基建发展水平,但在指标选取方面难以体现出新基建“新”的特性,导致新基建发展水平的综合评价缺乏相对合理性,因而亟需进行必要的修正与完善;第三,由于影响新基建发展水平的多个因素在相邻地理区位上常存在空间溢出效应,加之空间单元的划分或归并可导致空间数据误差的出现[18 -19 ] ,地区尺度上新基建的发展水平通常表现出较强的空间自相关性(spatial autocorrelation);然而,既有研究尚少讨论新基建发展的驱动因素,尤其是考虑空间自相关后的修正探讨.因此,全面综合评价新基建发展水平并分析全国尺度下新基建的时空演化格局,有利于更进一步把握和理解中国新基建发展现状及布局规律;同时,新型基础设施通常具备跨区域服务的特性,基于空间关联视角探讨新基建布局的驱动机制,不仅有利于通过揭示其布局规律来拓展和深化传统区位理论,而且有助于区域发展政策制定向跨行政单元思路上的突破. ...
中国城市流动人口居留意愿的地区差异与影响因素: 基于2015年流动人口动态监测数据
1
2018
... 综上所述,已有研究为新基建发展水平的综合评价积累了丰富经验,但仍存在以下几点可改进之处:第一,学者多基于单一领域对新基建发展水平进行测度,缺乏能够全面刻画新基建发展水平的优化指标;第二,由于数据的限制,部分学者虽尝试综合测度新基建发展水平,但在指标选取方面难以体现出新基建“新”的特性,导致新基建发展水平的综合评价缺乏相对合理性,因而亟需进行必要的修正与完善;第三,由于影响新基建发展水平的多个因素在相邻地理区位上常存在空间溢出效应,加之空间单元的划分或归并可导致空间数据误差的出现[18 -19 ] ,地区尺度上新基建的发展水平通常表现出较强的空间自相关性(spatial autocorrelation);然而,既有研究尚少讨论新基建发展的驱动因素,尤其是考虑空间自相关后的修正探讨.因此,全面综合评价新基建发展水平并分析全国尺度下新基建的时空演化格局,有利于更进一步把握和理解中国新基建发展现状及布局规律;同时,新型基础设施通常具备跨区域服务的特性,基于空间关联视角探讨新基建布局的驱动机制,不仅有利于通过揭示其布局规律来拓展和深化传统区位理论,而且有助于区域发展政策制定向跨行政单元思路上的突破. ...
基于特征椭圆的中国经济空间分异研究
1
2014
... 基于此,本文拟结合国家发改委对新基建做出的权威解读和已有文献及政策文本的梳理,从信息基建、融合基建和创新基建3个方面的内容构建新基建发展水平的综合评价指标体系,并运用TOPSIS-熵值法测度中国新基建发展水平.在此基础上,利用空间统计标准差椭圆(SDE)等方法[20 ] 分析其时空演化特征,并运用空间计量模型探讨其驱动因素,以期为中国新基建发展提供一定价值的借鉴参考. ...
基于特征椭圆的中国经济空间分异研究
1
2014
... 基于此,本文拟结合国家发改委对新基建做出的权威解读和已有文献及政策文本的梳理,从信息基建、融合基建和创新基建3个方面的内容构建新基建发展水平的综合评价指标体系,并运用TOPSIS-熵值法测度中国新基建发展水平.在此基础上,利用空间统计标准差椭圆(SDE)等方法[20 ] 分析其时空演化特征,并运用空间计量模型探讨其驱动因素,以期为中国新基建发展提供一定价值的借鉴参考. ...
基于熵权TOPSIS法的经济技术开发区产业转型升级模式选择研究: 以芜湖市为例
1
2014
... 另外,本文使用TOPSIS-熵值法测度新基建发展水平,TOPSIS-熵值法是对传统TOPSIS评价法的改进,通过熵值法确定评价指标的权重能够避免主观因素的影响,再通过TOPSIS法利用逼近理想解的技术确定评价对象的排序,进而得到新基建发展水平的综合评价结果[21 ] .计算步骤如下: ...
基于熵权TOPSIS法的经济技术开发区产业转型升级模式选择研究: 以芜湖市为例
1
2014
... 另外,本文使用TOPSIS-熵值法测度新基建发展水平,TOPSIS-熵值法是对传统TOPSIS评价法的改进,通过熵值法确定评价指标的权重能够避免主观因素的影响,再通过TOPSIS法利用逼近理想解的技术确定评价对象的排序,进而得到新基建发展水平的综合评价结果[21 ] .计算步骤如下: ...
Public-sector capital and the productivity puzzle
1
1994
... 影响新基建发展的因素众多,为了确保核心因素不被遗漏,同时兼顾数据的可获得性,本文基于已有研究成果来选择新基建发展的驱动因素.第一,经济发展水平较高的国家往往更具有增加基础设施投资的动机[22 ] ,因为经济发展会提高基础设施的需求与供给能力[23 ] ,那么经济发展必定会增加新基建投资,更有能力维护、升级或改造传统基建;第二,产业结构可能会影响新基建的需求[24 ] ,因为工业互联网、物联网、云计算等新型基建将助力智慧产业的形成及运营[8 ] ,如智慧社会下的远程办公等[25 ] ;第三,任何基建的发展都需要足额的资金支撑,而且已有研究表明,金融发展水平是基础设施发展的影响因素[16 ] ,而需要较大投资规模的新基建自然离不开优良金融发展水平的加持;第四,新基建与新技术革命前沿紧密结合,以技术创新为驱动[1 ] ,所以创新基础也有可能是新基建发展的重要驱动力;第五,基础设施与城市化密切相关[26 ] ,农村人口转移到城市将增加配套基础设施的需求,拉动基础设施的投资[27 -28 ] ,因而城市化进程也可能影响新基建的发展;最后,人口规模可能对新基建发展产生影响,因为人口规模和基础设施的市场需求密切相关,人口规模越大对基础设施的需求往往越大.综上所述,本文将选择经济发展水平、产业结构高度化、产业结构合理化、金融发展水平、创新基础、城市化进程、人口规模等变量来探讨新基建发展水平的驱动因素,具体计算方法见表2 . ...
The relationship between GDP and electricity consumption in 10 Asian countries
1
2007
... 影响新基建发展的因素众多,为了确保核心因素不被遗漏,同时兼顾数据的可获得性,本文基于已有研究成果来选择新基建发展的驱动因素.第一,经济发展水平较高的国家往往更具有增加基础设施投资的动机[22 ] ,因为经济发展会提高基础设施的需求与供给能力[23 ] ,那么经济发展必定会增加新基建投资,更有能力维护、升级或改造传统基建;第二,产业结构可能会影响新基建的需求[24 ] ,因为工业互联网、物联网、云计算等新型基建将助力智慧产业的形成及运营[8 ] ,如智慧社会下的远程办公等[25 ] ;第三,任何基建的发展都需要足额的资金支撑,而且已有研究表明,金融发展水平是基础设施发展的影响因素[16 ] ,而需要较大投资规模的新基建自然离不开优良金融发展水平的加持;第四,新基建与新技术革命前沿紧密结合,以技术创新为驱动[1 ] ,所以创新基础也有可能是新基建发展的重要驱动力;第五,基础设施与城市化密切相关[26 ] ,农村人口转移到城市将增加配套基础设施的需求,拉动基础设施的投资[27 -28 ] ,因而城市化进程也可能影响新基建的发展;最后,人口规模可能对新基建发展产生影响,因为人口规模和基础设施的市场需求密切相关,人口规模越大对基础设施的需求往往越大.综上所述,本文将选择经济发展水平、产业结构高度化、产业结构合理化、金融发展水平、创新基础、城市化进程、人口规模等变量来探讨新基建发展水平的驱动因素,具体计算方法见表2 . ...
基于产业结构关联视角的区域经济韧性作用机理研究: 以江苏省为例
1
2022
... 影响新基建发展的因素众多,为了确保核心因素不被遗漏,同时兼顾数据的可获得性,本文基于已有研究成果来选择新基建发展的驱动因素.第一,经济发展水平较高的国家往往更具有增加基础设施投资的动机[22 ] ,因为经济发展会提高基础设施的需求与供给能力[23 ] ,那么经济发展必定会增加新基建投资,更有能力维护、升级或改造传统基建;第二,产业结构可能会影响新基建的需求[24 ] ,因为工业互联网、物联网、云计算等新型基建将助力智慧产业的形成及运营[8 ] ,如智慧社会下的远程办公等[25 ] ;第三,任何基建的发展都需要足额的资金支撑,而且已有研究表明,金融发展水平是基础设施发展的影响因素[16 ] ,而需要较大投资规模的新基建自然离不开优良金融发展水平的加持;第四,新基建与新技术革命前沿紧密结合,以技术创新为驱动[1 ] ,所以创新基础也有可能是新基建发展的重要驱动力;第五,基础设施与城市化密切相关[26 ] ,农村人口转移到城市将增加配套基础设施的需求,拉动基础设施的投资[27 -28 ] ,因而城市化进程也可能影响新基建的发展;最后,人口规模可能对新基建发展产生影响,因为人口规模和基础设施的市场需求密切相关,人口规模越大对基础设施的需求往往越大.综上所述,本文将选择经济发展水平、产业结构高度化、产业结构合理化、金融发展水平、创新基础、城市化进程、人口规模等变量来探讨新基建发展水平的驱动因素,具体计算方法见表2 . ...
智慧社会下的远程通勤: 基于全天和非全天在家办公选择及影响因素的分析
1
2021
... 影响新基建发展的因素众多,为了确保核心因素不被遗漏,同时兼顾数据的可获得性,本文基于已有研究成果来选择新基建发展的驱动因素.第一,经济发展水平较高的国家往往更具有增加基础设施投资的动机[22 ] ,因为经济发展会提高基础设施的需求与供给能力[23 ] ,那么经济发展必定会增加新基建投资,更有能力维护、升级或改造传统基建;第二,产业结构可能会影响新基建的需求[24 ] ,因为工业互联网、物联网、云计算等新型基建将助力智慧产业的形成及运营[8 ] ,如智慧社会下的远程办公等[25 ] ;第三,任何基建的发展都需要足额的资金支撑,而且已有研究表明,金融发展水平是基础设施发展的影响因素[16 ] ,而需要较大投资规模的新基建自然离不开优良金融发展水平的加持;第四,新基建与新技术革命前沿紧密结合,以技术创新为驱动[1 ] ,所以创新基础也有可能是新基建发展的重要驱动力;第五,基础设施与城市化密切相关[26 ] ,农村人口转移到城市将增加配套基础设施的需求,拉动基础设施的投资[27 -28 ] ,因而城市化进程也可能影响新基建的发展;最后,人口规模可能对新基建发展产生影响,因为人口规模和基础设施的市场需求密切相关,人口规模越大对基础设施的需求往往越大.综上所述,本文将选择经济发展水平、产业结构高度化、产业结构合理化、金融发展水平、创新基础、城市化进程、人口规模等变量来探讨新基建发展水平的驱动因素,具体计算方法见表2 . ...
基础设施与城市化水平耦合协调关系演变: 基于285个地级市的实证研究
1
2018
... 影响新基建发展的因素众多,为了确保核心因素不被遗漏,同时兼顾数据的可获得性,本文基于已有研究成果来选择新基建发展的驱动因素.第一,经济发展水平较高的国家往往更具有增加基础设施投资的动机[22 ] ,因为经济发展会提高基础设施的需求与供给能力[23 ] ,那么经济发展必定会增加新基建投资,更有能力维护、升级或改造传统基建;第二,产业结构可能会影响新基建的需求[24 ] ,因为工业互联网、物联网、云计算等新型基建将助力智慧产业的形成及运营[8 ] ,如智慧社会下的远程办公等[25 ] ;第三,任何基建的发展都需要足额的资金支撑,而且已有研究表明,金融发展水平是基础设施发展的影响因素[16 ] ,而需要较大投资规模的新基建自然离不开优良金融发展水平的加持;第四,新基建与新技术革命前沿紧密结合,以技术创新为驱动[1 ] ,所以创新基础也有可能是新基建发展的重要驱动力;第五,基础设施与城市化密切相关[26 ] ,农村人口转移到城市将增加配套基础设施的需求,拉动基础设施的投资[27 -28 ] ,因而城市化进程也可能影响新基建的发展;最后,人口规模可能对新基建发展产生影响,因为人口规模和基础设施的市场需求密切相关,人口规模越大对基础设施的需求往往越大.综上所述,本文将选择经济发展水平、产业结构高度化、产业结构合理化、金融发展水平、创新基础、城市化进程、人口规模等变量来探讨新基建发展水平的驱动因素,具体计算方法见表2 . ...
“新型城镇化”与“乡村振兴”场景下新基建对产业转型的启示
1
2021
... 影响新基建发展的因素众多,为了确保核心因素不被遗漏,同时兼顾数据的可获得性,本文基于已有研究成果来选择新基建发展的驱动因素.第一,经济发展水平较高的国家往往更具有增加基础设施投资的动机[22 ] ,因为经济发展会提高基础设施的需求与供给能力[23 ] ,那么经济发展必定会增加新基建投资,更有能力维护、升级或改造传统基建;第二,产业结构可能会影响新基建的需求[24 ] ,因为工业互联网、物联网、云计算等新型基建将助力智慧产业的形成及运营[8 ] ,如智慧社会下的远程办公等[25 ] ;第三,任何基建的发展都需要足额的资金支撑,而且已有研究表明,金融发展水平是基础设施发展的影响因素[16 ] ,而需要较大投资规模的新基建自然离不开优良金融发展水平的加持;第四,新基建与新技术革命前沿紧密结合,以技术创新为驱动[1 ] ,所以创新基础也有可能是新基建发展的重要驱动力;第五,基础设施与城市化密切相关[26 ] ,农村人口转移到城市将增加配套基础设施的需求,拉动基础设施的投资[27 -28 ] ,因而城市化进程也可能影响新基建的发展;最后,人口规模可能对新基建发展产生影响,因为人口规模和基础设施的市场需求密切相关,人口规模越大对基础设施的需求往往越大.综上所述,本文将选择经济发展水平、产业结构高度化、产业结构合理化、金融发展水平、创新基础、城市化进程、人口规模等变量来探讨新基建发展水平的驱动因素,具体计算方法见表2 . ...
京津冀基础设施建设与人口集聚耦合演进分析: 基于推拉理论解析
1
2019
... 影响新基建发展的因素众多,为了确保核心因素不被遗漏,同时兼顾数据的可获得性,本文基于已有研究成果来选择新基建发展的驱动因素.第一,经济发展水平较高的国家往往更具有增加基础设施投资的动机[22 ] ,因为经济发展会提高基础设施的需求与供给能力[23 ] ,那么经济发展必定会增加新基建投资,更有能力维护、升级或改造传统基建;第二,产业结构可能会影响新基建的需求[24 ] ,因为工业互联网、物联网、云计算等新型基建将助力智慧产业的形成及运营[8 ] ,如智慧社会下的远程办公等[25 ] ;第三,任何基建的发展都需要足额的资金支撑,而且已有研究表明,金融发展水平是基础设施发展的影响因素[16 ] ,而需要较大投资规模的新基建自然离不开优良金融发展水平的加持;第四,新基建与新技术革命前沿紧密结合,以技术创新为驱动[1 ] ,所以创新基础也有可能是新基建发展的重要驱动力;第五,基础设施与城市化密切相关[26 ] ,农村人口转移到城市将增加配套基础设施的需求,拉动基础设施的投资[27 -28 ] ,因而城市化进程也可能影响新基建的发展;最后,人口规模可能对新基建发展产生影响,因为人口规模和基础设施的市场需求密切相关,人口规模越大对基础设施的需求往往越大.综上所述,本文将选择经济发展水平、产业结构高度化、产业结构合理化、金融发展水平、创新基础、城市化进程、人口规模等变量来探讨新基建发展水平的驱动因素,具体计算方法见表2 . ...
国家高新区推动了中国产业结构转型升级吗
1
2018
... Definition and calculation methods of variables in the spatial econometric regression model
Tab.2 变量 符号 名称 测算方法 单位 因变量 New 新基建发展水平 综合测算指标 — 自变量 PGDP 经济发展水平 人均GDP 万元 AIS1 产业结构高度化 第三产业增加值/第二产业增加值 — AIS2 产业结构合理化 借鉴袁航等[29 ] 采用Theil测算 — FD 金融发展水平 年末全部金融机构各项贷款余额/GDP — INNO 创新基础 研发人员全时当量 万人 UP 城镇化进程 城镇人口比重 % POP 人口规模 总人口 亿人
为检验新基建发展水平的影响因素,本文首先构建了各省域新基建发展水平影响因素估计的面板模型: ...
1
2019
... 通过空间自相关分析(Moran's I )证明了新基建发展水平具有一定空间正相关性,对于具有较强空间自相关性的空间数据而言,采用最小二乘法回归是有偏误的[30 ] ,故探讨其影响因素应考虑空间依赖性,宜采用空间计量模型.在进行空间计量分析之前,本文通过LM检验、Hausman检验、LR检验和Wald检验等方法进行比较空间滞后模型(spatial lag model,SLM)、空间误差模型(spatial error model,SEM)和空间杜宾模型(spatial Durbin model,SDM)的适配性(表3 ),最终确定采用固定效应下的空间杜宾模型(SDM)来探讨新基建发展水平的驱动因素. ...
中国产业结构变迁对经济增长和波动的影响
1
2011
... 产业结构合理化(AIS2)对新基建发展水平具有显著正向影响(P <0.01).这表明产业结构合理化,即产业之间协调能力和资源有效利用程度[31 ] 对新基建发展具有促进作用.然而,产业结构合理化的空间滞后项对新基建发展水平的估计结果也没通过显著性水平检验,表明周边地区产业结构合理化对本地新基建发展的作用不明显,原因可能在于目前跨区域的产业协调和资源利用还没充分利用新基建的价值,从而对新基建发展的促进作用未得到完全发挥. ...
中国产业结构变迁对经济增长和波动的影响
1
2011
... 产业结构合理化(AIS2)对新基建发展水平具有显著正向影响(P <0.01).这表明产业结构合理化,即产业之间协调能力和资源有效利用程度[31 ] 对新基建发展具有促进作用.然而,产业结构合理化的空间滞后项对新基建发展水平的估计结果也没通过显著性水平检验,表明周边地区产业结构合理化对本地新基建发展的作用不明显,原因可能在于目前跨区域的产业协调和资源利用还没充分利用新基建的价值,从而对新基建发展的促进作用未得到完全发挥. ...
本地知识基础对新兴产业知识流动的影响: 以中国燃料电池产业为例
1
2021
... 创新基础(INNO)对新基建发展水平具有显著正向影响(P <0.01).新基建对技术水平的要求较高,而领先的技术水平需要优良的创新基础作为根基,所以创新基础对新基建的发展具有正向促进作用.与此同时,创新基础的空间滞后项对新基建发展水平的估计结果也通过了1%的显著性水平检验,且方向为正,表明周边地区的创新基础有助于本地新基建发展,反映了创新具有较强的空间溢出效应[32 -33 ] . ...
本地知识基础对新兴产业知识流动的影响: 以中国燃料电池产业为例
1
2021
... 创新基础(INNO)对新基建发展水平具有显著正向影响(P <0.01).新基建对技术水平的要求较高,而领先的技术水平需要优良的创新基础作为根基,所以创新基础对新基建的发展具有正向促进作用.与此同时,创新基础的空间滞后项对新基建发展水平的估计结果也通过了1%的显著性水平检验,且方向为正,表明周边地区的创新基础有助于本地新基建发展,反映了创新具有较强的空间溢出效应[32 -33 ] . ...
“集聚—扩散”视角下中国区域创新极及其知识溢出区位
1
2021
... 创新基础(INNO)对新基建发展水平具有显著正向影响(P <0.01).新基建对技术水平的要求较高,而领先的技术水平需要优良的创新基础作为根基,所以创新基础对新基建的发展具有正向促进作用.与此同时,创新基础的空间滞后项对新基建发展水平的估计结果也通过了1%的显著性水平检验,且方向为正,表明周边地区的创新基础有助于本地新基建发展,反映了创新具有较强的空间溢出效应[32 -33 ] . ...
“集聚—扩散”视角下中国区域创新极及其知识溢出区位
1
2021
... 创新基础(INNO)对新基建发展水平具有显著正向影响(P <0.01).新基建对技术水平的要求较高,而领先的技术水平需要优良的创新基础作为根基,所以创新基础对新基建的发展具有正向促进作用.与此同时,创新基础的空间滞后项对新基建发展水平的估计结果也通过了1%的显著性水平检验,且方向为正,表明周边地区的创新基础有助于本地新基建发展,反映了创新具有较强的空间溢出效应[32 -33 ] . ...
城市群能带动区域经济增长吗? 基于7个国家级城市群的实证分析
1
2021
... 城市化进程(UP)对新基建发展水平具有显著的正向影响(P <0.01).由于新基建旨在推进数字化、网络化和智能化等转型,而城市对其供给与需求能力往往更高,所以城市化进程有助于新基建发展.然而,城市化进程的空间滞后项对新基建发展水平的估计结果显示,周边地区城市化进程对当地新基建发展具有显著的负向传导作用,可能的原因在于城市的虹吸效应大于溢出效应[34 ] ,进而对本地新基建发展更有利. ...
城市群能带动区域经济增长吗? 基于7个国家级城市群的实证分析
1
2021
... 城市化进程(UP)对新基建发展水平具有显著的正向影响(P <0.01).由于新基建旨在推进数字化、网络化和智能化等转型,而城市对其供给与需求能力往往更高,所以城市化进程有助于新基建发展.然而,城市化进程的空间滞后项对新基建发展水平的估计结果显示,周边地区城市化进程对当地新基建发展具有显著的负向传导作用,可能的原因在于城市的虹吸效应大于溢出效应[34 ] ,进而对本地新基建发展更有利. ...
1
2009
... 此外,为了更好地体现各影响因素空间溢出的方向和大小,本文借鉴LeSage等[35 ] 的做法,根据拟合优度较好的时间固定效应SDM模型估计结果,求得偏微分进而估计各影响因素对新基建发展水平的直接影响和间接影响,结果见表5 .其中,经济发展水平(PGDP)对新基建发展水平的直接效应和总效应显著为正,表明经济发展对新基建发展的正向作用主要来源于本地,原因可能在于新基建的发展需要本地拥有足够的经济实力,同时地区经济发展,特别是在当前逐渐向数字经济转型的过程中又加大了对新基建的需求[36 ] ;产业结构高度化(AIS1)对新基建发展水平的直接效应显著为正,间接效应和总效应均未通过显著性水平检验,说明产业结构对新基建发展的影响集中体现于本地,原因主要在于本地区的产业结构决定着新基建的布局与发展方向,如工业为主的地区转型升级过程中会增加对工业互联网等新型基础设施的需求[37 ] ;产业结构合理化(AIS2)对新基建发展水平的直接效应和总效应均通过了1%的显著性水平检验,且方向为正,而其间接效应未通过显著性水平检验,表明产业结构合理化对新基建发展水平的影响主要来自本地,原因可能在于行政区划和市场分割等因素不利于跨区域的产业协调和资源流动[38 ] ,从而导致周边地区产业结构合理化对新基建的促进作用不明显;金融发展水平(FD)对新基建发展水平的直接效应和总效应均通过了显著性水平检验,方向均为正,表明金融发展水平对新基建建设的影响主要来自于本地,原因可能在于新基建的发展对资金的需求往往较大,需要大量的投融资,但由于当前关键核心技术能力不足、技术路线不确定、网络和信息安全、投融资机制不畅等问题的存在[4 ] ,导致周边地区金融能力对本地新基建发展的促进作用不明显;创新基础(INNO)对新基建发展水平的直接、间接和总效应均通过了显著性水平检验,表明区域内及周边地区创新基础均对本区域新基建发展具有积极影响,原因可能在于创新基础是人工智能、物联网、区块链等新型基础设施建设与维护的必要条件,而且创新又具有明显的溢出效应[39 ] ;城市化进程(UP)对新基建发展水平的直接效应和间接效应均通过了显著性水平检验,但两者的方向相反,证明了城市化进程对本地新基建发展有促进作用,而周边区域城市化进程对本地新基建发展具有抑制作用,即城市化进程主要以虹吸原理推进新基建发展,原因主要在于中国城市的智慧化转型加大了新基建的需求[40 ] ,而本地城市化进程对新基建的需求往往只需要在本地进行满足;人口规模(POP)对新基建发展水平的直接效应和间接效应均通过了1%的显著性水平检验,但直接效应的方向为正,间接效应的方向为负,进一步验证了人口规模与新基建的发展密切相关,人口规模越大越有利于新基建的发展,原因可能在于出于集约化考虑,新基建的建设更倾向于人口规模较大的区域. ...
中国数字经济发展的时空演化和分布动态
1
2021
... 此外,为了更好地体现各影响因素空间溢出的方向和大小,本文借鉴LeSage等[35 ] 的做法,根据拟合优度较好的时间固定效应SDM模型估计结果,求得偏微分进而估计各影响因素对新基建发展水平的直接影响和间接影响,结果见表5 .其中,经济发展水平(PGDP)对新基建发展水平的直接效应和总效应显著为正,表明经济发展对新基建发展的正向作用主要来源于本地,原因可能在于新基建的发展需要本地拥有足够的经济实力,同时地区经济发展,特别是在当前逐渐向数字经济转型的过程中又加大了对新基建的需求[36 ] ;产业结构高度化(AIS1)对新基建发展水平的直接效应显著为正,间接效应和总效应均未通过显著性水平检验,说明产业结构对新基建发展的影响集中体现于本地,原因主要在于本地区的产业结构决定着新基建的布局与发展方向,如工业为主的地区转型升级过程中会增加对工业互联网等新型基础设施的需求[37 ] ;产业结构合理化(AIS2)对新基建发展水平的直接效应和总效应均通过了1%的显著性水平检验,且方向为正,而其间接效应未通过显著性水平检验,表明产业结构合理化对新基建发展水平的影响主要来自本地,原因可能在于行政区划和市场分割等因素不利于跨区域的产业协调和资源流动[38 ] ,从而导致周边地区产业结构合理化对新基建的促进作用不明显;金融发展水平(FD)对新基建发展水平的直接效应和总效应均通过了显著性水平检验,方向均为正,表明金融发展水平对新基建建设的影响主要来自于本地,原因可能在于新基建的发展对资金的需求往往较大,需要大量的投融资,但由于当前关键核心技术能力不足、技术路线不确定、网络和信息安全、投融资机制不畅等问题的存在[4 ] ,导致周边地区金融能力对本地新基建发展的促进作用不明显;创新基础(INNO)对新基建发展水平的直接、间接和总效应均通过了显著性水平检验,表明区域内及周边地区创新基础均对本区域新基建发展具有积极影响,原因可能在于创新基础是人工智能、物联网、区块链等新型基础设施建设与维护的必要条件,而且创新又具有明显的溢出效应[39 ] ;城市化进程(UP)对新基建发展水平的直接效应和间接效应均通过了显著性水平检验,但两者的方向相反,证明了城市化进程对本地新基建发展有促进作用,而周边区域城市化进程对本地新基建发展具有抑制作用,即城市化进程主要以虹吸原理推进新基建发展,原因主要在于中国城市的智慧化转型加大了新基建的需求[40 ] ,而本地城市化进程对新基建的需求往往只需要在本地进行满足;人口规模(POP)对新基建发展水平的直接效应和间接效应均通过了1%的显著性水平检验,但直接效应的方向为正,间接效应的方向为负,进一步验证了人口规模与新基建的发展密切相关,人口规模越大越有利于新基建的发展,原因可能在于出于集约化考虑,新基建的建设更倾向于人口规模较大的区域. ...
世界级先进制造业集群竞争力提升机制及启示: 以德国工业4.0旗舰集群为例
1
2020
... 此外,为了更好地体现各影响因素空间溢出的方向和大小,本文借鉴LeSage等[35 ] 的做法,根据拟合优度较好的时间固定效应SDM模型估计结果,求得偏微分进而估计各影响因素对新基建发展水平的直接影响和间接影响,结果见表5 .其中,经济发展水平(PGDP)对新基建发展水平的直接效应和总效应显著为正,表明经济发展对新基建发展的正向作用主要来源于本地,原因可能在于新基建的发展需要本地拥有足够的经济实力,同时地区经济发展,特别是在当前逐渐向数字经济转型的过程中又加大了对新基建的需求[36 ] ;产业结构高度化(AIS1)对新基建发展水平的直接效应显著为正,间接效应和总效应均未通过显著性水平检验,说明产业结构对新基建发展的影响集中体现于本地,原因主要在于本地区的产业结构决定着新基建的布局与发展方向,如工业为主的地区转型升级过程中会增加对工业互联网等新型基础设施的需求[37 ] ;产业结构合理化(AIS2)对新基建发展水平的直接效应和总效应均通过了1%的显著性水平检验,且方向为正,而其间接效应未通过显著性水平检验,表明产业结构合理化对新基建发展水平的影响主要来自本地,原因可能在于行政区划和市场分割等因素不利于跨区域的产业协调和资源流动[38 ] ,从而导致周边地区产业结构合理化对新基建的促进作用不明显;金融发展水平(FD)对新基建发展水平的直接效应和总效应均通过了显著性水平检验,方向均为正,表明金融发展水平对新基建建设的影响主要来自于本地,原因可能在于新基建的发展对资金的需求往往较大,需要大量的投融资,但由于当前关键核心技术能力不足、技术路线不确定、网络和信息安全、投融资机制不畅等问题的存在[4 ] ,导致周边地区金融能力对本地新基建发展的促进作用不明显;创新基础(INNO)对新基建发展水平的直接、间接和总效应均通过了显著性水平检验,表明区域内及周边地区创新基础均对本区域新基建发展具有积极影响,原因可能在于创新基础是人工智能、物联网、区块链等新型基础设施建设与维护的必要条件,而且创新又具有明显的溢出效应[39 ] ;城市化进程(UP)对新基建发展水平的直接效应和间接效应均通过了显著性水平检验,但两者的方向相反,证明了城市化进程对本地新基建发展有促进作用,而周边区域城市化进程对本地新基建发展具有抑制作用,即城市化进程主要以虹吸原理推进新基建发展,原因主要在于中国城市的智慧化转型加大了新基建的需求[40 ] ,而本地城市化进程对新基建的需求往往只需要在本地进行满足;人口规模(POP)对新基建发展水平的直接效应和间接效应均通过了1%的显著性水平检验,但直接效应的方向为正,间接效应的方向为负,进一步验证了人口规模与新基建的发展密切相关,人口规模越大越有利于新基建的发展,原因可能在于出于集约化考虑,新基建的建设更倾向于人口规模较大的区域. ...
区域市场分割的影响因素及其空间邻近效应分析: 基于1989—2014年中国省际面板数据
1
2018
... 此外,为了更好地体现各影响因素空间溢出的方向和大小,本文借鉴LeSage等[35 ] 的做法,根据拟合优度较好的时间固定效应SDM模型估计结果,求得偏微分进而估计各影响因素对新基建发展水平的直接影响和间接影响,结果见表5 .其中,经济发展水平(PGDP)对新基建发展水平的直接效应和总效应显著为正,表明经济发展对新基建发展的正向作用主要来源于本地,原因可能在于新基建的发展需要本地拥有足够的经济实力,同时地区经济发展,特别是在当前逐渐向数字经济转型的过程中又加大了对新基建的需求[36 ] ;产业结构高度化(AIS1)对新基建发展水平的直接效应显著为正,间接效应和总效应均未通过显著性水平检验,说明产业结构对新基建发展的影响集中体现于本地,原因主要在于本地区的产业结构决定着新基建的布局与发展方向,如工业为主的地区转型升级过程中会增加对工业互联网等新型基础设施的需求[37 ] ;产业结构合理化(AIS2)对新基建发展水平的直接效应和总效应均通过了1%的显著性水平检验,且方向为正,而其间接效应未通过显著性水平检验,表明产业结构合理化对新基建发展水平的影响主要来自本地,原因可能在于行政区划和市场分割等因素不利于跨区域的产业协调和资源流动[38 ] ,从而导致周边地区产业结构合理化对新基建的促进作用不明显;金融发展水平(FD)对新基建发展水平的直接效应和总效应均通过了显著性水平检验,方向均为正,表明金融发展水平对新基建建设的影响主要来自于本地,原因可能在于新基建的发展对资金的需求往往较大,需要大量的投融资,但由于当前关键核心技术能力不足、技术路线不确定、网络和信息安全、投融资机制不畅等问题的存在[4 ] ,导致周边地区金融能力对本地新基建发展的促进作用不明显;创新基础(INNO)对新基建发展水平的直接、间接和总效应均通过了显著性水平检验,表明区域内及周边地区创新基础均对本区域新基建发展具有积极影响,原因可能在于创新基础是人工智能、物联网、区块链等新型基础设施建设与维护的必要条件,而且创新又具有明显的溢出效应[39 ] ;城市化进程(UP)对新基建发展水平的直接效应和间接效应均通过了显著性水平检验,但两者的方向相反,证明了城市化进程对本地新基建发展有促进作用,而周边区域城市化进程对本地新基建发展具有抑制作用,即城市化进程主要以虹吸原理推进新基建发展,原因主要在于中国城市的智慧化转型加大了新基建的需求[40 ] ,而本地城市化进程对新基建的需求往往只需要在本地进行满足;人口规模(POP)对新基建发展水平的直接效应和间接效应均通过了1%的显著性水平检验,但直接效应的方向为正,间接效应的方向为负,进一步验证了人口规模与新基建的发展密切相关,人口规模越大越有利于新基建的发展,原因可能在于出于集约化考虑,新基建的建设更倾向于人口规模较大的区域. ...
中国区域创新能力空间演化及其空间溢出效应
1
2017
... 此外,为了更好地体现各影响因素空间溢出的方向和大小,本文借鉴LeSage等[35 ] 的做法,根据拟合优度较好的时间固定效应SDM模型估计结果,求得偏微分进而估计各影响因素对新基建发展水平的直接影响和间接影响,结果见表5 .其中,经济发展水平(PGDP)对新基建发展水平的直接效应和总效应显著为正,表明经济发展对新基建发展的正向作用主要来源于本地,原因可能在于新基建的发展需要本地拥有足够的经济实力,同时地区经济发展,特别是在当前逐渐向数字经济转型的过程中又加大了对新基建的需求[36 ] ;产业结构高度化(AIS1)对新基建发展水平的直接效应显著为正,间接效应和总效应均未通过显著性水平检验,说明产业结构对新基建发展的影响集中体现于本地,原因主要在于本地区的产业结构决定着新基建的布局与发展方向,如工业为主的地区转型升级过程中会增加对工业互联网等新型基础设施的需求[37 ] ;产业结构合理化(AIS2)对新基建发展水平的直接效应和总效应均通过了1%的显著性水平检验,且方向为正,而其间接效应未通过显著性水平检验,表明产业结构合理化对新基建发展水平的影响主要来自本地,原因可能在于行政区划和市场分割等因素不利于跨区域的产业协调和资源流动[38 ] ,从而导致周边地区产业结构合理化对新基建的促进作用不明显;金融发展水平(FD)对新基建发展水平的直接效应和总效应均通过了显著性水平检验,方向均为正,表明金融发展水平对新基建建设的影响主要来自于本地,原因可能在于新基建的发展对资金的需求往往较大,需要大量的投融资,但由于当前关键核心技术能力不足、技术路线不确定、网络和信息安全、投融资机制不畅等问题的存在[4 ] ,导致周边地区金融能力对本地新基建发展的促进作用不明显;创新基础(INNO)对新基建发展水平的直接、间接和总效应均通过了显著性水平检验,表明区域内及周边地区创新基础均对本区域新基建发展具有积极影响,原因可能在于创新基础是人工智能、物联网、区块链等新型基础设施建设与维护的必要条件,而且创新又具有明显的溢出效应[39 ] ;城市化进程(UP)对新基建发展水平的直接效应和间接效应均通过了显著性水平检验,但两者的方向相反,证明了城市化进程对本地新基建发展有促进作用,而周边区域城市化进程对本地新基建发展具有抑制作用,即城市化进程主要以虹吸原理推进新基建发展,原因主要在于中国城市的智慧化转型加大了新基建的需求[40 ] ,而本地城市化进程对新基建的需求往往只需要在本地进行满足;人口规模(POP)对新基建发展水平的直接效应和间接效应均通过了1%的显著性水平检验,但直接效应的方向为正,间接效应的方向为负,进一步验证了人口规模与新基建的发展密切相关,人口规模越大越有利于新基建的发展,原因可能在于出于集约化考虑,新基建的建设更倾向于人口规模较大的区域. ...
从技术中心主义到人本主义: 智慧城市研究进展与展望
1
2022
... 此外,为了更好地体现各影响因素空间溢出的方向和大小,本文借鉴LeSage等[35 ] 的做法,根据拟合优度较好的时间固定效应SDM模型估计结果,求得偏微分进而估计各影响因素对新基建发展水平的直接影响和间接影响,结果见表5 .其中,经济发展水平(PGDP)对新基建发展水平的直接效应和总效应显著为正,表明经济发展对新基建发展的正向作用主要来源于本地,原因可能在于新基建的发展需要本地拥有足够的经济实力,同时地区经济发展,特别是在当前逐渐向数字经济转型的过程中又加大了对新基建的需求[36 ] ;产业结构高度化(AIS1)对新基建发展水平的直接效应显著为正,间接效应和总效应均未通过显著性水平检验,说明产业结构对新基建发展的影响集中体现于本地,原因主要在于本地区的产业结构决定着新基建的布局与发展方向,如工业为主的地区转型升级过程中会增加对工业互联网等新型基础设施的需求[37 ] ;产业结构合理化(AIS2)对新基建发展水平的直接效应和总效应均通过了1%的显著性水平检验,且方向为正,而其间接效应未通过显著性水平检验,表明产业结构合理化对新基建发展水平的影响主要来自本地,原因可能在于行政区划和市场分割等因素不利于跨区域的产业协调和资源流动[38 ] ,从而导致周边地区产业结构合理化对新基建的促进作用不明显;金融发展水平(FD)对新基建发展水平的直接效应和总效应均通过了显著性水平检验,方向均为正,表明金融发展水平对新基建建设的影响主要来自于本地,原因可能在于新基建的发展对资金的需求往往较大,需要大量的投融资,但由于当前关键核心技术能力不足、技术路线不确定、网络和信息安全、投融资机制不畅等问题的存在[4 ] ,导致周边地区金融能力对本地新基建发展的促进作用不明显;创新基础(INNO)对新基建发展水平的直接、间接和总效应均通过了显著性水平检验,表明区域内及周边地区创新基础均对本区域新基建发展具有积极影响,原因可能在于创新基础是人工智能、物联网、区块链等新型基础设施建设与维护的必要条件,而且创新又具有明显的溢出效应[39 ] ;城市化进程(UP)对新基建发展水平的直接效应和间接效应均通过了显著性水平检验,但两者的方向相反,证明了城市化进程对本地新基建发展有促进作用,而周边区域城市化进程对本地新基建发展具有抑制作用,即城市化进程主要以虹吸原理推进新基建发展,原因主要在于中国城市的智慧化转型加大了新基建的需求[40 ] ,而本地城市化进程对新基建的需求往往只需要在本地进行满足;人口规模(POP)对新基建发展水平的直接效应和间接效应均通过了1%的显著性水平检验,但直接效应的方向为正,间接效应的方向为负,进一步验证了人口规模与新基建的发展密切相关,人口规模越大越有利于新基建的发展,原因可能在于出于集约化考虑,新基建的建设更倾向于人口规模较大的区域. ...


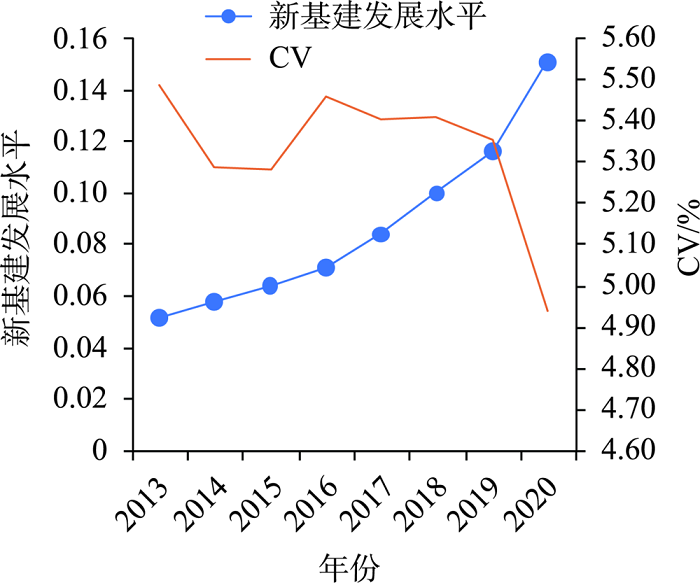
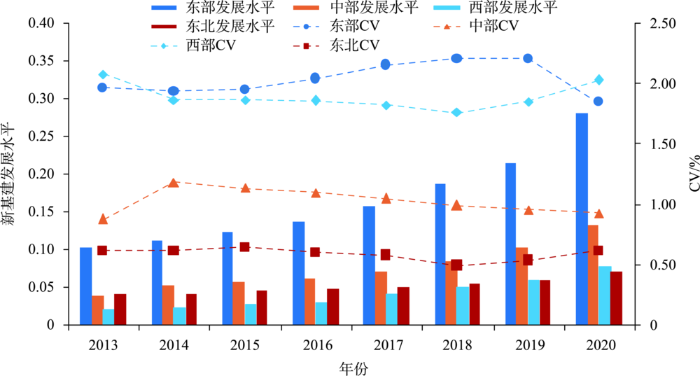
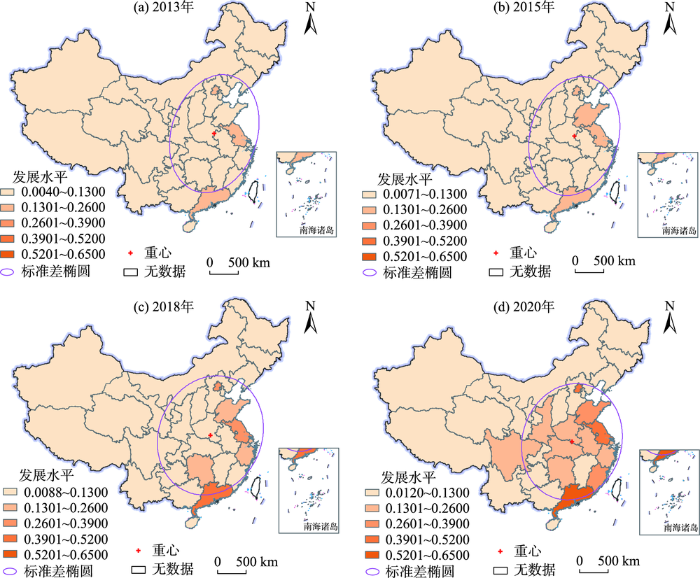

