

随着多灾种风险研究的兴起,国际上在多灾种风险评估方面取得重要进展。一方面是科研领域,综合考虑危险性、暴露度和脆弱性这3个因素,以及基于此建立的灾害风险评估框架成为国际灾害风险研究的主流[15⇓⇓-18]。例如,史培军等[19-20]基于灾害间的关系类型,提出了“灾害群”“灾害链”“区域灾害系统”的理论框架;美国联邦应急管理局针对地震、飓风和洪水灾害开发了基于地理信息综合平台的多灾种风险评估系统HAZUS-MH[21];灾害风险热点地区研究计划(The Hotspots Projects)选取洪水、龙卷风、干旱、地震、滑坡和火山6种主要灾害进行研究[22];张卫星等[23]基于汶川地震提出了灾害链风险评估的概念模型;刘文芳等[24]基于系统观点讨论了自然灾害链的断链减灾模式。另一方面,自2009年起,全球多个多灾种风险评估报告发布,包括:德国观察发布的全球气候风险指数报告(Global Climate Risk Index,CRI[25])、联合国减灾署发布的全球减少灾害风险评估报告(Global Assessment Report on Disaster Risk Reduction,GAR[26])、德国发展援助联盟(BüNdnis Entwicklung-Hilft)发布的世界风险指数(World Risk Index,WRI[27])、欧盟联合研究中心发布的世界风险管理指数报告(The Index for Risk Management Report,INFORM[28])、史培军教授和Roger Kasperson教授共同主编的世界自然灾害风险地图集(World Atlas of Natural Disaster Risk,WNDR[29])等。这些报告不仅是了解全球灾害风险格局的重要途径,也是维系国家间合作、实现区域灾害风险管理的重要技术支撑。
本文从自然灾害多灾种风险评估角度,选取GAR、INFORM、CRI、WRI、WNDR等5份国际权威报告,对比多灾种风险评估的模型方法,讨论其优缺点,以期为多灾种风险评估理论和方法研究提供借鉴。
1 数据与方法
1.1 报告的选取
本文选取2019年版GAR、2020年版INFORM、2021年版CRI、2020年版WRI和2015年WNDR等5份报告进行分析(表1)。上述报告由国际权威研究机构长期负责资料收集与评估,确保报告评估方法的一致性和评估结果的可比性,对国家(或地区)多灾种灾害风险进行测算和排名。
表1 5份评估报告的基本情况
Tab.1
| 报告名称 | 起始年份 | 选择年份 | 发布频次 | 发布机构 | 发布形式 | 官方网站 |
|---|---|---|---|---|---|---|
| CRI[25] | 2007 | 2021 | 每年 | 德国观察 | 年度报告 | |
| GAR[26] | 2009 | 2019 | 每2年 | 联合国减灾署 | 年度报告 | |
| WRI[27] | 2011 | 2020 | 每年 | 德国发展援助联盟 | 年度报告 | |
| INFORM[28] | 2014 | 2020 | 每年 | 欧盟联合研究中心 | 年度报告 | |
| WNDR[29] | 2015 | 2015 | 无 | 北京师范大学 | 书籍 |
1.2 对比方法
本文主要从风险评估的内容与理论方法、热点国家风险评估结果两大方面对5份国际权威全球风险评估报告进行对比。
首先,对比GAR、INFROM、WRI、CRI和WNDR中的风险评估内容与评估模型差异。评估内容重点从灾种覆盖、评估维度、评估结果表达及风险等级划分标准进行分析,评估模型重点从模型类型、指标体系和算法进行对比。
其次,对热点国家评估结果进行对比分析。 ① 根据中国海关总署发布的2020年全年中国进出口商品国别(地区)总值表[30],本文在与中国有贸易往来的149个国家中选取前20个贸易额较大的国家,包括:韩国、越南、马来西亚、俄罗斯、泰国、新加坡、印度尼西亚、沙特阿拉伯、菲律宾、意大利、阿联酋、智利、南非、波兰、伊拉克、土耳其、秘鲁、哈萨克斯坦、尼日利亚和缅甸,20个国家与中国的贸易额之和占中国与“一带一路”全部国家贸易额的77%,是中国的重要贸易伙伴[31]。② 5份评估报告中,GAR给出了风险排名前10位的国家(地区)及其位次,WNDR给出了参与评估的国家(地区)的风险评估排名,INFORM、WRI、CRI给出了参与评估的国家(地区)综合风险得分,因此,为了对比5份评估报告对中国和选取的20个国家的风险评估结果,本文首先将GAR和WNDR报告中国家风险排名转换为全球百分位次,进行全球风险排名的对比,再对INFORM、WRI和CRI的风险评估得分进行最大最小值归一化,并计算中位数,对比热点国家在各报告中的评估得分差异及其与全球整体风险水平的差距,归一化公式如下:
式中:
最后,总结上述报告的优缺点,对比分析其在多灾种风险评估领域的适用性,为进一步改进模型、优化指标选取提供参考。
2 结果分析
2.1 评估内容对比
总的来看,5份报告以国家为评估单元进行囊括部分灾种的多灾种灾害风险评估,但在具体的灾种覆盖、评估维度等方面有所差异。
(1) 从灾种覆盖来看:5份报告都囊括了洪水、气旋这2大类灾害;地震被囊括在除CRI之外的4份评估报告中;海平面上升仅被WRI作为评估对象;火山活动、滑坡、沙尘暴和火灾则只被WNDR作为评估对象。其中,WNDR中评估的灾害种类最多,GAR、INFROM、WRI均针对5个灾种进行评估,CRI仅聚焦于3种气象灾害,评估的灾害种类最少(表2)。
表2 5份报告的灾种覆盖和风险评估维度
Tab.2
| 报告 | 灾种覆盖 | 风险评估维度 |
|---|---|---|
| GAR | 地震、海啸、洪水、风暴潮、气旋 | 致灾因子、暴露度、脆弱性 |
| CRI | 洪水、气旋、极端气温 | 历史灾害 |
| INFORM | 地震、海啸、洪水、气旋、干旱 | 致灾因子、暴露度、脆弱性、应对能力 |
| WRI | 地震、洪水、气旋、干旱、海平面上升 | 暴露度、脆弱性、应对能力、适应能力 |
| WNDR | 地震、洪水、风暴潮、气旋、极端气温、干旱、火山活动、滑坡、沙尘暴、火灾 | 致灾因子、暴露度、脆弱性、孕灾环境 |
(2) 从评估维度来看:GAR采用国际主流的灾害风险评估框架——致灾因子(危险性)、暴露度、脆弱性进行风险评估,INFORM在此基础上加入了应对能力维度,除应对能力维度外,WRI还考虑了适应能力这一维度,WNDR则基于区域灾害系统理论,从孕灾环境、致灾因子、暴露度、脆弱性4个维度进行风险的计算,CRI则基于历史灾情信息进行评估,没有采用主流的风险评估体系(表2)。
(3) 对于评估结果的表达:GAR的结果以绝对损失值表征,用年均期望损失和最大可能损失表征风险大小,其中,年均期望损失是损失超越概率曲线的积分,最大可能损失值为250年重现期的灾害强度下对应的灾害损失值;WNDR、CRI、INFORM和WRI的评估结果为各自的灾害指数值,仅有相对意义,属于半定量风险评估,其中,WNDR的结果分辨率最高(表3)。5份报告评估结果均给出了国家单元的风险评估结果,并涵盖了世界上绝大多数国家及地区,其中123个国家被所有评估报告涵盖,未涵盖的国家(地区)大都是较小的岛屿国家(地区)。
表3 5份报告的评估内容
Tab.3
| 报告 | 灾种个数 | 国家/地区 个数 | 最小评估单元 | 风险表达 | 等级划分 |
|---|---|---|---|---|---|
| CRI | 3 | 182 | 国家(地区) | 气候风险指数 | 以评估得分数值10、20、50、100为界 |
| GAR | 5 | 216 | 国家(地区) | 年平均损失的期望值;最大可能损失 | 无 |
| WRI | 5 | 181 | 国家(地区) | 世界风险指数 | 分位数分级法 |
| INFORM | 5 | 191 | 国家(地区) | INFORM风险指数 | Ward最小方差准则 |
| WNDR | 10 | 195 | 0.5°×0.5° | 年平均伤亡人数的等级和年平均经济损失的等级 | 以评估得分的10%、35%、65%、90%分位数为界 |
(4) 对于评估结果的等级划分,CRI以评估得分的10、20、50、100为界划分5个风险等级;WRI采用分位数分级法,使得5个风险等级所包含的国家个数相同;INFORM则应用Ward最小方差准则,以离差平方和作为分级依据;WNDR以评估结果的10%、35%、65%、90%分位数为界划分为5级(表3)。
2.2 评估模型对比
从模型算法看,按照评估结果表达差异可以将多灾种风险评估分为定量风险评估和半定量风险评估(表4),前者能够得到绝对的风险数值,例如人口死亡概率、以万元计的经济损失风险等,后者只能得到风险指数值或等级值,反映评估对象之间的相对风险差异。
表4 5份风险评估报告中风险评估公式对比
Tab.4
| 报告 | 模型类型 | 模型公式 | 参数含义 |
|---|---|---|---|
| GAR | 定量风险评估 | AAL为灾害年期望损失,E(P|Event i)为事件i造成的期望损失,FA(Event i)为事件i年发生频次,Events为事件总数 | |
| WNDR | 半定量风险评估 | TRI指综合自然灾害相对风险等级;ri指灾种i的风险等级;wi指灾种i在综合自然灾害风险中所占的权重;n指自然灾害风险种类数 | |
| INFORM | 半定量风险评估 | ||
| WRI | 半定量风险评估 | ||
| CRI | 半定量风险评估 |
(1) 定量风险评估
定量风险评估一般使用经验模型、随机模型等计算各种重现期情景下的灾害强度,再量化致灾因子危险性与承灾体脆弱性的关系(如脆弱性曲线),得到基于损失的超越概率曲线,最后叠加单灾种的直接损失值,得到综合风险结果。
5份评估报告中,仅GAR采用了定量风险评估方法,其根据洪水、气旋、地震、海啸、风暴潮5个灾种的单灾种风险评估结果,再以各灾害年均发生次数为权重,加权得到多灾种的年均损失期望值。其中,单灾种风险评估分为4步——概率危险评估、暴露数据库构建、易损性曲线和脆弱性曲线计算以及风险评估。以洪水为例,GAR首先绘制了不同重现期洪水的致灾强度分布图,再从全球暴露数据库中提取房屋、资本存量等分布图,之后根据不同地区的损失率与致灾强度的关系,得到脆弱性曲线及对应的损失超越概率曲线,最后对损失超越概率曲线进行积分,得出由洪水导致的经济损失。
(2) 半定量风险评估
半定量风险评估往往通过单灾种加权或者构建风险指标体系等方法构建多灾种风险评估模型,得到风险指数或相对风险等级,这些方法缺乏表征损失的定量参数,常用于研究大尺度(如国家、区域)的多灾种风险格局。
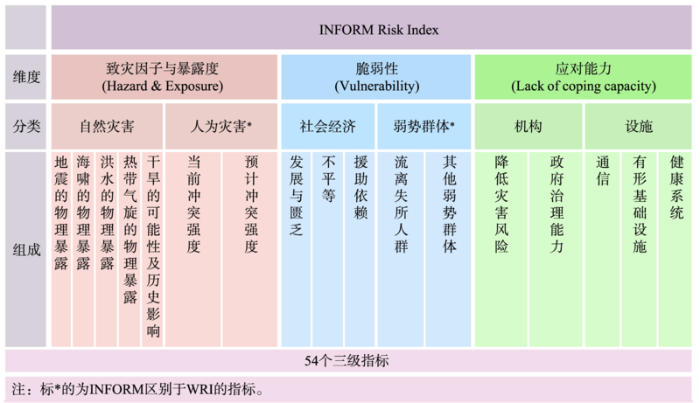
WNDR使用单灾种加权的方法,首先进行地震、台风、水灾、旱灾、滑坡泥石流、沙尘暴等12个灾种的单灾种风险评估,得到风险分级结果之后,再以各灾种发生的频次作为权重进行加权综合,得到多灾种综合风险等级。其中,单灾种风险评估根据不同灾种的致灾机理采用不同的方法分别评估。以洪水为例,首先使用全球格点降水数据,提取连续3天降水量大于95%分位数的极端降水序列,将其拟合到广义帕累托分布,并使用最小二乘法估计参数;然后,计算10、20、50、100年重现期的降水量,再与坡度、高程和距河流距离合并计算出洪水致灾强度;最后,将致灾强度指数分别与人口和GDP的暴露指数相乘,计算出每个栅格的经济损失风险和人口伤亡风险指数。INFORM同属于半定量风险评估,其利用54个指标构建了包含3个维度、6个一级指标、17个二级指标的多层风险评估模型,得到相应的风险指数,即INFORM Risk Index(图1)。
图1
式中:
其次,按照式(3)将标准化后的指标再次进行缩放。按照式(4)将缩放后的指标使用几何平均或算术平均的方式逐级向上聚合,即从三级指标开始,逐步聚合到二级指标、一级指标以及维度层。每次聚合后按照式(5)进行标准化,最后得到风险3个维度的得分。公式如下:
式中:
WRI构建了包含暴露度和脆弱性2个维度、27个三级指标的多层风险评估模型(图2)。
图2
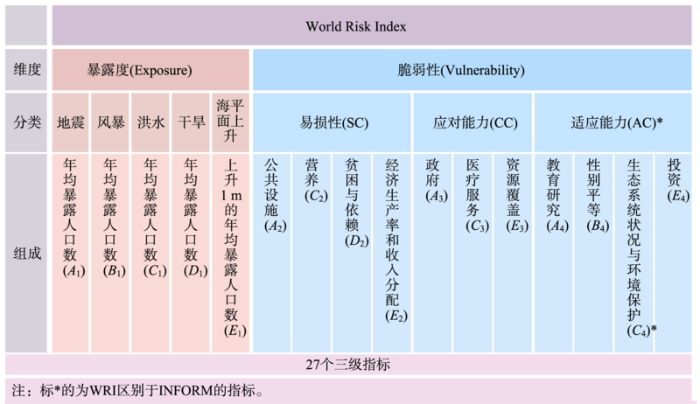
暴露度指数(Exposure)是各灾种的年均暴露人口数加权和与总人口数的商(式6)。脆弱性(Vulnerability)计算方式为:首先,将三级指标进行归一化处理,转换为0~1内的数值;其次,对各个二级指标包含的三级指标赋予同等权重,例如,二级指标“政府”包含了国家脆弱性指数和腐败感知指数,两者权重均为0.5;最后,将二级指标进行加权平均,得到敏感性(Susceptibility,SC)、应对能力(Coping Capacity,CC)和适应能力(Adaptive Capacity,AC)3个一级指标的数值(式8~10),并根据公式计算得到脆弱性指数(式7)。最终将暴露度指数与脆弱性指标相乘,得到最终的风险指数(World Risk Index)(表4),具体计算公式如下:
式中各变量含义如图2所示。
INFORM和WRI选用指标的相同点在于都涉及了政府治理、平等状况、营养条件、医疗救助、受教育程度和公共设施领域,其中完全重合的指标有7个。不同之处在于相比于WRI,INFORM注重暴力冲突因素以及不同的弱势群体,因此特别考虑了难民、幼儿、患病(包括艾滋病、结核病、疟疾)人群,同时也考虑了国际援助、食品安全以及近期受灾情况,这些都属于短期、具体的影响因素,与直接经济损失相关联。而相比于INFORM,WRI则额外考虑了环境因素,例如污水处理、农业管理水平等看似与灾害没有直接关联的因素,可以认为其相对关注长期的、间接的影响因素。
CRI则与上述方法不同:① CRI未采用主流的风险评估体系,主要基于历史灾害损失进行指标加权计算,CRI选取了人口、经济两方面的4个损失指标进行评估,指标数据全部来源于慕尼黑再保险公司创建的数据库,大大削减了在数据收集方面可能遇到的困难;② 重视相对指标的影响,即CRI计算公式中相对指标的权重是绝对指标的2倍;③ CRI并未直接使用这4个指标的绝对数值或进行归一化之后的数值进行计算,而是根据这些数值的相对排名计算最终风险(CRIScore)。
式中:
综上所述,GAR和WNDR分别属于定量风险评估和半定量风险评估,均首先进行单灾种风险评估,再采用一定的方式进行综合,并考虑到了不同强度的灾害类型,但是评估过程较为复杂,需要进行致灾危险性的模拟;INFORM和WRI在主流风险评估模型的框架下,分别构建了包含54、27个综合指标的风险评估模型,但忽视了各灾种在不同强度下的风险差异,而CRI数据来源独特,指标精简,计算简便,强调相对风险,但是基于历史灾害进行的指数风险评估很难反映未来气候变化等对风险的影响。此外,除CRI之外的4份报告都充分考虑了自然区域的差异,依据不同灾种的时空影响范围来确定致灾因子强度或指标大小,并以格网为起算单元,以国家作为最终的评估单元进行风险评估。
2.3 评估结果对比
2.3.1 中国灾害风险等级在全球的位次
从5份报告对中国灾害风险在全球位次的评估结果来看:① GAR和WNDR在绝对风险评估结果中对中国灾害风险评级较高,均处于全球前2%,这与中国人口总量和经济体量较大密切相关;② 其余3份评估报告从指数风险评估认为中国风险等级基本处于中等或中等偏上水平(表5)。这种差异说明了风险评估容易受到最基本评估单元大小的影响。
表5 5份评估报告对中国风险评估位次的对比
Tab.5
| 报告 | 评估指标 | 得分 | 全球中位数 | 排名 | 国家(地区)总数 | 全球百分位次 |
|---|---|---|---|---|---|---|
| WNDR | 绝对人口风险 | 无 | 无 | 2 | 195 | 1.03% |
| 绝对经济风险 | 无 | 无 | 3 | 196 | 1.53% | |
| GAR | 绝对损失风险 | 无 | 无 | 3 | 216 | 1.39% |
| CRI | CRI score | 42.83 | 79.67 | 32 | 130 | 24.62% |
| INFORM | INFORM risk index | 4.20 | 3.70 | 71 | 191 | 37.17% |
| WRI | World risk index | 5.84 | 6.42 | 100 | 181 | 55.25% |
2.3.2 热点国家风险评估位次对比
5份评估报告中,INFORM、WRI和CRI给出了国家(地区)综合风险得分,INFORM、WRI、CRI和WNDR给出了国家综合风险排名。根据全球中位数与得分的相对关系,越南、泰国、印度尼西亚、菲律宾、南非、秘鲁、尼日利亚、缅甸8个国家在INFORM、WRI、CRI等3份评估报告中的得分均高于其中位数(图3),新加坡、阿联酋、波兰、哈萨克斯坦4个国家风险评分均低于中位数。其中,新加坡在3份报告中都属于风险“极低”的国家,主要得益于其对灾害的暴露度较低,且新加坡作为发达国家,有较高的风险管控水平与能力。
图3
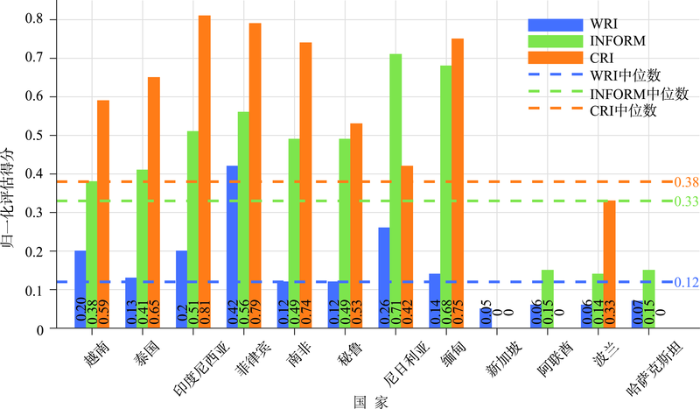
图3
热点国家中归一化风险评分较高及较低的12个国家
Fig.3
The twelve countries with high or low normalized risk scores among the hotspot countries
INFORM、WRI、CRI等3份风险评估还存在一些差别较大的地方(表6)。例如,马来西亚在WRI的评估结果中为“高”风险国家,而在INFORM和CRI的评估结果中属于“低”风险国家;智利虽然面临着地震、海啸、火山喷发的多重风险,但在INFORM中,由于其脆弱性极低以及良好的应对能力,排名靠后,属“低”风险国家;对于土耳其的风险评估,INFORM给出了“高”风险的评价,与WRI和CRI的结果不一致,主要是因为INFORM中涵盖了地区武装冲突风险的评估,而土耳其在这一维度的评分较高。
表6 INFORM、WRI、CRI中评估结果差异较大的国家对比
Tab.6
| 国家 | WRI | INFORM | CRI | |||||||
|---|---|---|---|---|---|---|---|---|---|---|
| 归一化指数 | 风险等级 | 归一化指数 | 风险等级 | 归一化指数 | 风险等级 | |||||
| 马来西亚 | 0.15 | 高 | 0.31 | 低 | 0.27 | 低 | ||||
| 智利 | 0.24 | 极高 | 0.27 | 低 | 0.74 | 中等 | ||||
| 土耳其 | 0.10 | 低 | 0.53 | 高 | 0.45 | 低 | ||||
从20个热点国家及全球得分的中位数来看(表7),WNDR、INFORM和CRI在热点国家的中位数均高于全球中位数,可以认为“一带一路”沿线国家(地区)的风险水平略高于全球水平。
表7 热点国家与全球各国风险评估位次的中位数对比
Tab.7
| 指标 | WNDR | INFORM | WRI | CRI | ||||||||||
|---|---|---|---|---|---|---|---|---|---|---|---|---|---|---|
| 伤亡人数 | 经济损失 | 原始值 | 归一化 | 原始值 | 归一化 | 原始值 | 归一化 | |||||||
| 热点国家中位数 | 33.5 | 31.0 | 3.75 | 0.382 | 6.18 | 0.119 | 60.17 | 0.500 | ||||||
| 全球中位数 | 98.0 | 98.5 | 3.70 | 0.376 | 6.42 | 0.124 | 79.67 | 0.668 | ||||||
| 数值与风险大小的关系 | 数值越小,风险越高 | 数值越大,风险越高 | 数值越大,风险越高 | 数值越小,风险越高 | ||||||||||
综上,风险评估结果不仅会受到评估单元人口和经济体量的影响,还会受覆盖灾种以及脆弱性的影响,特别是在权重设置方面,需要格外注意某些因素的加入是否会使结果产生较大偏差。
2.4 优缺点分析
以上5份风险评估报告在风险评估方法、适用性等方面都各有异同。共同之处在于:① 均适用于大到国家、小到地区的多灾种风险评估;② 主要关注发生频率高、造成损失大的灾种,如洪水、气旋;③ 风险评估结果对风险管理有重要指导价值,但同时也存在着诸如评估模型复杂、覆盖面不够等不足之处,具体优缺点如表8所示。从科学性来说,GAR和WNDR对各灾种采取不同模型进行模拟分析评估,专业性最强。从评估流程来说,CRI、WRI和INFORM评估指标来源清晰,评估模型简洁易操作,评估结果完整;GAR和WNDR的评估过程则相对复杂,对原始数据处理要求较高。从评估结果呈现来说,CRI和INFORM评估结果呈现较为丰富,风险评估结果高低可以通过不同层级评估结果进行解释。
表8 5份国际权威报告的优缺点
Tab.8
| 报告 | 主要优点 | 主要缺点 |
|---|---|---|
| GAR | ① 专业性和科学性强 ② 不同灾种采取不同评估方法 ③ 根据不同地理条件划分各灾种分区 | ① 模型模拟要求高、计算较复杂 ② 缺乏持续动态更新机制 ③ 原有空间数据信息平台关停,普通大众难以获取 |
| INFORM | ① 评估模型易操作、输入数据来源有保障 ② 考虑暴力冲突等人为灾害 ③ 充分考虑各种社会经济因素 | ① 没有考虑预警系统对风险的影响 ② 风险因子权重设定受主观因素影响 |
| WRI | ① 评估方法明确 ② 各项指标数据给出清晰来源 ③ 考虑海平面上升带来的风险 | ① 没有考虑灾害的致灾强度 ② 脆弱性维度覆盖领域较少 ③ 风险因子权重受主观因素影响 |
| WNDR | ① 灾种覆盖全面 ② 对各灾种不同强度进行分级 ③ 分别计算人口损失和经济损失 | ① 评估流程比较复杂 ② 缺乏动态评估更新机制 |
| CRI | ① 评估目的明确 ② 评估方法简便,易于推广 | ① 仅考虑历史灾害损失特征 ② 未应用国际通用的灾害风险分析框架 |
总体来看,多灾种风险评估不仅要兼顾专业性和实用性,还要考虑动态更新及不同尺度的适用性,以便随着风险评估需求的改变而调整。
3 结论与讨论
鉴于多灾种风险评估理论方法体系欠缺,本文从评估内容、评估模型、评估结果3个方面对5份国际权威报告进行了对比分析,结果表明:
(1) 国内外5份国际权威风险评估报告具有各自完备的方法体系,综合考虑主要灾害及其风险,在国家尺度的灾害风险评估得到广泛应用,并可以根据数据可及性进一步细化到区域层面,为国际防灾减灾决策提供了依据。
(2) 评估目标各有侧重。例如,WNDR的重点是展示灾害及其风险的全球分布,其于2015年进行了10大类灾种的单灾种风险评估和综合自然灾害风险评估,覆盖面最广,但缺乏动态评估及发布机制,无法追踪风险的动态变化,加强相关研究有助于捕捉风险要素的动态变化过程[34],加深对灾害系统的理解,因此,构建持续的风险评估机制有利于各个国家和地区对风险的准确识别,以有效避免减灾措施的盲目实施,从而加强国际援助的针对性提高各国抵御风险的能力。
(3) 从模型方法来看,CRI、INFORM、WRI通过构建指标体系直接进行综合风险评估,无需对单灾种进行评估,计算方法相对简便,但目前在建筑状况、备灾/早期预警、社交网络、对气候变化的适应等领域仍缺少相关的数据支持。在应用性方面,GAR用直接经济损失绝对值的年期望表征风险大小,其他4份报告则用模型输出指标的数值(相对值)表征,相对等级(或数值)虽有意义,但无法与其他风险指标相比较,且难以同实际的社会—经济指标建立关联。未来可以参照INFORM等指标体系的构建与GAR的风险表征方法,结合风险管理需求及数据可用性,开展不同尺度的风险评估研究。
(4) 5份国际权威报告中,除GAR外均给出了具体的输出结果,对评估结果的中位数分析表明, INFORM、WRI、CRI等3份报告的热点国家的中位数高于全球中位数,表明“一带一路”沿线国家(地区)的风险水平高于全球水平,与“一带一路”伤亡人口和GDP损失率的年期望较高的结论一致,崔鹏等[35]的研究也表明,“一带一路”沿线国家自然灾害较为频繁,损失相对严重。因此,需要深化多灾种综合风险评估方法的研究和实践,探索区域联动的灾害风险管理体系。
(5) 综合来看,WNDR灾种覆盖最为全面;GAR的评估专业性强,且结果可直接与GDP等经济指标相比较;INFORM和WRI的指标体系类似,但在脆弱性评估方面各有侧重;CRI的针对性最强,更适用于气候变化领域的研究。
多灾种自然灾害风险评估的涉及面较广,内容复杂,当前大多数多灾种风险评估为半定量评估,得到的是相对风险水平或等级,难以实现灾害风险量化研究,而从灾害管理的角度来看,由单灾种转向多灾种、单一数据源转向多源数据融合[36]、半定量转向定量的风险评估是大势所趋,只有准确、可比、有实际意义的多灾种风险评估才能为减灾提供切实可行的依据。
参考文献
五论灾害系统研究的理论与实践
[J].
Theory and practice on disaster system research in a fifth time
From single to multi-hazard risk analyses: A concept addressing emerging challenges
[C]//
A review of quantification methodologies for multi-hazard interrelationships
[J].
自然灾害链的场效机理与区链观
[J].
Field effect and regional conversion as the mechanism of natural hazard chains
灾害系统: 灾害群、灾害链、灾害遭遇
[J].
Disaster system: Disaster cluster, disaster chain and disaster compound
A multi-hazards earth science perspective on the COVID-19 pandemic: The potential for concurrent and cascading crises
[J].DOI:10.1007/s10669-020-09772-1 URL [本文引用: 1]
Fragility of transport assets exposed to multiple hazards: State-of-the-art review toward infrastructural resilience
[J].
Review of methods to assess, design for, and mitigate multiple hazards
[J].DOI:10.1061/(ASCE)CF.1943-5509.0000279 URL [本文引用: 2]
Vulnerability of bridges to individual and multiple hazards-floods and earthquakes
[J].
Assessing physical vulnerability for multi-hazards using an indicator-based methodology
[J].DOI:10.1016/j.apgeog.2011.07.002 URL [本文引用: 1]
Vulnerability and risk of deltaic social-ecological systems exposed to multiple hazards
[J].DOI:10.1016/j.scitotenv.2018.03.013 URL [本文引用: 1]
灾害链灾情累积放大研究方法进展
[J].
DOI:10.11820/dlkxjz.2014.11.007
[本文引用: 1]

近年来全球范围内频发的重大自然灾害事件,表明一种灾害引发一系列次生灾害的灾害链现象使得灾情通过累积放大效应而大大超过单一灾种灾情,深入研究灾害链灾情累积放大过程是有效防范巨灾风险的前提.首先,本文梳理了国内外研究中不同视角下对灾害链现象的理解,认为灾害链一般性概念中应当包含孕灾环境、致灾因子链、承灾体以及它们在时间和空间上复杂相互作用关系,只有从地理学的综合性角度出发,才能正确而完整的理解灾害链过程灾情累积放大机制.其次,按研究思路的差异,综述了当前研究灾害链灾情累积放大过程的5 类方法,包括经验地学统计方法、概率模型、复杂网络模型、灾害模拟以及多学科理论方法.从描述灾害链要素在时间和空间上复合作用的角度出发,分别讨论了它们在刻画灾害链灾情放大过程中的优势与不足.选取了影响较大、灾害引发关系典型的地震灾害链与台风灾害链,从灾种维度综述上述几种方法在实际应用中的概况及进展.最后,提出综合多种方法发展与完善灾害链灾情累积放大效应过程的动态模拟是灾害链的研究趋势,其中关键在于模拟灾害链系统各要素的时间与空间上的耦合,研究思路从“静态—描述—解释”向“动态—过程—模拟”的转变是理解灾害链、灾害系统复杂性的重要途径.
Review on research methods of disaster loss accumulation and amplification of disaster chains
DOI:10.11820/dlkxjz.2014.11.007
[本文引用: 1]
In recent years, the frequent catastrophic disasters have caused great losses of human lives and properties in the world. This indicates that disaster losses may be accumulated and amplified through disaster chains, in which one disaster triggers another, and so forth. The losses are much heavier in disaster chains than in a single disaster. Disaster chain is a typical complex form of regional disaster system. Understanding the amplification mechanisms of disaster chains is very important in catastrophe risk governance. This review first focuses on the concepts and understandings of disaster chain and summarizes a comprehensive definition from the geographic perspective through literature research. It is found that disaster chains have two common features, including the casualty relationship between different disasters and the spatial and temporal expansion of disaster losses. Only under a geographical framework, a sound and complete understanding of the disaster chain concept may be possible. A regional disaster system includes the environment, hazards, and exposure units and the complex spatial and temporal interactions of these elements. Second, considering the different research philosophies, five method categories in recently disaster chain research are summarized and analyzed. The five categories include empirical statistics methods, probabilistic models, complex network models, disaster system simulations, and multidisciplinary theories. The appropriateness and disadvantages of each category of methods are discussed with respect to their utility in describing disaster chain loss accumulation and amplification. Empirical statistics methods are a classical one that often use weighted average of a series of indicators. They have great advantage in taking into consideration various geographic factors and the modeling process is simple. But these methods cannot reveal the disaster chain evolution and processes. Probabilistic models can generate an overview of all possible events after a disaster have happened, as well as calculate the conditional probability. But they have the same problem as the statistics models. Disaster chain is a typical complex network. So the complex network theory may be used to describe the evolution of disaster chain networks. Such method should consider the spatial and temporal features of the disaster chain components in order to make the result more precise. Simulation methods are a promising one that can support the understanding of disaster chains dynamics, as well as the mechanism of the accumulation and amplification of disaster chain losses. However, simulation precision should be improved by including the spatial and temporal features of disaster chains in the future. Two types of important disaster chains, the seismic and typhoon disaster chains were used as examples to show the practical application of these methods. Finally, this review shows that the main trend of disaster chain research is to build and improve the dynamical model of disaster chain loss accumulation and amplification processes. The key is to connect all the factors spatially and temporally in a disaster chain system. It is necessary to transform the research approaches from "static-descriptive-explanatory" to "dynamic-process oriented-simulation" in order to understand the complexity of a disaster system.
Urban diagnosis and integrated disaster risk management
[J].
Comprehensive approach for probabilistic risk assessment (CAPRA): International initiative for disaster risk management effectiveness
[R].
Climate change 2014:Impacts, adaptation and vulnerability, Part A:Global and sectoral aspects
三论灾害研究的理论与实践
[J].
Theory on disaster science and disaster dynamics
四论灾害系统研究的理论与实践
[J].
Theory and practice on disaster system research in a fourth time
Using HAZUS-MH for risk assessment
[R].
灾害链风险评估的概念模型: 以汶川5·12特大地震为例
[J].
Conceptual model of disaster chain risk assessment: Taking Wenchuan Earthquake on 12 May 2008 as a case
DOI:10.11820/dlkxjz.2013.01.014
[本文引用: 1]
A vast number of cases have demonstrated that a major disaster can trigger a series of secondary disasters, forming a disaster chain with much more destructive power than a single-type disaster. Understanding the process of disaster chain formation and establishing a conceptual model for risk assessment are the premise for governance of the disaster chain risk. In this paper, we first reviewed the chain risk assessment models from the studies at home and abroad, e.g., the accident chain, supply chain and so on, and then, taking Wenchuan Earthquake as a case study, we proposed a new conceptual model of disaster chain risk assessment. The two major conclusions are: (1) sensitivity of the environment susceptible to disasters is an important impact factor, which determines the probability of disaster chain. Therefore, the key aspect of risk assessment is to identify the factors affecting the sensitivity of the environment and characterize their quantitative relationships. (2) Vulnerability of a disaster-affected area in a disaster chain increases after incurring repeated hazards; evaluation of change of the vulnerability of the area will improve the precision of disaster chain risk assessment. This study aims to improve the theory on disaster system research and provide a basis for further improvement of disaster chain risk governance.
自然灾害链及其断链减灾模式分析
[J].
Analysis of natural disaster chain and chain-cutting disaster mitigation mode
Global climate risk index 2021
[R].
Global assessment report on disaster risk reduction 2019
[R].
World risk report 2020
[R].
INFORM report 2020: Shared evidence for managing crises and disasters
[R].
World atlas of natural disaster risk
[M].
中国统计年鉴
[J].
Chinese statistical yearbook
Index for risk management INFORM concept and methodology report, Version 2017
[R].
The determinants of vulnerability and adaptive capacity at the national level and the implications for adaptation
[J].DOI:10.1016/j.gloenvcha.2004.12.006 URL [本文引用: 1]
透视大尺度综合自然灾害风险评估的主要进展和展望
[J].
Perspective on the main progress and prospect of large-scale integrated natural disaster risk assessment
“一带一路”自然灾害风险与综合减灾
[J].
Natural disaster risk and comprehensive disaster reduction along the Belt and Road
社交媒体数据在自然灾害应急管理中的应用研究综述
[J].
DOI:10.18306/dlkxjz.2020.08.014
[本文引用: 1]
社交媒体是灾害应急管理的一个新兴但尚未充分利用的大数据源。然而,社交媒体数据在灾害应急管理中能发挥什么作用,目前国内的研究较少,而国外的研究亦较为分散,相关应用受限。论文对国内外利用社交媒体数据进行灾害管理相关研究进行了综述,归纳出社交媒体数据在灾害应急管理中应用的潜力、优势和问题。结果发现:① 社交媒体数据含有丰富的灾害信息,能够依靠态势感知和信息共享支持灾害预警、实时监测、损失和救助需求评估、协助快速应急响应以及预测可能的灾害风险等灾害管理工作;② 社交媒体数据的优势在于能保证灾害信息的实时性和连续性,进而提供致灾强度图、损失预测和舆情分析等结果服务于灾害应急管理;③ 地理位置信息有限、专业语料库缺乏、信息噪声处理的复杂性等原因使社交媒体数据分析结果精度受限。如何发挥社交媒体数据社会感知的优势,以弥补传统观测调查手段的不足,更加科学应对灾害应急,仍需要在社交媒体数据处理及多源数据融合分析技术方面取得突破。
A review on the application of social media data in natural disaster emergency management
DOI:10.18306/dlkxjz.2020.08.014
[本文引用: 1]
Social media is a data source that is emerging but underutilized for disaster emergency management. There are few existing studies on the role of social media data in disaster emergency management in China, and international studies are also relatively scattered, which make relevant applications limited. This article reviewed the research on disaster management with social media data. We summarized the potential, advantages, and problems of applying social media data in disaster emergency management. The results show that: 1) Social media data are full of disaster information. They can support disaster early warning, real-time monitoring, and loss and rescue needs assessment, assist rapid emergency response, and predict possible disaster risks that relies on situational awareness and timely information. 2) The advantage of social media data is that it can ensure the timeliness and continuity of disaster information aquisition, which can provide disaster intensity maps, loss prediction, and public opinion analysis for disaster emergency management. 3) Some problems limit the accuracy of social media data analysis results, including limited geographical location information, lack of professional corpus, and complexity of information noise processing, among others. In order to make full use of the advantages of social media data to overcome the shortcomings of traditional observation and investigation methods and respond to disasters more scientifically, breakthroughs in social media data processing and multi-source data fusion analysis technology are needed.
Reviewing and visualizing the interactions of natural hazards
[J].DOI:10.1002/2013RG000445 URL [本文引用: 1]
Challenges of analyzing multi-hazard risk: A review
[J].DOI:10.1007/s11069-012-0294-2 URL [本文引用: 1]
A review of multi-risk methodologies for natural hazards: Consequences and challenges for a climate change impact assessment
[J].
DOI:10.1016/j.jenvman.2015.11.011
PMID:26704454
[本文引用: 1]
This paper presents a review of existing multi-risk assessment concepts and tools applied by organisations and projects providing the basis for the development of a multi-risk methodology in a climate change perspective. Relevant initiatives were developed for the assessment of multiple natural hazards (e.g. floods, storm surges, droughts) affecting the same area in a defined timeframe (e.g. year, season, decade). Major research efforts were focused on the identification and aggregation of multiple hazard types (e.g. independent, correlated, cascading hazards) by means of quantitative and semi-quantitative approaches. Moreover, several methodologies aim to assess the vulnerability of multiple targets to specific natural hazards by means of vulnerability functions and indicators at the regional and local scale. The overall results of the review show that multi-risk approaches do not consider the effects of climate change and mostly rely on the analysis of static vulnerability (i.e. no time-dependent vulnerabilities, no changes among exposed elements). A relevant challenge is therefore to develop comprehensive formal approaches for the assessment of different climate-induced hazards and risks, including dynamic exposure and vulnerability. This requires the selection and aggregation of suitable hazard and vulnerability metrics to make a synthesis of information about multiple climate impacts, the spatial analysis and ranking of risks, including their visualization and communication to end-users. To face these issues, climate impact assessors should develop cross-sectorial collaborations among different expertise (e.g. modellers, natural scientists, economists) integrating information on climate change scenarios with sectorial climate impact assessment, towards the development of a comprehensive multi-risk assessment process. Copyright © 2015 Elsevier Ltd. All rights reserved.
Multi-hazard susceptibility and exposure assessment of the Hindu Kush Himalaya
[J].
