

目前对梅雨发生的天气气候成因已经取得了较多认识[2,5,8]。东亚梅雨季节的气候背景主要为西太平洋副热带高压呈纬向分布,其脊线自日本南部延伸至中国南部,亚洲高纬度环流表现为从贝加尔湖以东至鄂霍次克海的单一阻塞型,中国江淮流域和日本南部一带受季风输送的暖湿水汽影响而形成梅雨带[2,9]。梅雨的季节内振荡受热带环流低频振荡和北纬冷空气入侵影响较多[2,10],年际变化则与El Niño事件、对流层双年振荡(TBO)和青藏高原东南缘上游地表潜热通量有关[11⇓-13],年代际变化受北大西洋多年代际涛动(AMO)和北太平洋年代际涛动(PDO)影响[14-15],而且很大程度上梅雨与东亚夏季风的年代际变化有相反的趋势[13,16-17],梅雨特征的长期变化还与城市化、大气气溶胶增多密切相关[2,6,18]。
20世纪60年代后期以来,国家气候中心和中央气象台主要采用长江中下游5个气象站(武汉、九江、芜湖、南京和上海)的降水资料和副高脊线位置识别梅雨过程[19-20],但各地在确定区域入梅日和出梅日时所采用的指标和阈值不尽相同[8,21]。伴随着非典型梅雨的出现,梅雨的降水规律和监测范围发生变化,梅雨判别标准也随之变化[21-22]。中国气象局2014年印发的《梅雨监测业务规定(试行)》规范了国家级和省级梅雨监测业务,赵俊虎等[20]、陈旭等[23]和罗小杰等[24]基于此规定识别和分析江淮梅雨。国家气候中心2017年发布的《梅雨监测指标》(GB/T 33671—2017)(以下简称“国标”)统一了国家和地方的梅雨监测业务,国标采用逐日降水和气温数据,结合副高脊线位置识别梅雨过程,适用于梅雨监测、预报预测、评估及服务[1,6,25]。梅雨监测指标相关的研究一类为直接使用国家气候中心提供的梅雨监测数据分析梅雨异常特征及其成因[4⇓-6,26],另一类依据国标识别某局部区域的梅雨过程,进而分析梅雨监测指标的特征[8,25,27⇓-29]。
在气候变化和城市化背景下,中国东部的降水特征发生了变化,主要表现为极端降水的频率和强度明显增加,连续降水及弱降水减少,强降水增加,空间异质性增强[2,30⇓⇓⇓⇓⇓⇓-37],目前多是在全年或雨季(4—9月)进行降水特征研究,江淮流域梅雨监测指标和梅雨期降水时空变化特征的研究还比较少。本文使用1961—2020年江淮流域梅雨监测区内239个气象站的逐日降水和气温数据、美国国家环境预报中心和国家大气研究中心(NCEP/NCAR)的500 hPa位势高度场数据,按照国标识别3个子区域的梅雨过程,分析入梅日、出梅日、梅雨期长度、梅雨雨强和梅雨强度指数等梅雨监测指标的时空变化特征,将梅雨期降水分为小雨、中雨、大雨和暴雨4个降水量级,研究不同降水量级的雨日数、降水发生率、降水量和降水贡献率的时空变化特征,最后定量计算城市化对梅雨期强降水的贡献,以期深入认识江淮流域梅雨期降水时空特征,为区域水文预报、防汛调度及水资源调度等工作提供参考。
1 资料与方法
1.1 研究区域与数据介绍
江淮流域梅雨监测区位于28°~34°N,110°~123°E,涉及浙江省、江苏省、安徽省、江西省、湖南省、湖北省和上海市,国标将江淮流域分为江南区(Ⅰ区)、长江中下游区(Ⅱ区)和江淮区(Ⅲ区)等3个子区域[1,4]。本文选用1961—2020年239个气象站点逐日降水和逐日平均气温资料,数据来源于中国气象数据网(
图1
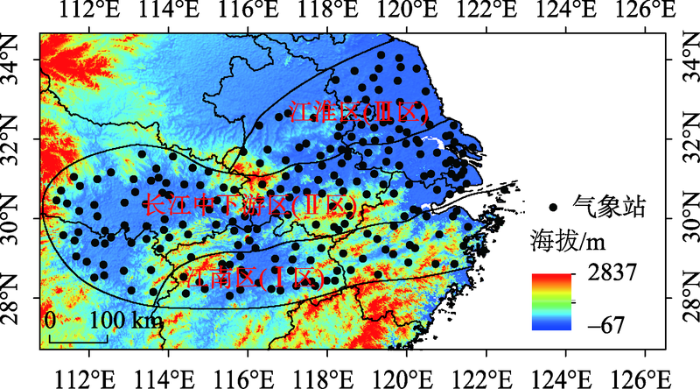
图1
江淮流域梅雨监测站点位置
Fig.1
Spatial distribution of Meiyu monitoring stations over the Yangtze-Huai River Basin
1.2 梅雨过程识别及梅雨强度计算
1.2.1 梅雨过程识别
梅雨过程识别步骤简述如下(详细过程请参见国标[1]):
(1) 识别子区域的梅雨期,首先根据子区域日降水量确定区域雨日、雨期开始日、雨期结束日和雨期,然后用500 hPa位势高度场和纬向风场确定副高脊线位置,最后结合日平均气温得到入梅日和出梅日,入梅日至出梅日前一天的累计日数即为该区域的梅雨期长度。
(2) 确定江淮流域的梅雨季节,将3个区域梅雨期的最早入梅日作为梅雨季节的入梅日,将最晚出梅日作为梅雨季节的出梅日,江淮流域入梅日至出梅日前一天的累计日数即为梅雨季长度。
1.2.2 梅雨强度计算
子区域梅雨雨强P为区域内所有梅雨监测站在梅雨期总降水量的均值,其计算公式为:
式中:
子区域梅雨强度指数
式中:
表1 区域梅雨强度指数的等级划分
Tab.1
| 等级 | 弱 | 偏弱 | 正常 | 偏强 | 强 |
|---|---|---|---|---|---|
| -1.25< | -0.375< | 0.375< |
江淮流域梅雨雨强为以上3个区域梅雨雨强的平均值,江淮流域梅雨强度指数为以上3个区域梅雨强度指数的平均值。
1.3 研究方法
式中:
某降水量级的降水发生率
式中:
式中:当
2 结果与分析
2.1 江淮流域及其各子区域入梅日、出梅日和梅雨季/期长度时空特征
由图2可知,江淮流域1961—2020年平均入梅日为6月8日,南部的Ⅰ区于6月9日入梅,Ⅱ区、Ⅲ区依次为6月15日和6月21日入梅。入梅日年际波动较大,在不考虑空梅的情况下,江淮流域最早入梅日比最晚入梅日早32 d,Ⅰ区最早入梅日比最晚入梅日早33 d,Ⅱ区最早入梅日比最晚入梅日早44 d,Ⅲ区最早入梅日比最晚入梅日早41 d。
图2
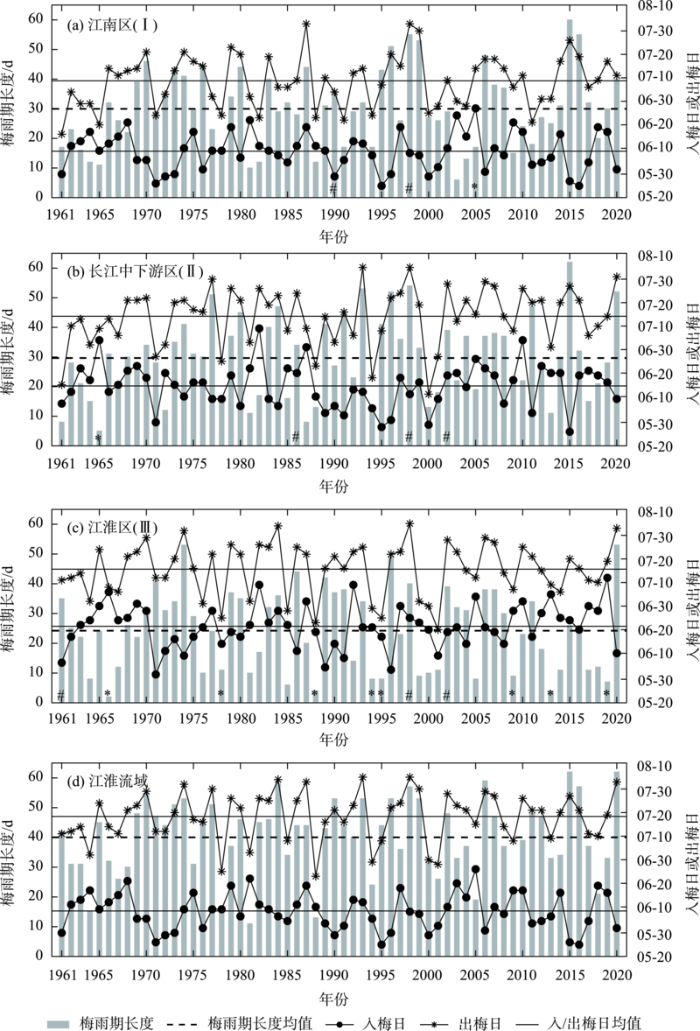
图2
基于梅雨监测指标的江淮流域及其各区1961—2020年入梅日、出梅日和梅雨季/期长度
注:图中*、#分别表示空梅、二度梅。
Fig.2
Meiyu onset and ending dates and length of the Meiyu period over the Yangtze-Huai River Basin and its subregions from 1961 to 2020 based on the latest national standard of Meiyu monitoring indices
江淮流域1961—2020年平均出梅日为7月18日,Ⅰ区、Ⅱ区和Ⅲ区平均出梅日分别为7月9日、7月14日和7月15日。出梅日年际波动较大,在不考虑空梅的情况下,江淮流域最早出梅日比最晚出梅日早42 d,Ⅰ区最早出梅日比最晚出梅日早48 d,Ⅱ区最早出梅日比最晚出梅日早54 d,Ⅲ区最早出梅日比最晚出梅日早45 d。
江淮流域1961—2020年平均梅雨季长度为40 d,Ⅰ区、Ⅱ区和Ⅲ区平均梅雨期长度分别为30 d、30 d和24 d。梅雨季/期长度的年际变化剧烈,在不考虑空梅的情况下,江淮流域梅雨季最短11 d(1981年)比最长62 d(2020年)少51 d,Ⅰ区梅雨期最短6 d(2003年)比最长60 d(2015年)少54 d,Ⅱ区梅雨期最短8 d(1961年、1987年)比最长62 d(2015年)少54 d,Ⅲ区梅雨期最短6 d(1985年)比最长53 d(2020年)少47 d。江淮流域梅雨季长度的变差系数为0.42,Ⅰ区、Ⅱ区和Ⅲ区梅雨期长度的变差系数分别为0.46、0.53和0.66,说明梅雨季/期长度年际波动较大,且3个子区域从南到北波动程度越来越强。
Ⅰ区、Ⅱ区和Ⅲ区分别有2、3和3 a出现二度梅,分别有1、1和8 a为空梅年,Ⅲ区空梅年明显多于其他区域,说明江淮流域梅雨具有南北空间上的异质性。由表2可知,江淮流域及各子区域入梅日、出梅日及梅雨季/期长度均有所变化,但以上变化趋势都未通过95%置信度下的显著性检验,趋势性不明显。
表2 江淮流域及其各区1961—2020年入梅日、出梅日和梅雨季/期长度变化速率
Tab.2
| 指标 | Ⅰ区 | Ⅱ区 | Ⅲ区 | 江淮流域 |
|---|---|---|---|---|
| 入梅日 | -0.11 | -0.19 | 0.82 | -0.20 |
| 出梅日 | 1.09 | 1.43 | 0.11 | 0.64 |
| 梅雨季/期长度 | 1.20 | 1.62 | 0.71 | 0.84 |
注:均未通过95%置信度下的显著性检验。
2.2 江淮流域及其各子区域梅雨雨强和梅雨强度指数时空特征
由图3可知,江淮流域及其子区Ⅰ区、Ⅱ区和Ⅲ区1961—2020年梅雨雨强多年平均值分别为306.5、367.6、298.4和253.5 mm。梅雨雨强的年际波动较大,江淮流域最大梅雨雨强比最小梅雨雨强多593.4 mm,Ⅰ区最大梅雨雨强比最小梅雨雨强多804.1 mm,Ⅱ区最大梅雨雨强比最小梅雨雨强多724.5 mm,Ⅲ区最大梅雨雨强比最小梅雨雨强多765.4 mm。江淮流域及其子区Ⅰ区、Ⅱ区和Ⅲ区梅雨雨强的变差系数分别为0.42、0.46、0.53、0.66,可见梅雨雨强年际变化较为剧烈。
图3
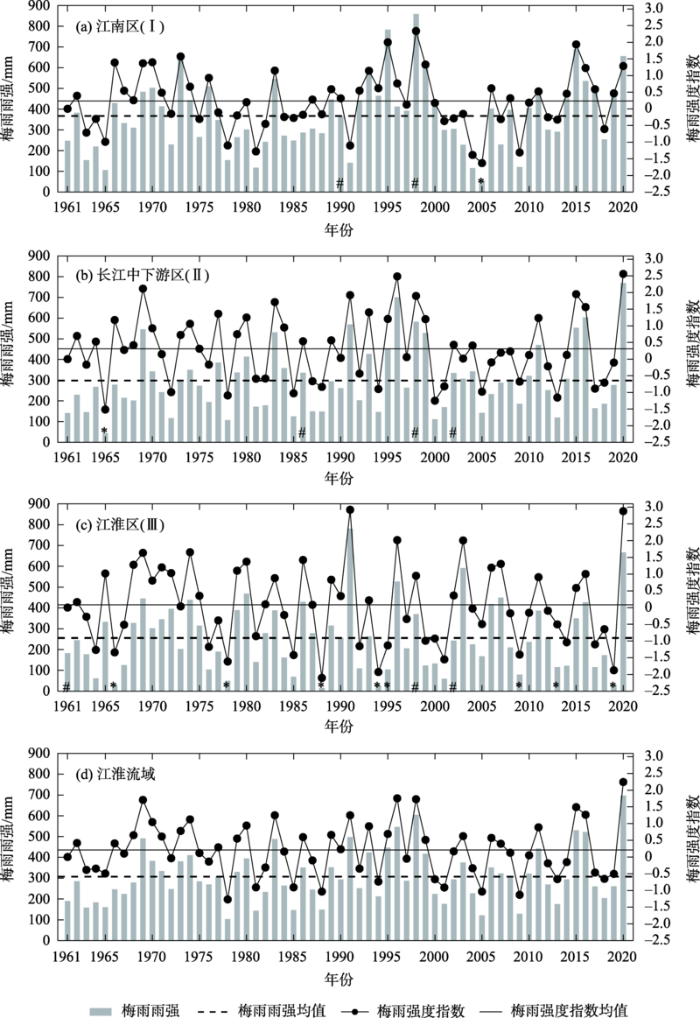
图3
基于梅雨监测指标的江淮流域及各分区1961—2020年梅雨雨强和梅雨强度指数
Fig.3
Meiyu intensity and Meiyu intensity index of the Yangtze-Huai River Basin and its subregions from 1961 to 2020 based on the latest national standard of Meiyu monitoring indices
江淮流域及其子区Ⅰ区、Ⅱ区和Ⅲ区1961—2020年梅雨强度指数多年平均值分别为0.20、0.23、0.31和0.07。梅雨强度指数的年际波动较大,江淮流域最大梅雨强度指数为2.3,最小为-1.3,Ⅰ区最大梅雨强度指数为2.3,最小为-1.6,Ⅱ区最大梅雨强度指数为2.6,最小为-1.5,Ⅲ区最大梅雨强度指数为2.9,最小为-2.1。从不同等级的梅雨强度指数出现频次来看,Ⅱ区梅雨最强,其次是Ⅲ区、Ⅰ区和江淮流域。江淮流域及其子区Ⅰ区、Ⅱ区和Ⅲ区梅雨强度指数的变差系数分别为3.99、3.72、3.23、18.15,梅雨强度指数的年际变化较大,特别是Ⅲ区变化非常剧烈。
由表3可知,只有Ⅱ区梅雨雨强呈显著增加趋势,通过了95%置信度下的显著性检验,变化速率为23.43 mm/10 a。江淮流域及其各子区域梅雨强度指数变化幅度均未通过95%置信度下的显著性检验,趋势性不明显。
表3 江淮流域及各分区1961—2020年梅雨雨强和梅雨强度指数变化速率
Tab.3
| 指标 | Ⅰ区 | Ⅱ区 | Ⅲ区 | 江淮流域 |
|---|---|---|---|---|
| 梅雨雨强(mm/10 a) | 20.69 | 23.43* | 3.77 | 15.97 |
| 梅雨强度指数(1/10 a) | 0.02 | -0.01 | -0.04 | -0.01 |
注:*为通过95%置信度下的显著性检验。
2.3 梅雨量、雨日数、降水发生率及梅雨期日降水强度时空特征
梅雨期各站点的梅雨量多年平均值为211.9~489.1 mm(图4a),占年降水量的16.8%~28.2%(图4b),占夏季降水量的44.4%~61.3%(图4c),梅雨量在Ⅰ区和Ⅱ区的114°~120°E范围内较大,且南部高于北部,占年降水量的比值在Ⅰ区和Ⅱ区的东南沿海和西部边界线一带较低,占夏季降水量的比例则是明显的东高西低。梅雨量的变化速率为-11.4~44.5 mm/10 a(图4d),有121个站点的变化速率超过20.0 mm/10 a,其中55个站点(占23.0%)呈显著增加趋势,主要分布在Ⅰ区和Ⅱ区的东部。有15个站点变化速率为负值,多位于Ⅲ区,均没有通过95%置信度下的显著性检验。
图4

图4
1961—2020年各站点梅雨量、雨日数、降水发生率等指标的时空特征
注:图d、f、h和j中大圆圈表示该站点变化趋势通过了95%置信度下的显著性检验,小圆圈表示没有通过。
Fig.4
Spatiotemporal variation characteristics of Meiyu intensity indicators over the subregions during 1961-2020
梅雨期各站点雨日数多年平均值为12.9~22.1 d(图4e),Ⅰ区雨日数最多,Ⅱ区雨日数大概以武汉和长沙的连线为界呈东高西低,Ⅲ区雨日数明显较少。梅雨期雨日数的变化速率为-1.1~1.1 d/10 a(图4f),各站点变化幅度均未通过显著性检验,没有明显趋势性变化。梅雨期降水发生率为48.9%~74.7%(图4g),梅雨期降水发生率超过50%的站点有237个,Ⅰ区所有站点的降水发生率都大于60%,Ⅱ区降水发生率则大概以武汉和长沙的连线为界呈东高西低,Ⅲ区降水发生率在60%左右。降水发生率变化速率为-3.3%/10 a~1.3%/10 a(图4h),其中37个站点呈显著减少趋势,主要分布在Ⅱ区的东部(江苏省东南部及上海市)。
日降水强度为梅雨量与梅雨期雨日数的比值,可以反映梅雨期的降水强度。由图4i、4j可知,日降水强度为62.6~73.9 mm/d,达到暴雨量级,没有明显的空间分布差异。日降水强度的变化速率为-8.7~27.8 mm/10 a,有40个站点呈显著增加趋势。
2.4 梅雨期不同降水量级雨日数及其降水发生率时空特征
图5
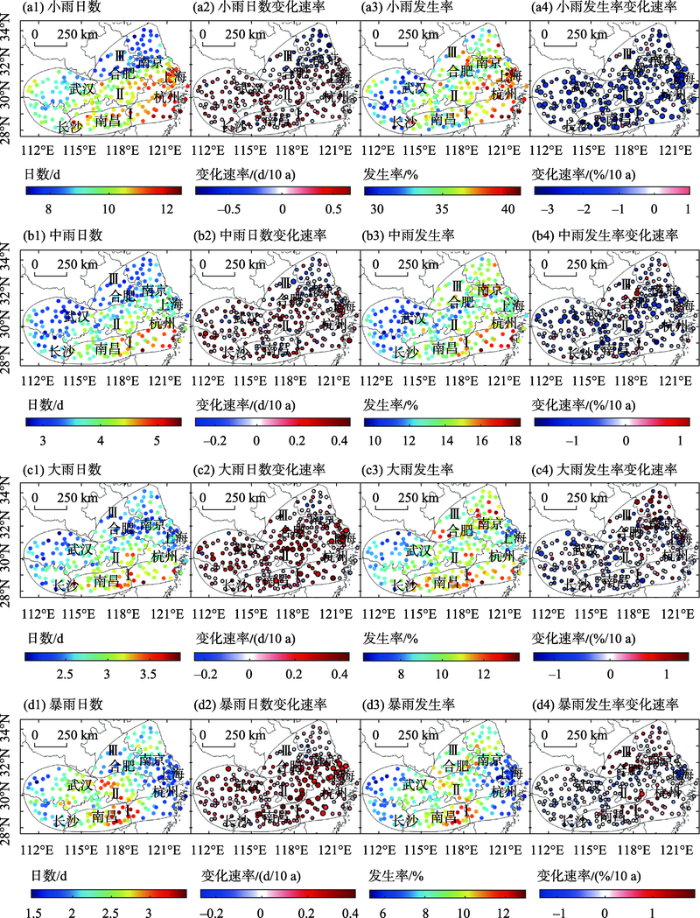
图5
各站点1961—2020年梅雨期内不同降水量级雨日数及其降水发生率时空变化特征
注:图a2、a4、b2、b4、c2、c4、d2和d4中大圆圈表示该站点变化趋势通过了95%置信度下的显著性检验,小圆圈表示没有通过。
Fig.5
Spatiotemporal characteristics of rainy days and their incidence rates for different precipitation levels during the Meiyu period from 1961 to 2020 for each meteorological station in the Yangtze-Huai River Basin and its subregions
2.5 梅雨期不同降水量级降水量及其降水贡献率时空特征
图6

图6
各站点1961—2020年梅雨期内不同降水量级降水量及其降水贡献率的时空变化特征
注:图a2、a4、b2、b4、c2、c4、d2和d4中大圆圈表示该站点变化趋势通过了95%置信度下的显著性检验,小圆圈表示没有通过。
Fig.6
Spatiotemporal characteristics of precipitation amount and precipitation contribution rate for different precipitation levels at each station in the Yangtze-Huai River Basin and its subregions during the Meiyu period during 1961-2020
2.6 城市化对梅雨期强降水的影响
依据1980、1990、2000、2010和2020年的土地利用数据识别出相应年份土地利用资料的城市站点数,分别为33、57、90、142和182个,可知33个站点一直为城市站点,149个经历了从农村站点转变为城市站点的过程,此外,有57个站点一直为农村站点。
图7为33个城市站点、149个农村→城市站点和57个农村站点的R95P和R99P的变化速率时空分布,3类站点的2个强降水指标绝大部分站点变化速率都为正值。如图7a所示,城市站点R95P变化速率为-2.12~57.16 mm/10 a,有21个站点(占城市站点总数的63.6%)呈显著增加趋势;农村→城市站点变化速率为-2.89~62.66 mm/10 a(图7b),有82个站点(占农村→城市站点总数的55.0%)呈显著增加趋势;农村站点变化速率为-4.02~61.67 mm/10 a,有30个站点(占农村站点总数的52.6%)呈显著增加趋势。可见,R95P在城市站点中显著上升的站点比例最高,其次是农村→城市站点和农村站点。城市站点的R95P呈显著增加的站点主要分布在Ⅰ区和Ⅱ区的116°E以东,农村→城市站点和农村站点中呈显著增加的站点主要分布在Ⅰ区和Ⅱ区西部。
图7
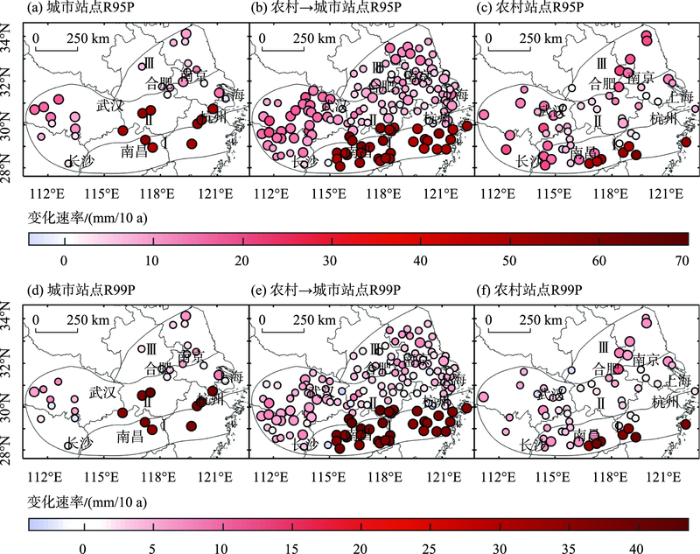
图7
江淮流域城市站点、农村—城市站点和农村站点的1961—2020年梅雨期R95P和R99P时空变化特征
注:图中大圆圈表示该站点变化趋势通过了95%置信度下的显著性检验,小圆圈表示没有通过。
Fig.7
Spatiotemporal characteristics of R95P and R99P at urban stations, rural-urban stations and rural stations during the Meiyu period in 1961 to 2020 over the Yangtze-Huai River Basin and its subregions
图8
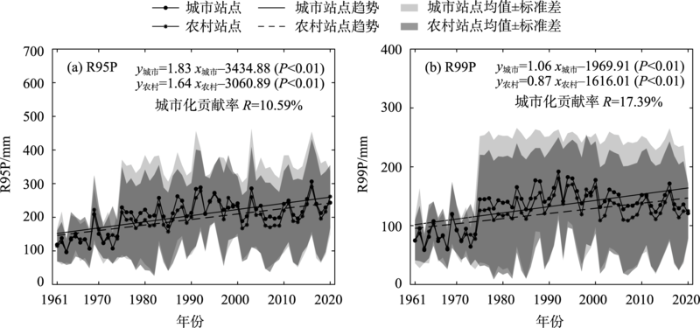
图8
城市站点和农村站点梅雨期R95P和R99P变化趋势及城市化贡献率
Fig.8
Multi-year trends and urbanization contribution for R95P and R99P at urban and rural stations during the Meiyu period over the Yangtze-Huai River Basin
3 讨论
3.1 梅雨过程识别技巧
周平等[8]根据安徽江淮地区6个气象站资料识别梅雨过程时发现,当研究区小于子区域时,以最后一个雨期的次日定义的出梅日与根据环流和雨日条件确定的出梅日并不等效,应根据环流和雨日条件确定出梅日。本文在梅雨识别过程中也有部分年份不能同时满足国标“最后一个雨期结束日的次日即为出梅日,此时西太平洋副热带高压第二次北跳,副高脊线位置超出北界范围”的规定,但满足国标“当副高脊线5 d滑动位置有1候超过北界位置2个纬度,且没有继续出现雨日,监测区域内出现高温干热天气,该区域梅雨期结束”的规定,故在满足上述条件时本文也判定为出梅。
3.2 梅雨期降水影响因素分析
全球气候变暖造成地表温度升高、水汽增加、水汽辐合和大气不稳定性显著增加,这些因素为梅雨期强降水的形成提供了热力和动力条件,提高了长江三角洲地区极端降水的频率和强度[13,34-35]。本文发现城市化增加了梅雨期的强降水量(图7~8),城市化主要通过城市热岛效应和城市下垫面变化影响降水的强度和时间[2,31]。城市热岛效应是指城市气温明显高于外围郊区及乡村的现象,城市热岛扰动大气边界层,破坏大气层结构稳定性,加之在水汽充足且凝结核丰富或者其他有利的天气形势下,易形成对流云和对流性降水,或对暴雨产生诱导、强化作用,导致城市下风处的降水受此影响较大[18,31⇓-33]。城市下垫面变化一方面通过改变地表能量平衡,使局地蒸发减少、感热通量增加和边界层水汽混合更均匀,从而对局地降水产生影响[18,31,35];另一方面由于城市冠层结构的存在,增大空气动力学粗糙度,扰动边界层水汽和能量过程,阻滞降水系统停留时间,降低近地面风速,迫使降水时间延长,导致降水量增加[2,30-31,35]。本文中梅雨量、梅雨期降水发生率和日降水强度的变化趋势在以上海为代表的城市化高速发展地区最为显著,这可能和城市化有关。也有研究表明,当城市化发展到一定阶段后,因为潜热通量变小导致局地大气水分供应减少,最终使城市上空降水减少[31,34,40,46],这可能是2000年后梅雨期R95P和R99P减少的原因(图8)。人为排放的大气污染物在吸收水汽凝结核后形成的气溶胶也是导致降水变化的原因之一。有研究发现,气溶胶通过影响深层对流云导致暴雨随着气溶胶负荷的增加而增加,气溶胶浓度的增加在一定程度上可以解释中国东部小雨频率和数量下降的现象[2,30-31,47]。
4 结论
本文探讨了江淮流域及其子区域1961—2020年入梅日、出梅日、梅雨季/期长度、梅雨雨强和梅雨强度指数等梅雨监测指标的时空变化特征,分析梅雨期不同降水量级的雨日数、降水发生率、降水量和降水贡献率的时空变化特征,并定量分析了城市化对梅雨期强降水的影响。得到以下主要结论:
(1) 江淮流域及其子区Ⅰ区、Ⅱ区和Ⅲ区多年平均入梅日分别为6月8日、6月9日、6月15日和6月21日,多年平均出梅日分别为7月18日、7月9日、7月14日和7月15日,梅雨季/期长度多年平均值分别为40、30、30和24 d,入梅日、出梅日和梅雨季/期长度年际变化较大,但趋势性均不显著。
(2) 江淮流域及其子区Ⅰ区、Ⅱ区和Ⅲ区梅雨雨强多年平均值分别为306.5、367.6、298.4和253.5 mm,梅雨强度指数多年平均值分别为0.20、0.23、0.31和0.07,梅雨雨强和梅雨强度指数的年际变化较大,只有Ⅱ区的梅雨雨强呈显著增加趋势,梅雨强度指数趋势性不明显。
(3) 各站点梅雨量多年平均值为211.9~489.1 mm,占年降水量的16.8%~28.2%,占夏季降水量的44.4%~61.3%,梅雨量在Ⅰ区和Ⅱ区的114°E~120°E范围内较大,且南部高于北部;梅雨量变化速率为-11.4~44.5 mm/10 a,Ⅰ区和Ⅱ区的东部的55个站点呈显著增加趋势;梅雨期雨日数为12.9~22.1 d,Ⅰ区雨日数最多,Ⅱ区次之,Ⅲ区雨日数最少,雨日数没有明显趋势变化。梅雨期降水发生率为48.9%~74.7%,Ⅱ区东部(江苏省东南部及上海市)的37个站点降水发生率呈显著减少趋势。
(4) 梅雨期雨日以小雨为主,其次是中雨、大雨和暴雨,绝大多数站点小雨日数、中雨日数趋势性不明显,Ⅱ区东部(上海)和中部有24个站点大雨日数、29个站点暴雨日数呈显著增加趋势。小雨、中雨、大雨和暴雨的降水发生率依次减小,Ⅰ区和Ⅱ区较多站点小雨发生率呈显著减少趋势,江苏东南部与上海市最为集中。21个站点中雨发生率呈显著下降趋势,主要分布在Ⅱ区。绝大部分站点的大雨、暴雨发生率趋势性不明显。
(5) 暴雨降水量占梅雨期降水量比重最大,其次是大雨、中雨和小雨,大雨量有28个站点呈显著增加趋势,大多分布在Ⅱ区的中东部。暴雨量有24个站点呈显著增加趋势,分布在Ⅰ区和Ⅱ区东部。暴雨的降水贡献率最大,其次是大雨、中雨和小雨,小雨贡献率有17个站点呈显著降低趋势,大多分布在Ⅱ区的中东部。中雨贡献率有17个站点呈显著降低趋势,大多分布在Ⅰ、Ⅱ区的中东部。绝大部分站点的大雨、暴雨贡献率趋势性不明显。
(6) 梅雨期3类站点R95P和R99P以增加趋势为主,城市站点、农村→城市站点和农村站点R95P变化速率的均值分别为20.42、18.76和15.24 mm/10 a,R99P变化速率的均值分别为12.63、11.14和7.66 mm/10 a。城市站点R95P和R99P的变化速率大于农村站点,R95P和R99P的城市化贡献率分别为10.59%和17.39%。
参考文献
Multi-scale variability of Meiyu and its prediction: A new review
[J].
基于日记的历史气候变化研究综述
[J].
DOI:10.11820/dlkxjz.2013.10.012
[本文引用: 1]

重建历史时期的气候变化可为分析当前气候变化规律和模拟未来气候变化趋势提供历史参考情景。古代私人日记中保存的气候信息,因其直观性强、分辨率高等特点而受到研究者的重视,成为重建历史气候时使用较多的一类代用数据。近年来,国内外学者利用日记资料,已经重建了多个地区历史上的温度、降水及物候变化,并已逐步由定性描述发展到定量研究。本文从代用指标、研究方法、研究成果3 个方面,对基于日记的历史气候重建研究成果进行综述,得到以下结论:① 重建指标选取上,国内外均较常使用天气情况日数和感应记录两类指标;此外,国内常用自然生长植物的物候期,而国外还使用风向、云量等指标;重建指标类型可分为定量、半定量、定性3 类,定量与定性指标使用较多,半定量指标使用相对较少。② 重建方法上,中外研究者多采用定性分析法和定量转换法等;资料校对方法上,西方学者多采用器测资料进行检验,国内则常选用方志与官私文件进行校订。③ 国外研究的重建内容主要涉及区域温度和降水;而国内除了温度和降水重建外,还研究了沙尘和梅雨等中国特有的天气气候现象。利用日记重建历史气候的优势在于,日记中保存的历史气候信息细节丰富、时间分辨率高,因而能够很好地保证重建结果的准确性。未来这一领域的研究还应继续改进代用指标的定量转换和重建结果的校验方法,并加强对不同区域、不同时段的同类研究结果的集成研究。
Review of climate reconstruction based on ancient diary
DOI:10.11820/dlkxjz.2013.10.012
[本文引用: 1]
Climate change is an important issue in science research, which deeply influences the human society. The historical climate reconstruction is one topic, which can provide reference scenario for analyzing current climate variation and simulating the future climate change. There were many climate proxies from natural recorders of climate variability such as tree rings, ice cores, fossil pollen, ocean sediments, corals and historical data. The dairies are important historical data for historical climate reconstructions, and there have been lots of studies both at home and abroad. The dairies included the private dairy, the private note, and letter with detailed date. There were weather records, phenological informations, and climatic events in the dairies. Although the dairies have some shortcomings such as time gaps and omissions, place limitations and the author's wrong understanding, they are advanced in daily weather records for extracting the details of climate change and weather process during a period and at the local level. In additional, the dairy-based studies can contribute to verifying the high resolution sequence of paleoclimate based on other climate proxies. In this paper, the current dairy-based studies were reviewed from three aspects including reconstructions proxy, research method and research subject. The dairy-based studies usually used the days of rain and snow, the plant phenological period, the life experience records, and etc. These proxies can be divided into three types including quantitative proxy, semi-quantitative proxy, and qualitative proxy. The quantitative proxy can be counted and compared to the modern meteorological data. The semi-quantitative proxy was the record which reflected the range or the rank of the weather condition or climate phenomenon. The qualitative proxy mainly was the feeling of the people which was hard to be quantified. With the process of the research development, the method of dairy-based studies turns from the simple qualitative analysis method to quantify analysis method, like regression equation method. The conclusions were as follows: (1) The frequently-used proxies were the number of days and experience records both in home and aboard studies; and the domestic researches also used natural plant phenological period; and the foreign researches used wind direction and cloud cover as well. The reconstruction proxies were classifies to quantitative proxy, semi-quantitative proxy, and qualitative proxy. Both the domestic and foreign scholars used the quantitative proxy and qualitative proxy more frequently than semi-quantitative proxy. (2) The foreign and domestic academics usually applied the qualitative analysis method and quantitative transformation method. In the data verification, the foreign researches often chose instrumental data, and the domestic researches often used the official files and chorography. (3) The subjects of foreign researches mainly were the local temperature and precipitation, while the domestic studies not only focused on those but also studied dusty weather and precipitation characteristics during sand storm and plum rain period.The advantages of using diaries to reconstruct historical climate include the abundant details in climatic record, high time resolution and high veracity of the reconstruction result. In the future, the ancient diary research should enhance the quantitative transformation method and the verification with other proxies. As the diary-based reconstructions increasing and the method improving, there would be long climate series on large area, which will contribute to the historical climate research.
2020年超强梅雨特征及其成因分析
[J].
Characteristics and possible causes for the extreme Meiyu in 2020
Historic Yangtze flooding of 2020 tied to extreme Indian Ocean conditions
[J].
长江梅雨的长期变率与海洋的关系及其可预报性研究
[J].
Relationship between long-term variability of Meiyu over the Yangtze River and ocean and Meiyu's predictability study
基于梅雨监测指标的安徽江淮地区梅雨过程识别
[J].
Meiyu identification of Yangtze-Huaihe region in Anhui Province based on Meiyu monitoring indices
东亚梅雨系统的天气—气候学研究
[J].
A study of the synoptic-climatology of the Meiyu system in East Asia
东亚梅雨季节内振荡的气候特征
[J].
Climatologic characteristics of the intraseasonal oscillation of East Asian Meiyu
Linkage between moisture transport over the Yangtze River Basin and a critical area of the Tibetan Plateau during the Meiyu
[J].DOI:10.1007/s00382-019-04648-w URL [本文引用: 1]
Decadal change in the correlation pattern between the Tibetan Plateau winter snow and the East Asian summer precipitation during 1979-2011
[J].DOI:10.1175/JCLI-D-12-00587.1 URL [本文引用: 1]
The variability of the Asian summer monsoon
[J].DOI:10.2151/jmsj.85B.21 URL [本文引用: 3]
论东亚夏季风的特征、驱动力与年代际变化
[J].
On the characteristics, driving forces and inter-decadal variability of the East Asian summer monsoon
Oceanic forcings of the interdecadal variability in East Asian summer rainfall
[J].DOI:10.1175/JCLI-D-15-0792.1 URL [本文引用: 1]
Inter-decadal variation of the summer precipitation in East China and its association with decreasing Asian summer monsoon. Part I: Observed evidences
[J].DOI:10.1002/joc.1615 URL [本文引用: 1]
东亚夏季风推进过程的气候特征及其年代际变化
[J].
Northerly advancement characteristics of the East Asian summer monsoon with Its interdecadal variations
DOI:10.11821/xb200607001
[本文引用: 1]
In the context of 1951-2001 NCEP daily re-analyses and the 1957-2000 daily precipitation from 366 stations over eastern China, a quantitative index is proposed to study the interdecadal variation of the northerly advancement of East Asian Summer Monsoon (EASM). The results show that drawing the isoline of standardized rainfall index of 1.5 that is better indicative of the meridional shifting of the summer rainband in eastern China, and its phased and abrupt change in its northward march. The northerly march of EASM displays conspicuous interdecadal variations. The position indices of the EASM jump in the mid-1960s, however the jump of the intensity indices occurs in the end of the 1970s. Before the mid-1960s, the onset of the South China Sea monsoon is later, but the northward advance is quicker, the time of arrival in North China is earlier, which maintains a longer time in North China, its north edge lies north to the normal position, and thus the North China rainy season and Huaihe River Valley (HRV) Mei-yu are distinct. In recent 20 years, the onset is earlier, the intensity is obviously weaker, and therefore precipitation mainly concentrates in the Yangtze River Valley (YRV) and areas south of the Yangtze River, and the North China rainy season is not evident.
城市暴雨积涝灾害风险突增效应研究进展
[J].
DOI:10.18306/dlkxjz.2016.09.003
[本文引用: 3]
城市暴雨积涝风险突增效应研究对揭示此类风险与人类活动所导致的城市化过程的关系,及用于城市地区灾害风险识别及风险预警均有重要价值。本文从城市因素(地表粗糙度、气溶胶及城市热岛等)影响城市地区降水过程,以及城市地区土地利用和土地覆盖变化(LUCC)影响城市地表水文反应过程2个方面综合论述风险突增效应研究的进展及主要结论。在研究方法上,总结了现有文献所用的暴雨危险性的主要评估模型,认为暴雨危险性计算需要结合雨强及暴雨持续时间。城市地表对暴雨积涝的敏感性分析需借助城市水文模型;在模型分析过程中,应注重雨量数据的有效性,以及城市排水管网、土地利用和土地覆盖等资料的可获取性及概化。为定量评估城市暴雨积涝风险突增效应,需要使用更高时空分辨率的数据资料分析暴雨危险性特征,通过细化及发展城市水文模型,完成敏感性实验分析;在此基础上,综合危险性及敏感性特征,评估城市地区暴雨积涝风险,揭示暴雨积涝风险在城市地区的空间分布差异及风险突增效应。相关成果可用于城市暴雨积涝的风险识别、评估、预警及风险管理。
Research progress of surging urban flood risks
DOI:10.18306/dlkxjz.2016.09.003
[本文引用: 3]
Due to the frequent occurrence of floods in urban areas, it is imperative to investigate their causes and determine whether they are mainly the result of global climate change or urbanization induced by human activities. Existing research on the impact of urbanization on urban floods focuses on hazards assessment as well as sensitivity tests. They are critical to risk reduction and severe weather early warning. Precipitation intensity downwind or over cities may be enhanced. Meanwhile the increased areal coverage of impervious surfaces in urban areas can alter the natural hydrologic response. In order to reveal the spatiotemporal characteristics of elevated flood risks in urban areas, by examining published work on the topics, we put forward the following thoughts on future research direction. The first is to use high spatial resolution observation data to determine the distribution of hazards induced by rainstorms in urban areas. The second is to develop suitable hydrological models using high resolution urban land surface data for simulating the hydroclimatic sensitivity of watersheds. The third is to combine rainstorm hazards and sensitivity in risk assessment to reveal the discrepancy of flood risks in urban areas, as well as effects induced by urbanization. Risk assessment identifies flood risks in urban areas and can be useful for risk management, which is essential in risk mitigation.
121年梅雨演变中的近期强年代际变化
[J].
Recent strong decadal change of Meiyu in 121 years
基于新监测指标的江南入梅早晚的气候特征及影响系统分析
[J].
Climate characteristics and influential systems of Meiyu to the south of the Yangtze River based on the new monitoring rules
江淮地区梅雨的新定义及其气候特征
[J].
A study of updated definition and climatological characters of Meiyu season in the Yangtze-Huaihe region
非典型梅雨与典型梅雨对比分析
[J].
Comparison analysis of non-typical and typical Meiyu
新标准下江淮梅雨特征的分析
[J].
The features of Meiyu under the new standard
太湖流域梅雨的划分及其典型年异常成因分析
[J].
Meiyu determination and causes of typical abnormal Meiyu years in Taihu Basin
DOI:10.18307/2021.0118 URL [本文引用: 4]
2019年江淮流域梅雨异常特征及成因分析
[J].
Analysis of abnormal characteristics and causes of Meiyu over the Yangtze-Huaihe River Basin in 2019
Identification and characteristics analysis of Meiyu in Anhui Province based on the national standard of Meiyu monitoring indices
[J].DOI:10.2166/nh.2021.042 URL [本文引用: 2]
2020年安徽梅雨异常特征及预测前兆信号分析
[J].
Analysis on the characteristics of Meiyu anomaly and prediction precursor signal in Anhui Province in 2020
2020年湖北梅雨异常特征及成因分析
[J].
Characteristics and cause analysis of Meiyu anomaly over Hubei Province in 2020
Urbanization impact on regional climate and extreme weather: Current understanding, uncertainties, and future research directions
[J].DOI:10.1007/s00376-021-1371-9 URL [本文引用: 3]
城市化对降水影响的研究综述
[J].
A review of urbanization impact on precipitation
Understanding human influence on climate change in China
[J].
Asymmetrical shift toward less light and more heavy precipitation in an urban agglomeration of east China: Intensification by urbanization
[J].
Changes in precipitation extremes in the Yangtze River basin during 1960-2019 and the association with global warming, ENSO, and local effects
[J].
The long-term variation of extreme heavy precipitation and its link to urbanization effects in Shanghai during 1916-2014
[J].DOI:10.1007/s00376-016-6120-0 URL [本文引用: 4]
中国极端降水事件时空特征及其对夏季温度响应
[J].
DOI:10.11821/dlxb201605002
[本文引用: 1]
基于中国1951-2014年728个气象站点日降水数据,利用POT抽样、变异点分析、趋势分析、分段回归等方法全面分析中国极端降水事件(量级、频率与发生时间)非平稳性特征及其对夏季温度响应。研究结果发现中国极端降水量级有明显变异特征,但无显著趋势变化,中国极端降水频率则相反。并且中国极端降水次数在全国大部分区域有显著增加趋势。另外,研究还表明变异点对中国极端降水量级和频率趋势特征有明显的改变,对极端降水发生时间趋势特征改变较弱;中国极端降水发生时间在中南部呈显著上升趋势,其他区域趋势性不显著。中国大部分区域夏季温度呈上升或显著上升趋势,且变异特征显著。在转折点前,中国大部分区域如西部干旱区东南部、东部干旱区西南部、华北区、华中区和西南区北部夏季温度呈下降或显著下降趋势;在转折点后,上述区域夏季温度转为上升或显著上升趋势。
Spatiotemporal patterns of extreme precipitation with their responses to summer temperature
DOI:10.11821/dlxb201605002
[本文引用: 1]
Daily precipitation and temperature data at 728 stations covering a period of 1951 to 2014 across China were analyzed to investigate extreme precipitation regimes in terms of spatiotemporal patterns, precipitation magnitude, precipitation frequency, occurrence timing, non-stationarity of extreme precipitation regimes and also their responses to summer temperature changes. The methods adopted in this study are Peak over Threshold (POT) sampling technique, change point analysis, trend analysis and piecewise regression method. Results of this study indicated that magnitude of extreme precipitation events was subject to evident alterations but free of significant trends. However, occurrence rates of extreme precipitation were subject to adverse changing properties when compared to changes in magnitude of extreme precipitation. The entire China was dominated by apparent increase of occurrence rates of extreme precipitation. Besides, change points within magnitude and occurrence rates of extreme precipitation tended to modify the changing tendency therein. However, occurrence timing of extreme precipitation events seemed to be free of impacts from change points. In most regions of China, occurrence time of extreme precipitation events was delayed and no changes in occurrence time of extreme precipitation could be observed in other regions of China.
气候变化下极端水文事件的研究进展
[J].
DOI:10.11820/dlkxjz.2011.11.006
[本文引用: 1]
气候异常变化导致洪涝灾害、干旱等极端水文事件的发生及其增加的水灾害风险正成为人类生存所面临的重大挑战。近年来,开展气候变化背景下流域极端水文事件的变化趋势、发生机理及其对气候变化的响应与预测研究正逐渐受到国内外众多学者的关注。本文从极端水文事件的定义、研究方法、水文极值分布函数、观测事实及模拟研究等方面分析评述了极端水文事件问题的研究现状和研究成果。在此基础上,讨论了研究现状存在的问题并对该领域未来研究方向进行了展望。
Progress in the study of extreme hydrologic events under climate change
DOI:10.11820/dlkxjz.2011.11.006
[本文引用: 1]
Extreme hydrologic events such as floods and droughts caused by abnormal climate change and increased risks of water disasters are becoming the major challenges to the survival of the people survival. In recent years, the research on the change trend, mechanisms, response and prediction of the climate change of the extreme hydrologic events in basins under climate change is drawing more and more attention from the scholars at home and abroad. This paper begins with the definitions of extreme hydrologic events, and then analyzes and reviews the research methods, and hydrologic extreme value distribution, as well as the observation and simulation of extreme hydrologic events. On this basis, this paper makes a discussion on the problems in the present research. The directions of further research are also provided.
中国日极端降水和趋势
[J].
Daily extreme precipitation and trends over China
The NCEP/NCAR 40-year reanalysis project
[J].DOI:10.1175/1520-0477(1996)077<0437:TNYRP>2.0.CO;2 URL [本文引用: 1]
城镇化对极端降水的影响及其贡献率研究: 以太湖平原地区为例
[J].
The impacts and its contribution rate of urbanization on extreme precipitation,1976-2015: A case study in the Lake Taihu Plain region
DOI:10.18307/2022.0121 URL [本文引用: 3]
Quantitatively evaluating the effect of urbanization on heat waves in China
[J].
ERA5再分析降水数据在长江三角洲的性能评估
[J].
Performance evaluation of ERA5 reanalysis precipitation data in the Yangtze River Delta
长江上游流域降水结构时空演变特性
[J].
Spatial-temporal variability characteristics of precipitation structure across the upper Yangtze River Basin, China
城市化对北京市极端气候的影响研究
[J].
DOI:10.11821/dlyj020181343
[本文引用: 1]
利用北京地区20个气象站点35年(1980—2014年)的逐日降水、气温资料和社会经济、人口、土地覆被以及夜间灯光遥感的栅格数据,通过聚类分析和层次分析相结合的方法将站点分类,对北京市城市化进程中的极端气候变化趋势和城市化影响的响应进行了分析。结果表明:北京市整体的极端冷事件呈减少趋势,极端暖事件呈增加趋势,极端降水事件没有明显变化趋势;城市化对极端温度事件有着显著的影响,相对于乡村站点来说,城市化使得极端冷事件减少的更快,极端暖事件增加的更快,造成城市的气温日较差明显变小;城市化对极端降水的影响虽不显著,但在乡村站点年降水量总量和降水日数减小的趋势下,城市化造成城市降水总量和降水日数均多于乡村,减缓了连续无降水日数的增长趋势,同时城市的极端降水有向更加极端的情景发展。
The effect of urbanization on extreme climate events in Beijing
DOI:10.11821/dlyj020181343
[本文引用: 1]
It had been proved that the process of urbanization had an effect on extreme weather events under the global warming. This study analyzed the urbanization effects on extreme climate events for the period 1980-2014 by classifying 20 meteorological stations into urban, suburban, and rural categories, based on the daily precipitation, temperature data and raster data of socio-economic, population, land cover and the night-time light images combined with cluster analysis and analytic hierarchy methods. The results show that the number of extreme cold events in Beijing showed decreasing trends, while that of the extreme warm events exhibited increasing trends, and the extreme precipitation events showed no obvious change trend. Compared with rural sites, urbanization has a significant impact on extreme temperature events. In urban areas, the number of extreme cold events was reduced faster; that of extreme warm events increased faster; and the daily-temperature-range significantly became smaller than that in urban areas. Compared with the decreasing trends of annual precipitation and annual rainfall days at rural sites, urbanization increased total precipitation amount. Besides, the urbanization in Beijing slowed down the growth trend of consecutive dry days, and at the same time, it intensified the extreme heavy precipitation events. However, the impact of urbanization on extreme precipitation events is not significant.
中国东部不同区域城市群下垫面变化气候效应的模拟研究
[J].
Numerical simulation of urbanization climate effects in regions of east China
Declining frequency of summertime local-scale precipitation over eastern China from 1970 to 2010 and its potential link to aerosols
[J].DOI:10.1002/2017GL073533 URL [本文引用: 1]
