

洪水特征指标模拟通常采用水文模型方法[8-9]。该方法基于物理机制,考虑多种影响因子,进行径流过程的预测,其优点在于通过模拟完整的径流时间序列得到相关径流特征[10]。水文模型需要输入序列降雨、数字高程、土地利用等大量基础数据,对于无资料流域径流特征的高精度模拟还存在不足。近年来,随着机器学习方法的兴起和完善,其具有对输入数据类型要求较少、能依靠输入数据的变化而强化认知、对复杂非线性关系进行有效捕捉等诸多优势[11-12],已被广泛应用于降雨—径流关系构建[13]、水质模拟评价[14]、灾害风险评估[15]等方面,并逐步拓展到洪水过程及其特征模拟预测。如McIntyre等[16]、Al-Rawas等[17]、林木生等[18]基于多元线性回归建立了洪水峰值、径流持续时间等指标与降水、流域特征属性之间的关系;Boukharouba等[19]基于支持向量机对山洪过程及水位进行模拟;Li等[20]通过对比极限学习机、反向传播神经网络、随机森林等5种机器学习模型对短期径流量的预测能力,发现随机森林在峰值流量预测上略优于其他4种模型;牟凤云等[21]采用随机森林构建降雨与流量、水位之间的关系,证明机器学习模型在一定程度上可以用于定量揭示暴雨洪水特征的经验半经验关系。
多元线性回归和神经网络是径流特征指标模拟中最常用的机器学习模型。多元线性回归易于建模,能够对自变量与因变量之间的关系进行解释说明,是较早使用的机器学习算法之一。多层感知器作为基础神经网络模型,在处理复杂非线性和高非平稳性特征问题时,非线性全局作用和容错性优势显著[22]。随着径流模拟研究的深入,神经网络存在的不可解释性、大样本需求特性、易过度参数化使得模型过拟合等不足使得学者们逐步寻求在径流特征模拟中具有可替代性的其他机器学习模型,如随机森林、支持向量机[23]。其中,随机森林基于集成思想随机选取多个部分数据来构建决策树,遵循一定的逻辑性,在径流极值模拟中表现突出,理论上具有不易过拟合和强抗噪能力的优势[20];支持向量机具有明确的基于结构风险最小化原则进行计算的数学原理,算法具有全局最优性,泛化能力较强,在小流域洪水这种小样本数据模拟中可能具有较好的表现[24]。
综上所述,目前模型模拟应用主要集中在洪水过程的某一特征(如洪水总量、洪峰流量),对其他特征指标(如历时、变率)模拟效果评估研究偏少[21]。因此,本文筛选量级、时间、形态及动力学等不同洪水特征指标,采用多元线性回归、多层感知器、随机森林和支持向量机等4种常用机器学习模型对不同类型洪水的特征指标进行模拟,评估以上4种机器学习模型在不同洪水特征模拟中的适用性。研究可为洪水过程深度挖掘和预报等提供技术支持和方法借鉴。
1 研究区概况
2 数据及方法
2.1 数据及特征指标
2.1.1 数据来源
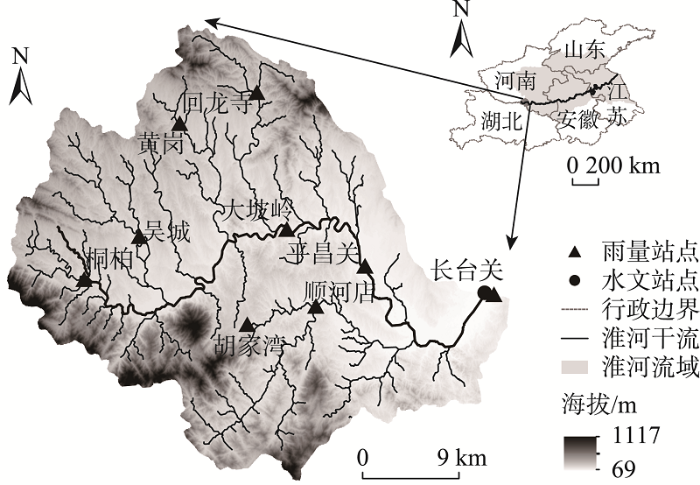
降雨和洪水场次数据主要来源于河南省水文年鉴。收集1971—2018年长台关水文站小时尺度共59场单峰型洪水场次,以及与洪水开始结束时刻相对应的桐柏、黄岗、吴城、长台关等9个雨量站点(图1)的降雨场次数据。基于各站点降雨观测值,采用泰森多边形插值获得流域的面降雨过程,并按照7∶3的比例将59场降雨—洪水事件划分成率定集和验证集,分别为41场和18场。
图1
2.1.2 洪水特征指标
表1 洪水过程特征指标
Tab.1
| 类别 | 指标 | 简写 | 单位 | 计算公式 | 备注 |
|---|---|---|---|---|---|
| 量级 | 洪水总量 | Flow | mm | 反映洪水总量级。 | |
| 洪峰流量 | Qpk | 反映洪峰量级。除以总流量以消除量纲的影响 | |||
| 时间 | 洪水历时 | Dur | d | 反映总时间特征。指标含义同上 | |
| 洪峰时间偏度 | FT | 反映洪峰出现时间。 | |||
| 形态 | 高流量历时占比 | HT | 反映洪峰形态。 | ||
| 动力学 | 涨洪速率 | Inr | m3∙s-1∙h-1 | 反映洪水过程的变化率。 | |
| 落洪速率 | Der | m3∙s-1∙h-1 | 反映洪水过程的变化率。 |
2.1.3 降水指标
表2 影响洪水过程的关键降水指标
Tab.2
| 类别 | 指标 | 计算方式 | 说明 |
|---|---|---|---|
| 量级 | 平均雨量 | 反映流域降雨强度。T为降水总历时, | |
| 最大雨强 | 反映流域降雨强度。 | ||
| 面降雨量 | 反映流域降雨量级情况。指标含义同上 | ||
| 峰前雨量 | 反映降水中前期状况。 | ||
| 时间 | 雨峰系数 | 反映流域降水峰值出现时间。T为降水总历时 | |
| 时间变差系数 | 反映流域降水在时间上的均匀度。 | ||
| 降水集中度 | 反映流域降水在时间上的集中度。 | ||
| 空间 | 雨量极大值比 | 反映流域降雨空间均匀度。 | |
| 暴雨相对中心 | 反映流域降雨中心到流域出口的距离。 | ||
| 起始流量 | 反映流域降雨前期含水情况 |
2.2 洪水分类方法
洪水事件存在明显的随机性和特征差异性,基于洪水过程特征值对历史洪水进行聚类,挖掘洪水相似性规律并有效模拟特征值,对加强洪水管理和控制具有重要意义。洪水类型识别采用主成分分析法和K-means聚类相结合的方法。主成分分析法是为了消除洪水特征指标之间的信息重叠等问题而将各场次洪水7个特征指标降维为少数几个独立的主成分因子。本文基于SPSS 21.0进行主成分分析并按照累积方差90%的阈值标准来提取主成分因子个数。
在此基础上,采用K-means聚类方法将所有场次洪水划分为差异明显的洪水类型。该方法属于无监督学习方法,能够将数据集划分为具有类似特征对象所组成的数据集合。计算原理是:先选取初始聚类中心,并对所有数据进行分类,然后计算每个聚类的平均值来反复调整聚类中心,最终使同类簇的对象相似性最大,异类簇的对象相似性最小。本文聚类分析在MATLAB R2016a上实现,以欧氏距离作为相似性测度,采用误差平方和作为聚类准则,并基于最小AIC准则[26]进行最佳聚类数的确定。
2.3 机器学习模型
4种机器学习模型的输入数据为筛选的10个降水因子,输出为洪水的7个特征指标。模型参数率定采用网格搜索算法、粒子群算法与人为调参相结合,通过5次交叉验证[27],确定模型的最优参数组合。
2.3.1 多元线性回归
多元回归模型[14]是研究一个变量与多个解释变量的回归,公式结构为:
式中:
2.3.2 多层感知器
多层感知器[21]是一种前向结构的人工神经网络,为其他神经网络结构的基础,克服了单层感知器中的非线性问题,在数据回归中可以充分逼近复杂的非线性关系。多层感知器由输入层、输出层、一个或多个隐藏层组成。除了输入层,其余层的每个节点都带有非线性激活函数的神经元,每个神经元计算n个输入信号的加权平均后,应用非线性激活产生输出信号。
2.3.3 随机森林
随机森林[20]是基于逻辑的机器学习方法,由一组没有关联的回归树
2.3.4 支持向量机
支持向量机[19]是一种基于统计学习理论的机器学习算法,在小数据集上表现较好,泛化能力较强。其算法核心是用核函数将具有t个数据的样本集
计算得到最终回归方程:
式中:
2.4 模拟效果评价指标
采用相对误差(RE)、相关系数(R)、均方根对数误差(RMSLE)对模型模拟性能进行评价。相对误差能够反映数据模拟的误差范围,取绝对值以避免平均误差正负抵消;相关系数能够反映两组数据之间的相关程度,可综合评估一组数据的模拟精度;均方根对数误差能够综合反映实测与预测值之间的偏差,是在均方根的基础上对实测值和预测值取对数再求误差,适用于洪水特征预测值范围大且非均匀分布的场景,可避免模拟准确率受一些大数值影响。其计算公式为:
式中:
3 结果与分析
3.1 洪水类型识别
采用主成分分析法将59场洪水的特征指标数据进行降维处理,提取累积解释方差达96.5%的前3个主成分因子进行后续分析。其中,第1主成分与Qpk、Inr、Der等指标具有明显相关性,解释了59.2%的指标信息;Dur、HT、FT与第2主成分具有较强相关性,解释了15.7%的指标信息;Flow与第3主成分具有较强相关性,解释了21.6%的原始指标信息。
基于3个主成分因子,采用K-means聚类将原始洪水分为3类(图2),其中第1类16场(27.1%)、第2类34场(57.6%)、第3类9场(15.3%)。第1类洪水的Flow、Inr、Der和FT等指标均为中间值(图3),而Dur值较高,HT较小,表明该类洪水强度中等、高流量历时占比时间较短,但历时长且洪峰出现时间偏前。第2类洪水在Flow、Qpk、Inr和Der等值上较小,但HT、FT较高,表明这一型洪水强度低、高流量历时占比时间较长、涨退缓慢,且洪峰出现时间靠后。第3类洪水的Flow、Qpk、Inr和Der等指标值较高,但HT、FT值较低,说明该类洪水强度大、涨退水过程迅速、洪峰出现时间靠前,且高流量历时占比时间短,尖瘦形态明显。
图2
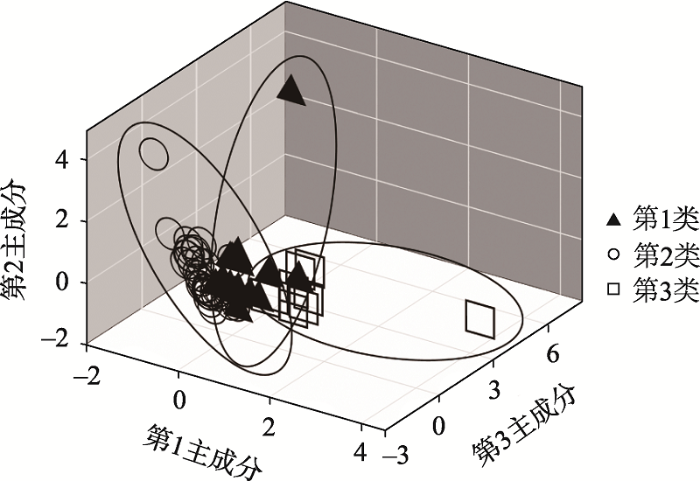
图2
基于K-means的主成分聚类
Fig.2
Principal component clustering diagram based on K-means
图3
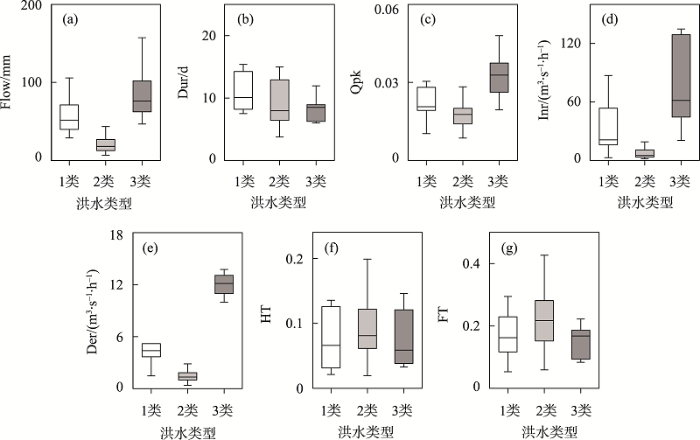
图3
3类洪水过程特征指标的差异
Fig.3
Differences of flood process characteristic indicators of three flood types
3.2 模型模拟对比
率定集上,随机森林在相对误差、相关系数评价指标上均为最优值,其次为支持向量机和多层感知器,多元线性回归最差(表3)。验证集上,多层感知器在3种评价指标上均达到最优,其次为支持向量机和随机森林,最差为多元线性回归。综合率定集和验证集总误差结果,支持向量机为最佳模型(相对误差、相关系数和均方根对数误差分别为45%、0.87和0.10),其次为随机森林(3种评价指标值分别为48%、0.93和0.11)和多层感知器(3种评价指标值分别为49%、0.88和0.12),最差为多元线性回归(3种评价指标值分别为60%、0.82和0.16)。
表3 4种机器学习模型对洪水过程特征指标综合模拟效果评估
Tab.3
| 模型 | 相对误差/% | 相关系数 | 均方根对数误差 | ||||||||
|---|---|---|---|---|---|---|---|---|---|---|---|
| 率定集 | 验证集 | 综合 | 率定集 | 验证集 | 综合 | 率定集 | 验证集 | 综合 | |||
| 多元线性回归 | 41 | 102 | 60 | 0.90 | 0.68 | 0.82 | 0.14 | 0.18 | 0.16 | ||
| 多层感知器 | 37 | 75 | 49 | 0.91 | 0.77 | 0.88 | 0.11 | 0.14 | 0.12 | ||
| 随机森林 | 21 | 109 | 48 | 0.98 | 0.75 | 0.93 | 0.06 | 0.17 | 0.11 | ||
| 支持向量机 | 23 | 98 | 45 | 0.92 | 0.67 | 0.87 | 0.04 | 0.16 | 0.10 | ||
在洪水类型模拟上,4种模型在第3类洪水特征模拟中相对误差和均方根对数误差最小,相关系数最高,即对第3类洪水的特征指标模拟效果最优,其次为第1类,第2类洪水最差(表4)。其原因可能为第3类洪水主要发生在7—8月的汛期阶段,降水量大,降水和径流特征值之间的关系相对明显,有利于模型的模拟。第2类洪水量级较低,涨退水时间长,降水与洪水特征值之间的关系在一定程度上被削弱,模拟效果偏差。随机森林对第1类洪水(相对误差、相关系数和均方根对数误差分别为23%、0.90和0.07)和第3类洪水(相对误差、相关系数和均方根对数误差分别为12%、0.97和0.03)的特征模拟效果最优,支持向量机则在第2类洪水特征模拟(相对误差、相关系数和均方根对数误差分别为57%、0.77和0.12)中表现优异。即对于低流量、涨落缓慢的洪水,支持向量机相较于随机森林对特征数据中的非线性关系捕捉更灵敏。
表4 4种模型对不同类型洪水的模拟情况
Tab.4
| 评价指标 | 模型 | 洪水类型 | ||
|---|---|---|---|---|
| 1类 | 2类 | 3类 | ||
| 相对误差/% | 多元线性回归 | 37 | 81 | 24 |
| 多层感知器 | 30 | 64 | 24 | |
| 随机森林 | 23 | 69 | 12 | |
| 支持向量机 | 33 | 57 | 18 | |
| 相关系数 | 多元线性回归 | 0.80 | 0.60 | 0.87 |
| 多层感知器 | 0.83 | 0.74 | 0.84 | |
| 随机森林 | 0.90 | 0.74 | 0.97 | |
| 支持向量机 | 0.76 | 0.77 | 0.92 | |
| 均方根对数误差 | 多元线性回归 | 0.10 | 0.18 | 0.07 |
| 多层感知器 | 0.11 | 0.13 | 0.10 | |
| 随机森林 | 0.07 | 0.14 | 0.03 | |
| 支持向量机 | 0.07 | 0.12 | 0.04 | |
3.3 洪水特征指标模拟情况
整体来看,4种模型对量级指标的相对误差范围在16%~44%之间,时间指标的误差在8%~27%之间,动力学指标在39%~192%之间,形态指标在27%~57%之间(图4),即时间指标的模拟效果最优,量级指标次之,动力学指标模拟效果最差。其中随机森林在量级、时间以及形态指标模拟上效果最优,支持向量机在动力学指标模拟上效果最优。
图4
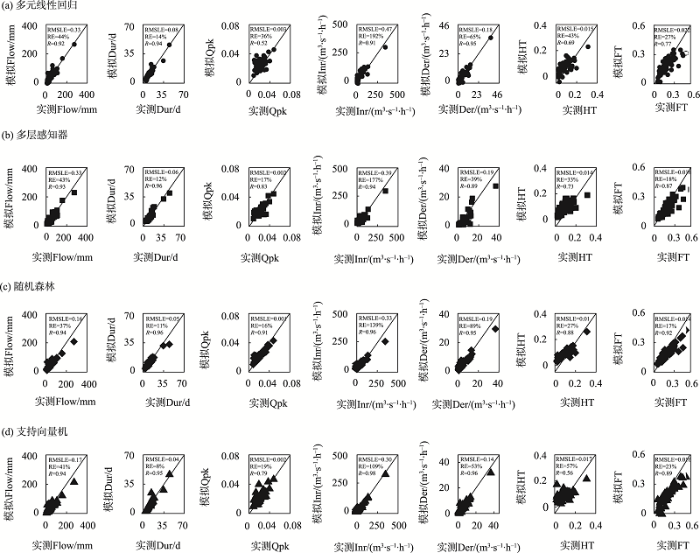
图4
洪水特征指标模拟值与实测值
Fig.4
Simulated and measured values of flood characteristic indicators
在量级指标上,4种模型对Flow的模拟差异不大,相对误差在37%~44%之间,均方根对数误差在0.16~0.33之间,其中随机森林模拟效果最优,多元线性回归最差。对于Qpk,4种模型的相对误差在16%~36%之间,均方根对数误差在0.001~0.003之间,其中随机森林模拟效果最优,多元线性回归最差。在时间指标上,4种模型对Dur的模拟相对误差在8%~14%之间,均方根对数误差在0.04~0.08之间,其中支持向量机模拟效果最优,多元线性回归最差。在FT的模拟上,4种模型的相对误差在17%~27%之间,均方根对数误差在0.014~0.022之间,其中随机森林模拟效果最优,多元线性回归最差。在变率指标上,4种模型对Inr的模拟效果明显较差,相对误差在109%~192%之间,均方根对数误差在0.30~0.47之间,其中支持向量机模拟效果最优,多元线性回归最差。在Der的模拟上,4种模型的相对误差在39%~89%之间,均方根对数误差在0.14~0.19之间,其中支持向量机模拟效果最优,随机森林最差。在形态指标上,4种模型对HT的模拟相对误差在27%~57%之间,均方根对数误差在0.01~0.017之间,其中随机森林模拟效果最优,支持向量机最差。
针对不同类型洪水指标模拟情况(图5),在第1类洪水模拟中,多元线性回归、多层感知器、随机森林和支持向量机对7个洪水特征指标模拟的相对误差均值范围分别为17.08%~71.9%、12.18%~64.64%、9.19%~44.77%和11.58%~84.09%,均方根对数误差的范围分别为0.003~0.34、0.001~0.26、0.001~0.17和0.003~0.14,相关系数的范围分别为0.65~0.97、0.68~0.97、0.72~0.98和0.36~0.96,其中量级、时间、形态指标在随机森林中表现较好,动力学指标在支持向量机中表现较好。对于第2类洪水,4种模型对7个洪水特征指标模拟的相对误差均值范围分别为12.95%~289.1%、12.76%~268.9%、11.47%~217.9%和5.75%~180.5%,均方根对数误差的范围分别为0.003~0.57、0.001~0.48、0.001~0.42和0.001~0.39,相关系数的范围分别为0.12~0.94、0.65~0.95、0.58~0.96和0.60~0.98,其中量级和形态指标在随机森林中表现较好,动力学和时间指标在支持向量机中表现较好。对于第3类洪水,4种模型对7个洪水特征指标模拟的相对误差均值范围分别为12.7%~42.88%、6.99%~39.76%、5.81%~19.18%和1.83%~61.06%,均方根对数误差的范围分别为0.003~0.18、0.003~0.31、0.001~0.07和0.001~0.09,相关系数的范围分别为0.74~0.97、0.72~0.95、0.92~0.99和0.76~0.99,其中量级、形态和时间指标在随机森林中表现较好,动力学指标则在支持向量机中表现较好。
图5

图5
不同机器学习模型对3类洪水的特征指标拟合效果
Fig.5
Fitting effect of different machine learning models on process characteristic indicators of three types of floods
进一步分析洪水特征变化下的模型模拟效果,将率定集和验证集洪水分别按照特征指标的实测值从小到大进行排序并与相对误差求解线性斜率(图6)。结果表明,多元线性回归在率定集和验证集中,7个指标的斜率均为负值,即模型误差随着指标值的增加有降低趋势,模拟效果增强。多层感知器在率定集中,Der的斜率为正值,其余指标均为负值,表明除落洪速率外,其余指标随着实测值的增加其模拟误差有所降低,模拟能力增强;在验证集中,Dur和FT指标的斜率为正值,其余指标为负值,表明模型模拟效果随着Dur和FT指标值的增加而降低,而随着Flow、Qpk、Inr、Der、HT指标值的增加而增强。随机森林在率定集和验证集中,7个指标线性斜率均为负值,表明随机森林的模拟效果随着7个指标值的增加而增强。支持向量机在率定集和验证集中,Dur斜率为正值,其余指标均为负值,表明支持向量机的模拟效果随着Dur指标值的增加而降低,随着其余指标值的增加而增强。
图6
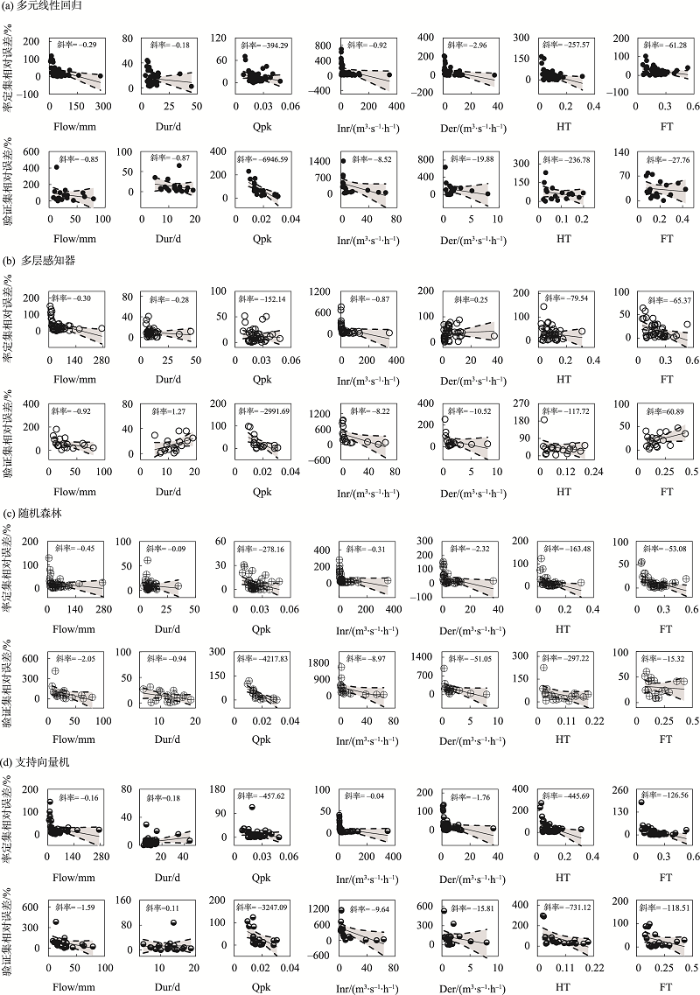
图6
4种模型在洪水特征指标从小到大排序下的相对误差变化趋势
Fig.6
Relative error value changes of flood characteristic indicator simulation using four models ranking from small to large
综上所述,多元线性回归和随机森林的模拟效果随着洪水总量、洪峰流量、洪水历时、高流量历时占比、洪峰时间偏度、涨洪速率和落洪速率等7个指标值的增加而增强;支持向量机的模拟效果随着洪水历时指标值的增加而降低,随着其余6个指标值的增加而增强;多层感知器模拟效果随着洪水总量、洪峰流量、高流量历时占比和涨洪速率等指标值的增加而增强。
4 结论
本文以淮河上游长台关流域为例,重点探索了4种机器学习模型(多元线性回归、多层感知器、随机森林和支持向量机)对不同洪水类型及特征指标的模拟效果。结果表明:
(1) 长台关流域主要的洪水类型可分为洪量中等、历时长且洪峰出现时间偏前的洪水过程,洪水量级较低、形态矮胖且洪峰出现时间靠后的洪水过程和洪水量级大、涨落水迅速、形态尖瘦的洪水过程,3类场次分别占总场次的27.1%、57.6%和15.3%。
(2) 在洪水特征指标模拟上,时间指标模拟效果最佳,4种模型模拟相对误差范围在8%~27%之间,而动力学指标模拟效果最差,4种模型的相对误差范围在39%~192%之间。多元线性回归和随机森林的模拟效果随着洪水总量、洪峰流量、高流量历时占比、洪峰时间偏度、涨洪速率和落洪速率等7个指标值的增加而增强。支持向量机的模拟效果随着洪水历时指标值的增加而降低,随着其余6个指标值的增加而增强。多层感知器模拟效果随着洪水总量、洪峰流量、高流量历时占比和涨洪速率等指标值的增加而增强。
(3) 在洪水类型模拟上,第3类洪水的模拟效果最佳,其次为第1类洪水,最差为第2类。其中随机森林对第1类洪水和第3类洪水的特征模拟效果最优,支持向量机则在第2类洪水特征模拟中表现优异。对于低流量、涨落缓慢的洪水,支持向量机相较于随机森林对数据中的非线性关系捕捉更灵敏。
(4) 通过率定和验证等综合模拟精度来看,最佳模型为支持向量机,其次为随机森林和多层感知器,最差为多元线性回归。
参考文献
City storm-flood events in China, 1984-2015
[J].
Vulnerability evaluation of rainstorm disaster based on ESA conceptual framework: A case study of Liaoning Province, China
[J].
Spatial and temporal distribution and trend in flood and drought disasters in East China
[J].
An analysis of the drought and flood hazard characteristics and risks during the pre-rainy season in South China
[J].
Characterization of flash floods in eastern Kentucky
[J].
Characterization of floods in the United States
[J].
淮河中上游流域洪水主要类型及其时空分布特征
[J].
DOI:10.18306/dlkxjz.2020.04.009
[本文引用: 3]

洪水过程相似性挖掘对流域雨洪资源利用、水库防洪调度以及河流生态修复等具有重要的现实意义。论文以淮河中上游流域16个水文站2006—2015年125场洪水过程数据为基础,采用洪水量、时间、变化率和形态等特征指标对完整洪水过程进行了全面刻画,以主成分分析和层次聚类等多元统计分析手段辨识了流域内代表性洪水类型,揭示了各洪水类型的时空分布特征。结果表明:① 淮河中上游流域主要有5类代表性洪水类型,分别为长历时且变化剧烈型、多峰长历时型、尖瘦短历时型、矮胖型以及常规型。② 从时间分布来看,2006—2015年间洪水类型数量呈现减少趋势,常规型洪水的比例逐渐增大;丰水年份(如2007年)、平水年份(如2006年)的洪水类型较多,而枯水年份(2011—2013年)洪水类型较少,以常规型和矮胖型洪水出现频率居多。③ 从空间分布来看,源头站点的洪水类型较多,中下游站点的洪水类型比较单一,主要从尖瘦型洪水过程逐渐转变为矮胖型,这与流域内水源涵养能力、工程调蓄能力以及降水多样性等有较大的关系。研究可为流域洪水信息挖掘和特征分析等提供参考借鉴,也可为淮河流域洪水的演变特征分析、水库防洪调控和雨洪资源利用等提供决策依据。
Characteristics of main flood event types and their temporal-spatial variations in the upper and middle reaches of the Huai River Basin
DOI:10.18306/dlkxjz.2020.04.009
[本文引用: 3]
Flood similarity identification has important practical significance for floodwater utilization, flood control of reservoirs, and river ecological restoration. In this study, the observations of 125 flood events at the 16 hydrological stations in the middle and upper reaches of the Huai River Basin from 2006 to 2015 were collected, and the metrics of flood magnitude, timing, and rate of changes and patterns were adopted to characterize the entire flood events. Multivariate statistical analysis—principal component analysis and hierarchical clustering method—were adopted to identify the representative flood event types. Finally the temporal and spatial distributions of each flood event type were identified. The results show that: 1) there are five types of representative flood events in the upper and middle reaches of the Huai River Basin, including long duration and extreme variability type, multiple peaks and long duration type, thin and short duration type, fat and short duration type, and conventional type. 2) From the perspective of temporal distribution, the number of flood event types showed a decreasing trend during 2006-2015, and the proportion of conventional floods gradually increased. More flood event types were found in the high flow years ( e.g. 2007) and normal flow years ( e.g. 2006), and fewer types were in the low flow years (2011-2013) with high frequency of conventional and fat and short duration flood event types. 3) From the perspective of spatial distribution, many flood event types appeared at the source regions, and the flood event types at the middle reaches and downstream regions were relatively few. The flood event type of thin and short duration gradually changed to fat and short duration due to the increased water source conservation capacity, reservoirs' storage capacity, and precipitation diversity in the basin. The study provides some reference for flood information mining and characteristics analysis at the basin scale, and provides scientific foundations for decision makers in flood event analysis, reservoir flood control, and floodwater utilization in the Huai River Basin.
Hydrological model comparison and combination for flood forecast in the Three Gorges Region, China
[J].
Rainfall-runoff modelling in northern Australia: A guide to modelling strategies in the tropics
[J].
Predicting runoff signatures using regression and hydrological modeling approaches
[J].
基于时变权重组合与贝叶斯修正的中长期径流预报
[J].
DOI:10.18306/dlkxjz.2020.04.011
[本文引用: 1]
高精度的中长期径流预报信息是水资源规划管理与水利工程经济运行的重要基础支撑。论文在组合预报与误差修正2类径流预报后处理方法串联应用的技术框架下,考虑径流的高度非平稳与非线性等特征,提出了基于时变权重组合和贝叶斯修正的中长期径流预报方法。应用该方法开展了云南龙江水库年、月入库径流预报的实例研究,结果表明时变权重组合平衡了已建立的随机森林与支持向量机模型在建模期与检验期预报性能的差异,经贝叶斯修正后的预报精度接近或优于两阶段各自的最优单一模型。根据年径流预报结果判断水文年型的正确率达到77.2%,月预报径流的确定性系数超过0.90。因此,该方法在提升中长期径流预报精度方面具有积极效果。
Mid-and long-term runoff prediction based on time-varying weight combination and Bayesian correction
DOI:10.18306/dlkxjz.2020.04.011
[本文引用: 1]
<p id="C3">The mid- and long-term runoff prediction with satisfactory accuracy plays an important role as basic information in water resources planning & management and optimal operation of water conservancy projects. Combination and bias reduction are two common post-processing approaches in runoff forecast. Applying them in turn, considering the complicated non-stationary and nonlinear characteristics of runoff, a new mid- and long-term runoff prediction method by connecting time-varying weight combination and Bayesian correction is proposed. This method was used to study the annual and monthly inflow prediction of the Longjiang Reservoir in Yunnan Province. The results show that time-varying weight combination balances the performance difference of the established random forest (RF) and support vector machine (SVM) models in the modeling period and the test period. As a consequence of Bayesian correction, the prediction metrics are close to or better than the best of the predictions of the two individual stages. The proportion of correctly classified hydrological year type reaches 77.2% by employing the forecasted annual runoff, and the Nash-Sutcliffe efficiency coefficient of predicted monthly runoff series is over 0.90. Overall, the method put forward in this study has achieved positive effects in improving the forecast performance.</p>
Comparison of different methodologies for rainfall-runoff modeling: Machine learning vs conceptual approach
[J].
Machine learning based marine water quality prediction for coastal hydro-environment management
[J].
Towards better flood risk management: Assessing flood risk and investigating the potential mechanism based on machine learning models
[J].
Regression analysis of rainfall-runoff data from an arid catchment in Oman
[J].
Relationship between wadi drainage characteristics and peak-flood flows in arid northern Oman
[J].
晋江西溪流域洪水与暴雨时空分布特征的相关分析
[J].基于东南沿海地区暴雨洪水特点,以流域面积2466km<sup>2</sup>的晋江西溪为例,应用1970年代30场暴雨洪水实测资料,统计分析反映暴雨时空变化特征的一系列要素;应用多元线性回归模型,分别建立洪峰流量和洪量,与暴雨时空特征要素之间的多元相关关系。结果表明:①适当选取场次暴雨时空变化特征的要素,可以比较好建立暴雨洪水特征的经验关系;②次降雨量、暴雨相对中心、暴雨时间变差系数和暴雨历时对洪峰流量有显著影响。其中,暴雨相对中心这一指标比较好地揭示了洪峰流量对暴雨和流域产汇流特征空间变化的综合响应;从时间要素上看,暴雨时间变差系数和暴雨历时共同影响洪峰流量的大小;③洪量与次降雨量和起涨流量关系显著。
Regression analysis of flood response to the spatial and temporal variability of storm in the Jinjiangxixi Watershed
Rainfall is the primary input to most hydrological systems. A key issue for hydrological sciences and practices is to assess the importance of spatial structure of rainfall and its representation for flood runoff generation. The Jinjiang watershed lying in southeast Fujian Province is one of the most developed regions in Fujian Province, where convective rainstorms and typhoon storms occur frequently in summer, and the loss caused by flood is often tremendous. Exploring the relationship between storm properties and flood peak and flood volume over this region will provide an important reference for flood forecasting. The objective of this study was to assess the ability of spatial and temporal measures of storm in explaining the runoff response of the watershed. Based on the characteristics of the storm flood in the southeast coastal area of China, the Jinjiangxixi watershed, covering an area of 2,466 km<sup>2</sup>, was selected to perform this study. For calculation of storm properties, spatial information of rainfall was collected. Historical hourly data were available at 13~25 rain gauges and Anxi flow gauges in the Xixi watershed. Several storm indices (e.g. duration, volume, centroid distance, temporal variation coefficient, and spatial variation coefficient) describing the spatial and temporal heterogeneity were estimated for 30 rainstorm flood events occurring in the 1970s. A multiple linear regression analysis was used to estimate the relationship between these storm indices and flood peak and flood volume. Results indicate that 1) If indices describing spatial and temporal variation of storm events were appropriately selected, a better empirical relationship between flow and the storm characteristics could be established; 2) The total storm volume, storm centroid distance, temporal variation coefficient of storm and storm duration seemed to have a significant influence on peak flood. The storm centroid distance was a promising index to investigate the integrated response of flood peak to spatial variability of the storm and characteristics of runoff generation and convergence. Moreover, the temporal variation coefficient of storm and storm duration jointly affected peak flow; 3) The relationship between flood volume and total areal storm volume and the initial discharge was very significant. The flood volume increased with larger storm volume and higher initial discharge.
Flash flood forecasting using support vector regression: An event clustering based approach
[C]//
Comparison of daily streamflow forecasts using extreme learning machines and the random forest method
[J].
基于机器学习算法模型的巫山县洪水灾害研究
[J].
The flood disasters in Wushan County based on machine learning algorithm model
Artificial neural network for modelling rainfall-runoff
[J].
Machine learning methods for empirical streamflow simulation: A comparison of model accuracy, interpretability, and uncertainty in seasonal watersheds
[J].
The research of Wei River runoff prediction system based on machine learning
近60年淮河流域夏季降水的变化特征
[J].
Variation characteristics of summer precipitation in Huaihe River Basin in recent 60years
A Bayesian analysis of the minimum AIC procedure
[J].
