

陕北黄土高原以其独特的地貌形态格局吸引了国内外众多地理学者的关注,被誉为全球最具有地学研究价值的区域之一。其中,沟谷是黄土高原物质交换最频繁、形态变化最剧烈的区域,其发育对整个黄土高原地貌的发育过程具有重要的控制性作用。
黄土高原沟谷地貌在发育过程中存在3个显著特征,分别是:溯源侵蚀引起的沟头不断前进、下切侵蚀引起的沟体持续下切和横向侵蚀引起的沟坡逐步展宽[1⇓⇓⇓-5]。迄今为止,现有研究从构造[6-7]、侵蚀[8-9]、气候[10-11]等多种视角出发对陕北黄土高原沟谷地貌的发育进程进行了探讨,阐明了陕北黄土高原沟谷地貌发育进程的态势机制[12],分析了陕北黄土高原沟谷地貌的发育特征[13]、空间分异规律[14]及发生规律[15],这些研究成果进一步明确了陕北黄土高原沟谷地貌在发育过程中的外在表现,同时也使其具体发育状态和内在侵蚀机制更加明晰。同时,经过多年的研究,诸多学者从不同的角度出发,提出构建了上百种不同的用于描述各种流域、沟谷特征的量化指标[16]及地形因子[17-18],按照各自的认识对其中一些指标间的关系、类型进行了科学分类[19-20],并对其与水土流失等现象之间的关系进行了相关性分析[21-22],但是,已有的关于沟谷系统发育的研究还未系统性地探究各维度发育进程的具体态势及各维度之间的相互影响。因此,本文在遵循一定科学规律的前提下,基于地貌类型及其特征,对陕北黄土高原具有明显沟蚀特征的完整小流域进行空间上的序列采样[23-24],全面考虑沟谷的纵向、横向、垂向多维度侵蚀发育特征,探究各维度发育在沟谷整体发育进程中所起到的影响程度,以更好地揭示陕北黄土高原沟谷地貌的发育态势及机制。具体方法为:基于高分辨率数字高程模型(DEM)和与之匹配的数字正射影像(DOM),选取沟谷密度、水平逼近度与切割深度分别作为溯源侵蚀、横向侵蚀与下切侵蚀的代表性因子,利用GIS空间分析技术与数字地形分析方法,分析陕北黄土高原水蚀沟谷不同维度的侵蚀发育特征,探讨与其差异性表现相关的影响因素,在此基础上揭示地形地貌发育的特征。
1 研究区域、数据与方法
1.1 研究区概况
图1

图1
陕北黄土高原研究区位及样区点位
注:样区点详情见
Fig.1
Location of the study area and sample sites on the Loess Plateau of Northern Shaanxi
表1 42个样区位置及地貌类型特征
Tab.1
| 样区编号 | 纬度/(°N) | 经度/(°E) | 地貌类型 | 样区编号 | 纬度/(°N) | 经度/(°E) | 地貌类型 |
|---|---|---|---|---|---|---|---|
| 1 | 34.73 | 107.41 | 黄土覆盖的中起伏陡中山 | 22 | 36.73 | 108.28 | 中海拔侵蚀堆积高浅谷黄土狭斜梁 |
| 2 | 34.98 | 107.78 | 倾斜的中海拔侵蚀堆积黄土塬 | 23 | 36.94 | 107.34 | 平坦的中海拔侵蚀堆积黄土塬 |
| 3 | 34.54 | 108.16 | 中海拔侵蚀堆积高深谷黄土狭斜梁 | 24 | 36.98 | 108.78 | 黄土覆盖的中起伏缓中山 |
| 4 | 34.9 | 108.03 | 黄土覆盖的小起伏缓中山 | 25 | 36.98 | 109.53 | 中海拔侵蚀堆积高浅谷黄土峁 |
| 5 | 35.10 | 108.41 | 中海拔侵蚀堆积高深谷黄土狭斜梁 | 26 | 36.90 | 110.22 | 中海拔侵蚀堆积黄土梁塬 |
| 6 | 35.10 | 108.84 | 黄土覆盖的中起伏缓中山 | 27 | 37.06 | 110.28 | 中海拔侵蚀堆积高浅谷黄土峁 |
| 7 | 34.90 | 108.41 | 倾斜的中海拔侵蚀堆积黄土塬 | 28 | 37.23 | 109.03 | 中海拔侵蚀堆积高浅谷黄土峁 |
| 8 | 35.10 | 109.41 | 黄土覆盖的小起伏平缓中山 | 29 | 37.27 | 108.34 | 中海拔河谷平原 |
| 9 | 35.29 | 111.09 | 侵蚀剥蚀小起伏缓低山 | 30 | 37.23 | 107.66 | 中海拔侵蚀堆积黄土梁塬 |
| 10 | 35.27 | 109.03 | 黄土覆盖的小起伏缓中山 | 31 | 37.44 | 108.72 | 中海拔侵蚀堆积高浅谷黄土狭斜梁 |
| 11 | 35.48 | 109.34 | 倾斜的中海拔侵蚀堆积黄土塬 | 32 | 37.40 | 109.41 | 中海拔侵蚀堆积高浅谷黄土峁 |
| 12 | 35.98 | 109.09 | 黄土覆盖的小起伏缓中山 | 33 | 37.52 | 109.72 | 中海拔侵蚀堆积高深谷黄土峁梁 |
| 13 | 35.98 | 109.78 | 黄土覆盖的中起伏缓中山 | 34 | 37.60 | 110.28 | 中海拔侵蚀堆积高浅谷黄土峁 |
| 14 | 36.06 | 110.28 | 侵蚀剥蚀中起伏陡中山 | 35 | 37.81 | 109.91 | 中海拔侵蚀堆积高深谷黄土峁 |
| 15 | 36.31 | 110.16 | 中海拔侵蚀堆积黄土残塬 | 36 | 37.81 | 109.41 | 中海拔侵蚀堆积高深谷黄土峁梁 |
| 16 | 36.23 | 109.53 | 黄土覆盖的中起伏平缓中山 | 37 | 37.81 | 109.22 | 中海拔侵蚀堆积高深谷黄土峁 |
| 17 | 36.31 | 108.91 | 黄土覆盖的中起伏缓中山 | 38 | 37.98 | 110.28 | 中海拔侵蚀堆积高深谷黄土峁 |
| 18 | 36.48 | 108.66 | 黄土覆盖的中起伏陡中山 | 39 | 38.10 | 109.91 | 中海拔侵蚀堆积高浅谷黄土峁梁 |
| 19 | 36.56 | 109.41 | 中海拔侵蚀堆积高浅谷黄土峁梁 | 40 | 38.48 | 110.53 | 中海拔侵蚀堆积高浅谷黄土峁梁 |
| 20 | 36.77 | 109.91 | 中海拔侵蚀堆积低浅谷黄土峁梁 | 41 | 38.60 | 110.78 | 中海拔侵蚀堆积高浅谷黄土狭斜梁 |
| 21 | 36.77 | 109.03 | 中海拔侵蚀堆积高浅谷黄土峁梁 | 42 | 38.98 | 110.84 | 中海拔侵蚀堆积高浅谷黄土狭斜梁 |
1.2 数据来源与处理
在前人研究基础上,结合因子的地学意义遴选出科学、具有代表性且切合于本文研究目标的3个指标:① 沟谷密度,反映区域内水平方向上沟头前进即沟谷纵向延伸程度的发育特征;② 水平逼近度,反映区域内水平方向上沟谷三线(沟谷线、沟沿线、流域分水线)逼近程度即横向拓展程度的发育特征;③ 切割深度,反映区域内垂直方向上沟谷下切发育程度的发育特征。将上述3个指标分别作为陕北黄土高原水蚀沟谷纵向、横向与垂向的代表因子(表2)。
表2 多维度代表因子指标系统
Tab.2
| 指标名称 | 指标定义 | 计算公式 | 地理意义 |
|---|---|---|---|
| 沟谷密度 (km/km2) | 沟谷总长度与流域面积之比 | 反映沟头前进及沟谷侵蚀发育程度的重要指标。指标值越大,说明沟头前进程度越大,即沟谷生长延伸程度越大,发育程度越高 | |
| 水平逼近度 (m/m) | 沟谷长度与上游水流长度和沟谷长度之和之比 | 表示沟谷源点在水平方向上向流域分水线逼近的程度,直观反映了沟谷系统横向发育程度。指标值越大,横向发展程度越高,沟谷横向侵蚀程度越高 | |
| 切割深度 (m) | 在地面某点的一定邻域范围内,平均高程与最小高程的差值 | 直观反映了沟谷下切发育程度和地表被侵蚀切割的程度。指标值越大,地表侵蚀切割越剧烈,沟谷下切发育程度越高 |
汇流阈值的数值设置是沟谷密集程度与沟谷级别的决定性因素,如何确定合理阈值决定了研究的准确性和可靠性[26]。本文选用Strahler提出的河网分级平均分支比,在平均分支比数值趋于稳定的情况下获取最佳阈值,并使用该阈值进行网络的提取[27]。随后,结合DOM数据与影像数据对获取的基础网络进行目视解译,手动剔除小于50 m的沟谷和伪沟谷后得到研究使用的初始沟谷网络。最后,利用目视解译得到的沟沿线数据对初始沟谷网络进行约束得到最终沟谷网络(图2),计算得到沟谷密度。同时,提取沟沿线与沟谷网络交点得到沟谷源点[28]。利用ArcGIS水文分析模块提取流域分水线,构建上游水流长度栅格图层,模式化求算样区上游水流长度;随后利用得到的上游水流长度图层获取得到沟谷源点处的上游水流长度数据;最后依据水平逼近度公式计算得到沟谷的水平逼近度数值[29]。本文将沟谷区域确定为地表切割深度的计算范围,对其进行邻域分析得到切割深度。
图2
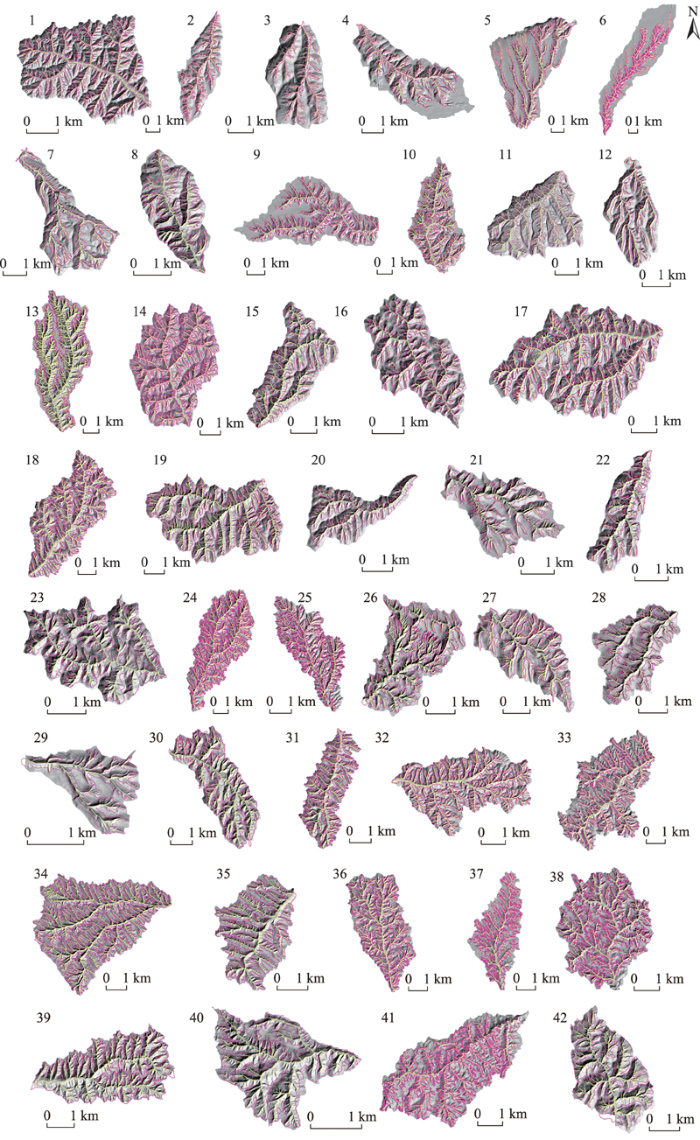
图2
研究样区沟谷网络
注:图中左上角数字为样区编号,详情见
Fig.2
Gully networks of the study area
在指标选取基础之上,本文以地貌学、形态学、水文学原理为理论基础,结合数字地形分析、空间统计分析和数据分析等多种分析方法,利用空间内插、数学建模等手段,从沟谷的多维视角出发,探索陕北黄土高原水蚀沟谷发育的空间差异性。
1.3 研究方法
(1) 标准化:又称为离差标准化,使结果值映射到[0, 1]之间。消除指标之间的量纲影响,以解决数据指标之间的可比性。
式中:x为序列值x1, x2, …, xn;x′∈[0, 1]且无量纲。
(2) 离散系数:又称变异系数,是衡量资料中各观测值离散程度的一个统计量。离散系数大,说明数据的离散程度也大;离散系数小,说明数据的离散程度也小。
式中:Cv为离散值,δ为标准差,μ为平均值。
(3) 影响程度:反映各指标对于整体发育进程所起到的各自影响程度。
式中:
2 结果与分析
2.1 多维度侵蚀发育空间特征及态势机制
对42个样区的指标值进行归一化处理,利用ArcGIS空间分析软件中地统计模块对得到的标准化数据进行分析。结合地统计分析结果来看(图3),3组数据均符合空间正态分布特征。沟谷密度和水平逼近度空间特征相似,均为东西方向(XZ面)上先减小后增加、南北方向上(YZ面)逐渐增加;切割深度为东西方向(XZ面)上先减小后增加、南北方向(YZ面)上先增大后减小。沟谷密度、水平逼近度和切割深度在三维空间内所呈现出的显著方向性说明用于分析的3组数据内部均存在一定的趋势特征。为探明这种趋势特征,对数据进行多项式拟合以进一步分析。
图3
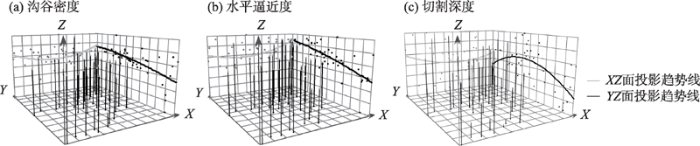
图3
沟谷密度、水平逼近度和切割深度在正交方向上趋势图
注:X轴为东西方向,Y轴为南北方向。
Fig.3
Gully density, lateral expansion degree and downcutting depth orthogonal trend graph
图4显示,陕北黄土高原由南至北沟谷密度与水平逼近度呈波浪式上升趋势,表明陕北黄土高原南北方向整体上溯源侵蚀和侧蚀程度加剧,发育程度渐高;切割深度呈先上升后下降趋势,表明陕北黄土高原南北方向上下切侵蚀先加剧后减弱,发育程度渐高;结合陕北黄土高原地貌类型可以发现,各维度代表因子的高值区均处于黄土高原峁状丘陵沟壑区与梁峁状丘陵沟壑区,低值区均处于台塬、残塬、梁塬区。
图4

图4
陕北黄土高原沟谷系统南北向多维发育态势及各维度影响程度
Fig.4
Muti-dimensional development trend and contribution of gullies on the Loess Plateau in Northern Shaanxi in the south-north direction
为分析陕北黄土高原南北方向上各维度因子的影响程度,本文对归一化后的指标值进行影响程度计算,根据结果发现54.8%的样区各维度影响程度相近,且86.4%处于陕北黄土高原中部地区,而南北两端沟谷密度与水平逼近度占比较大,即中部地区多维度发育较为均衡,南北两端以溯源侵蚀与横向侵蚀为主。整体来看,在陕北黄土高原南北方向上多维度发育呈现由溯源侵蚀主导转向横向溯源侵蚀主导到溯源下切侵蚀主导再到溯源横向侵蚀主导。黄土塬区、残塬区多为溯源侵蚀主导与溯源下切主导,黄土峁梁状丘陵沟壑区、峁状丘陵沟壑区多为溯源下切侵蚀主导和溯源横向侵蚀主导,这与其所处发育阶段及黄土构造存在一定关系:塬区多处于发育初期且其沟谷的黄土层厚、水量大,故沟床的溯源侵蚀剧烈并伴有明显下切侵蚀,进而带动横向侵蚀;而丘陵沟壑区多处于发育中晚期,其黄土层薄、下伏岩性大多较坚硬、抗冲性好,且水量相对较小,在中期由溯源侵蚀带动的强烈的下切侵蚀在侵蚀达到一定程度后,其下切侵蚀速度随之减弱。
图5
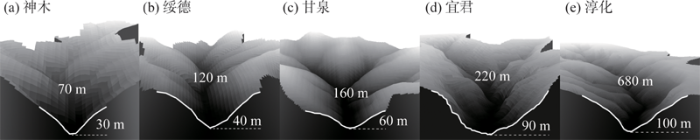
图5
陕北黄土高原北南向典型样区横向剖面图
Fig.5
Profiles of typical sample sites from north-south on the Loess Plateau of Northern Shaanxi
图6
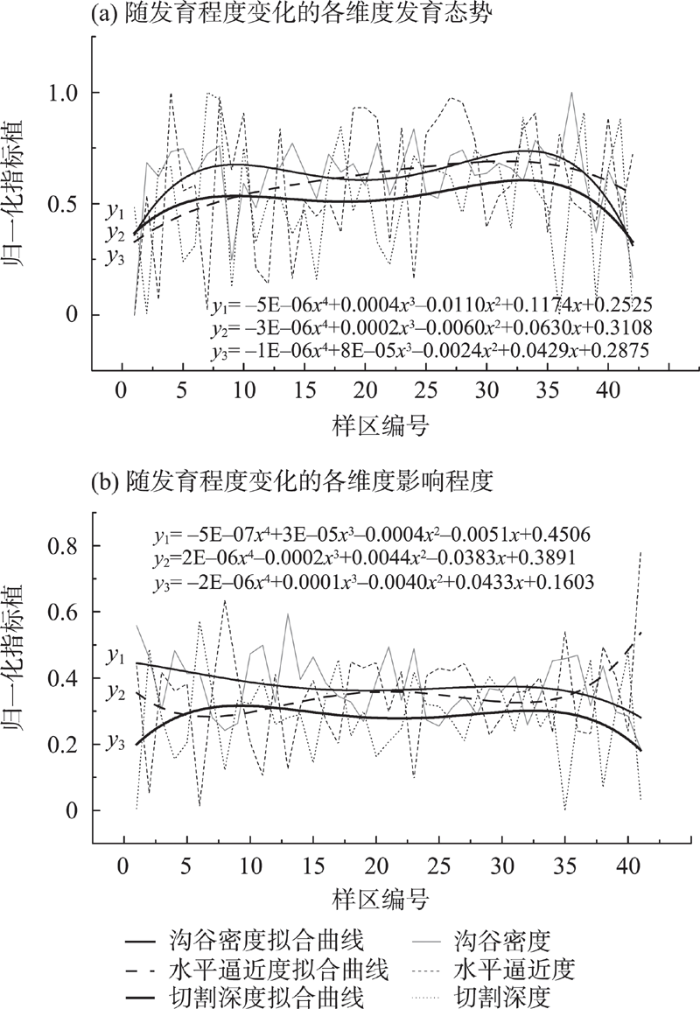
图6
陕北黄土高原沟谷系统随发育程度(面积—高程积分)变化的多维发育态势及各维度影响程度
Fig.6
Multi-dimensional development trend and contribution change of gullies on the Loess Plateau of Northern Shaanxi
发育初期是在降雨后随着物质的迁移产生沟口,初生的沟谷形态特征不稳定进而沟道快速形成,水流集中到新生沟槽中,冲刷侵蚀能量增大,在冲蚀下伏土体的同时进行侧蚀,沟谷系统的溯源侵蚀、横向侵蚀与下切侵蚀在这一阶段迅速发展;发育中期是沟谷发展的稳定阶段,占沟谷发育期的大部分,具体表现为沟谷系统的继续深切与展宽,溯源侵蚀、横向侵蚀与下切侵蚀都处于较平稳的状态,因而沟底和沟壁形态比较稳定;发育晚期沟谷系统整体发育进程明显减弱,这一阶段沿沟床的侵蚀和沉积都比较微弱,最终将形成稳定的和缓宽敞的沟谷。陕北黄土高原大部分样区(88.10%)处于发育中期,北部及西北部边缘区域部分样区(7.14%)处于发育初期,南部边缘区域部分样区(4.76%)处于发育晚期。
2.2 影响因素分析
陕北黄土高原经过长久的侵蚀堆积形成了如今的黄土地貌,黄土厚度、多年平均降雨量和人类活动等内外部力量都可能是造成黄土高原水土流失的重要影响因素,因此本文选定黄土厚度、多年均降雨量及土地利用类型作为沟谷多维度侵蚀特征的影响因素进行分析,探究其对沟谷多维度侵蚀发育是否存在以及存在何种程度的影响。
2.2.1 不同黄土厚度下三维发育差异性分析
黄土高原黄土层平均厚度为200 m,最厚处可达400 m,为土壤侵蚀提供了充分的物质供给。不同厚度的黄土其形成时间、黄土粒度和物质结构均不相同,对侵蚀结果造成影响也不同。本文对42个样区的黄土厚度按照25 m为阈值进行分段统计,结果如表3所示。
表3 不同黄土厚度下三维度代表因子对比
Tab.3
| 因子 | 黄土厚度/m | 离散系数 | |||||||
|---|---|---|---|---|---|---|---|---|---|
| 25~50 | 50~75 | 75~100 | 100~125 | 125~150 | 150~175 | 175~200 | >200 | ||
| 沟谷密度/(km/km2) | 0.18 | 0.18 | 0.47 | 0.59 | 0.75 | 1.00 | 0 | 0.43 | 0.055 |
| 水平逼近度/(m/m) | 0.67 | 0.53 | 0.66 | 0.49 | 0.70 | 1.00 | 0.78 | 0 | 0.105 |
| 切割深度/m | 0.04 | 0.25 | 0.40 | 0.31 | 0.49 | 1.00 | 0 | 0.50 | 0.164 |
沟谷密度、水平逼近度及切割深度的最大值均出现在黄土厚度150~175 m的样区,说明在黄土厚度处于150~175 m的区域,沟谷各维度发育情况相近且发育较成熟。而在黄土厚度为175~200 m的实验样区,沟谷密度与切割深度出现最小值,明显低于水平逼近度。计算各维度代表因子的离散系数可以发现,切割深度的离散系数最大,这表明陕北黄土高原黄土厚度的差异对切割深度即下切侵蚀的影响最大,而沟谷密度的影响相对来说最小。在陕北黄土高原地区沟谷的发育并非随着黄土厚度的增大而加剧,这可能与长久的黄土堆积所造成的黄土岩性及构造的改变有关。
2.2.2 不同平均降雨量下三维发育差异性分析
降雨(地表径流)是影响黄土高原沟谷发育的重要外营力之一,降雨对沟谷系统侵蚀的影响主要体现在降雨强度、降雨量等方面。黄土高原沟谷系统的发育是一个漫长的过程,故本文选取1980—2018年的平均降雨量对陕北黄土高原多维度代表因子进行统计分析。
表4为不同多年平均降雨量的多维度代表因子的对比结果,可以发现,3个代表因子的离散系数数值趋势与不同黄土厚度的数值趋势相近似,其中切割深度的离散系数相对来说较大,即多年均降雨量对下切侵蚀的影响较其他维度而言要大一些,而对于纵向溯源侵蚀的影响较小,这与沟头的发展主要是由于崩塌、潜蚀、溶蚀所致的溯源侵蚀有关。
表4 不同多年平均降雨量下的多维度代表因子对比
Tab.4
| 因子 | 年平均降雨量/mm | 离散系数 | |||||||||
|---|---|---|---|---|---|---|---|---|---|---|---|
| 375~400 | 400~425 | 425~450 | 450~475 | 475~500 | 500~525 | 525~550 | 550~575 | 575~600 | >600 | ||
| 沟谷密度/(km/km2) | 1.00 | 0.62 | 0.78 | 0.55 | 0.48 | 0.61 | 0.44 | 0.24 | 0.19 | 0 | 0.065 |
| 水平逼近度/(m/m) | 1.00 | 0.84 | 0.42 | 0.24 | 0.63 | 0.23 | 0.61 | 0.89 | 0.25 | 0 | 0.095 |
| 切割深度/m | 1.00 | 0.49 | 0.65 | 0.91 | 0.91 | 0.60 | 0.90 | 0 | 0.17 | 0.26 | 0.103 |
由表4还可以发现,在多年平均降雨量375~400 mm区段沟谷密度、平均逼近度与切割深度均出现最大值,表明沟谷各维度发育情况相近且发育较成熟。整体来看,随着多年均降雨量的增加,多维度代表因子的数值均呈现出递减态势。
2.2.3 不同土地利用类型下三维发育差异性分析
土地利用类型是自然条件和人类社会活动综合作用的复杂综合体,不同的土地利用方式对沟谷的发育进程造成的影响也不同。通过对比国家青藏高原科学数据中心生产的1985、1990、1995、2000、2005、2010及2015年共7期土地利用遥感监测数据,本文发现本研究所包含的42个样区的土地利用情况不存在较大变化,故以各样区所涵盖的主要土地利用类型为基础对研究样区的沟谷密度、水平逼近度和切割深度进行分类统计。42个研究样区包含旱地、有林地、灌木林、疏林地、高覆盖度草地、中覆盖度草地、低覆盖度草地、滩地、农村居民点共计9种土地利用类型。
由图7和表5可以发现,研究区的土地利用类型以旱地和中覆盖草地为主,灌木林和疏林地为辅,3个代表因子的离散系数相较于黄土厚度与多年均降雨量而言较小,即土地利用类型对于3个维度的影响与多年平均降雨量离散系数相同。土地利用类型为低覆盖度草地的样区沟谷密度、水平逼近度以及切割深度数值均为高值,说明在低覆盖度草地区域沟谷溯源侵蚀横向侵蚀以及下切侵蚀的发育程度均较高,沟谷各维度发育程度相近。这类草地由于水分匮乏草被稀疏导致表层黄土干燥,在降雨和地表径流的作用下黄土表面会发生水土流失,使得沟头不断后退,沟谷源点也逐渐逼近于流域分水线。土地利用类型为有林地的样区沟谷密度、水平逼近度以及切割深度数值均为最低值,说明在有林地区域沟谷的各维度发育程度均较低,林地在拦截降雨保护地表以及调节地表径流等方面的能力在较大程度上优于草地和旱地,能够极大增加土壤下渗所需耗费的时间,并且在提高土壤渗透性的同时提高土壤的抗蚀性能与抗冲性能。
图7
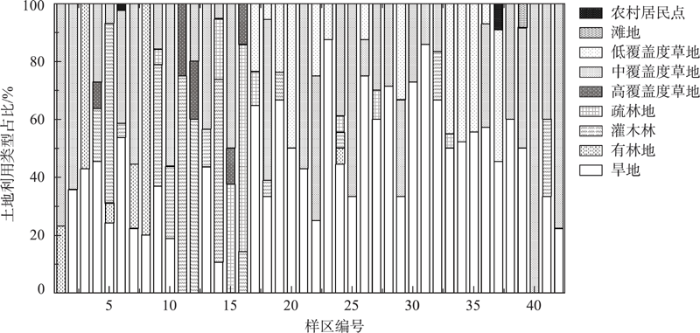
表5 不同土地类型下的多维度代表因子对比
Tab.5
| 因子 | 土地类型 | 离散系数 | ||||||
|---|---|---|---|---|---|---|---|---|
| 旱地 | 有林地 | 灌木林 | 疏林地 | 高覆盖度草地 | 中覆盖度草地 | 低覆盖度草地 | ||
| 沟谷密度/(km/km2) | 0.80 | 0 | 0.69 | 0.76 | 0.34 | 0.80 | 1.00 | 0.0473 |
| 水平逼近度/(m/m) | 0.38 | 0 | 0.15 | 0.38 | 1.00 | 0.26 | 0.90 | 0.0681 |
| 切割深度/m | 0.70 | 0 | 0.56 | 0.99 | 0.57 | 0.76 | 1.00 | 0.0479 |
综合数据结果可以发现,林地对于维护3个维度的抗侵蚀能力最强,生长茂密的草地和灌木林及作物等次之,生长稀疏的牧草和作物较差。
3 结论与讨论
本文利用高精度DEM数据,借助数字地形分析和形态学分析方法,遴选陕北黄土高原地区42个完整小流域为实验样区,以沟谷密度、水平逼近度、切割深度3个因子为代表研究了陕北黄土高原黄河流域沟谷系统在溯源侵蚀、横向侵蚀和下切侵蚀多个维度上的侵蚀发育态势及相关关系,探讨了多维度代表因子在陕北黄土高原的空间分异规律,分析了形成这种态势的可能影响因素,主要结论如下:
(1) 陕北黄土高原中部地区多维度发育程度均衡,南北两端以溯源侵蚀与横向侵蚀为主。随着发育程度的逐渐升高,沟谷系统发育可以划分为3个阶段:发育初期以溯源侵蚀为主,带动下切侵蚀伴有横向侵蚀;发育中期以溯源侵蚀为主,伴有持续性横向侵蚀与较强下切侵蚀,各维度发育均衡;发育晚期以横向侵蚀为主,伴有一定程度的溯源侵蚀与轻微下切侵蚀。陕北黄土高原地区大部分处于发育中期,北部及西北部边缘区域部分样区处于发育初期,南部边缘区域部分样区处于发育晚期。整体来看,陕北黄土高原地区由北向南发育程度逐渐升高。
(2) 陕北黄土高原黄土厚度对沟谷系统下切侵蚀的影响最大(Cv=0.164),对溯源侵蚀的影响最小(Cv=0.055);土地利用类型对于溯源侵蚀与下切侵蚀的影响相近,林地对于维护各个维度的抗侵蚀能力最强,生长茂密的草地和灌木林及作物等次之,生长稀疏的牧草和作物较差。
(3) 从纵向、横向、垂向多个维度探讨了陕北黄土高原水蚀沟谷的发育态势特征,对黄土高原沟谷地貌发育的多维关系研究进行了补充,对揭示黄土小流域发育特征也具有一定的指示作用。同时,探讨影响其发育的可能性因素,也为进一步研究黄土高原土壤侵蚀和制定水土保持措施提供一定的借鉴。
参考文献
黄土丘陵区沟谷发育及其稳定性评价
[J].
Development of gullies and evaluation on their stability in the loess hill region
How fast do gully headcuts retreat?
[J].DOI:10.1016/j.earscirev.2016.01.009 URL [本文引用: 1]
黄土丘陵地貌形成模式与地貌演变
[J].
Formation model and geomorphic evolution of loess hilly landforms
黄土高原水蚀沟谷发育阶段研究
[J].
Study on the development stages of water erosion gullies in the Loess Plateau
Equilibrium theory of erosional slopes approached by frequency distribution analysis: Part I
[J].DOI:10.2475/ajs.248.10.673 URL [本文引用: 1]
全球视野下崩岗侵蚀地貌及其研究进展
[J].
DOI:10.18306/dlkxjz.2018.03.005
[本文引用: 1]

典型的崩岗具有“圆形露天剧场”般的沟头,发育在深厚的红色花岗岩风化壳上,通常包括集水坡面、崩壁、崩积体、沟道、洪积扇5个地貌组成部分;崩壁自上而下可分为表土层、风化红粘土层(红土层)、风化砂质红粘土层(砂土层)、风化粗碎屑层(碎屑层)。中国的崩岗与马达加斯加的lavaka属于同类地貌,两者具有地貌学上的可比性。崩岗群是劣地的表现形式之一,但与欧洲的badland有不同的侵蚀过程,也不同于意大利和巴西的两种沟谷侵蚀地貌calanchi和vocoroca。崩岗主要发育在华南和东南热带和亚热带湿润季风气候区中等偏缓的丘陵坡地上,由沟谷侵蚀发展而成,是沟谷侵蚀的高级阶段。崩岗沟道侵蚀产沙量占崩岗沟谷流域侵蚀产沙量的一半以上,其中沟道沟壁崩塌侵蚀产沙量与沟床下切侵蚀产沙量又各占崩岗沟道侵蚀产沙量的一半左右。野外人工模拟降雨试验是研究崩岗流域侵蚀、产流和产沙过程的有效手段。崩岗流域侵蚀产沙量可以通过崩岗沟谷和洪积扇地形测量加以估算。
Benggang erosion landform and research progress in a global perspective
DOI:10.18306/dlkxjz.2018.03.005
[本文引用: 1]
The typical benggang has an amphitheater-like gully-head, mainly occurs in the deeply weathered granite area in southern and southeastern China. It usually consists of five parts: water-collection slope, headwall, colluvium, channel, and debris fan. From top to bottom, benggang headwall may be divided into four soil layers: topsoil, red soil, sandy soil, and clastic soil. Benggang in China and lavaka in Madagascar belong to the same type of landform with comparable geomorphologic characteristics. Benggang may be considered as one of the badland landscapes, but it has different erosion process. It is also different from the other two gully erosion landforms in Italy and Brazil: calanchi and vocoroca. Benggang is mainly distributed in moderate hilly region and subtropical maritime climate zone of southern and southeastern China. Usually benggang is also considered to develop from gully erosion, and it is treated as the advanced stage of gully evolution. The sediment yield of benggang channel erosion accounts for more than half of the sediment amount of the whole benggang gully catchment, and likewise the sediment yield of channel-bed accounts for about half of the sediment amount of the whole gully catchment. Simulated rainfall is a powerful tool to study the effects of rainfall on surface processes and erosion. The in situ artificial simulated rainfall is an effective method to study benggang erosion, slope runoff, and sediment transportation in benggang gully catchment. Benggang erosion is a geomorphic critical phenomenon. This critical phenomenon occurs only when the rainfall, topography, soil, and runoff exceed their critical thresholds. Field artificial rainfall experiments based on simulated rainfall-slope runoff-erosion process-sediment production observations may greatly improve the understanding of benggang erosion in southern and southeastern China. The sediment yield of benggang catchment may be estimated by the morphometric analyses on the topographies of benggang gully and debris fan
关于沟谷侵蚀的研究
[J].
Research on gully erosion
沟蚀过程研究进展
[J].
A review of gully erosion process research
1959-2008年黄土高原地区年内降水集中度和集中期时空变化特征
[J].
Inhomogeneity characteristics of intra-annual precipitation on the Loess Plateau during 1959-2008
降水和植被变化对径流影响的尺度效应: 以陕北黄土丘陵沟壑区为例
[J].
DOI:10.18306/dlkxjz.2015.08.011
[本文引用: 1]
自黄土高原退耕还林还草政策实施以来,在水源涵养功能明显提升的同时径流显著减少,导致该区域出现了水源涵养服务与水供给服务间的权衡问题。为探究径流减少的原因,进而为不同空间尺度的生态系统服务权衡提供支撑,本文分析了陕北黄土丘陵沟壑区2006-2011年降水和植被变化对径流影响的尺度效应。结果表明:研究区域内汛期降水量呈现出由东南向西北逐渐减少的空间分异特征;在研究时段内,植被恢复效果明显,近8成地区植被覆盖状况得到了改善,尤其是植被覆盖较差的地区恢复效果更为显著;在各子流域中,降水与径流间呈现出显著的正相关性,二者的相关系数随着子流域面积的增加而增大,表现出明显的尺度效应。随着子流域面积增大,15°以上土地比例增加,陡坡植被覆盖类型趋于均一化,具有显著截流功能的林地呈现减少趋势是尺度效应形成的主要原因。NDVI与径流的相关性不显著,二者的相关系数随着子流域面积变化的规律性不强,植被对径流影响没有明显的尺度效应。
Scale effect of the impact on runoff of variations in precipitation/vegetation: Taking northern Shaanxi loess hilly-gully region as an example
DOI:10.18306/dlkxjz.2015.08.011
[本文引用: 1]
Water conservation capability of the loess plateau increased significantly since the Grain for Green project started. At the same time, the amount of runoff significantly reduced, resulting in the question of how to balance the water conservation needs and the need for water supply in the region. In order to explore causes of the runoff reduction and provide support for balancing different needs for water at different scales, the variation of precipitation and vegetation as well as the scale effect of its impact on runoff in northern Shaanxi loess hilly-gully region during 2006 to 2011 were examined. The results show that: Precipitation of flood season gradually reduced from southeast to northwest in the study area. During the research period, vegetation restored significantly, nearly 80% of vegetated area was improved, especially in areas with poor vegetation conditions. Precipitation and runoff had significant positive correlation. With the increase of sub-watershed area,the correlation of precipitation and runoff increased, which shows a clear scale effect. The main reason was that land use structure above 15° of slope changed along with the spatial scale—vegetation types at steep slope tended to be homogenous and forest that has significant water conservation function decreased along with the increase in sub-watershed area. The correlation between NDVI and runoff was neither significant nor forming a clear relationship with the area of sub-watersheds, therefore the scale effect of vegetation influence on runoff was not obvious.
A gully erosion assessment model for the Chinese Loess Plateau based on changes in gully length and area
[J].DOI:10.1016/j.catena.2016.04.018 URL [本文引用: 1]
基于DEM的黄土塬形态特征分析及发育阶段划分
[J].
Morphological characteristics and developmental stages of loess tablelands based on DEM.
黄土高原坡面沟蚀的类型及其发生发展规律
[J].
The laws of hillslope channel erosion occurrence and development on Loess Plateau
黄土地貌沟沿线研究综述
[J].
A review on research of loess shoulder-line
黄土沟谷下蚀趋势评价的指标体系研究
[J].
Index system for evaluating gulley's down-erosion trendency in loess area
Characteristics and influencing factors of proximity distance index on the northern Shaanxi Loess Plateau in China
[J].
DOI:10.1007/s11629-019-5610-9
[本文引用: 1]
Topographic feature points and lines are the framework of topography, and their spatial distance relationship is an breakthrough in the study of topographical geometry, internal structure and development level. Proximity distance (PD) is an indicator to describe the distance between the gully source point (GSP) and the watershed boundary. In the upstream catchment area, PDs can be expressed by the streamline proximity distance (SPD), as well as by the horizontal proximity distance (HPD) and the vertical proximity distance (VPD) in the horizontal and vertical dimensions, respectively. The series of indicators (e.g., SPD, HPD and VPD) are important for quantifying the geomorphological development process of a loess basin because of the headward erosion of loess gullies. In this study, the digital elevation model data with 5 m resolution and a digital topographic analysis method are used for the statistical analyses of the SPD, VPD and HPD in 50 sample areas of 6 geomorphic types in the Loess Plateau of northern Shaanxi. The spatial characteristics and the influencing factors are also analysed. Results show that: 1) Central tendencies for the HPDs and the VPDs for the whole study area and the six typical loess landforms are evident. 2) Spatial patterns of the HPDs and the VPDs exhibit evident trends and zonal distributions over the whole study area. 3) The HPDs have a strong positive correlation with gully density (GD) and hypsometric integral. The VPDs also correlates with GD to an extent. Vegetation cover, mean annual precipitation and loess thickness have stronger effects on the VPD than on the HPD.
Spatial distribution and influencing factors of Surface Nibble Degree Index in the severe gully erosion region of China's Loess Plateau
[J].DOI:10.1007/s11442-021-1912-2 URL [本文引用: 1]
流域地貌演化的不同阶段沟壑密度与切割深度关系研究
[J].
DOI:10.11821/yj1998030008
[本文引用: 1]
主要探讨了在流域地貌演化的不同阶段,沟壑密度与切割深度的复杂关系,建立了沟壑密度随切割深度变化的理论极值模型及相应阶段的函数,补充了各演化阶段地貌形态要素的定量、定性描述;反之,可用沟壑密度与切割深度的关系推断流域地貌的演化阶段。
The research on the relation between gullydensity and cutting depth in defferent drainage landform evolution periods
DOI:10.11821/yj1998030008
[本文引用: 1]
According to the geographical cycle theory, drainage landform evolution process is divied into three periods—young, mature and old period. In defferent evolution periods, the relation between gully density and cutting depth is various. However, it is sure that landforms are the most tattered and gully density reaches the maximum in the later young—early mature period. By presuming that the drainage landform is evoluted into hills in the period, the maths equation of the theoretical maximum of gully density was established, which is <i>D</i>=ctg<i>θ<sup>h</sup>∫<sub>h</sub><sub>0</sub><sup>max</sup></i>d<i>h</i>/(<i>h</i>ctg<i>a</i>+c)<sup>2</sup> (1) where:<i>D</i>: gully density;<i>θ</i>: slope;<i>h</i>: cutting depth;<i>c</i>: gully bed average width;<i>h</i><sub>0</sub>: cutting depth minimum;<i>h</i><sub>max</sub>: cutting depth maximum On the above presuming base, the maths function on relation between gully density and cutting depth were established for the defferent development periods. The maths function shows that:①in the early young period, the gully density and cutting depth increase at the same time; ②in the later young—early mature preiod, gully density reaches the maximum and it decreases as cutting depth imcreases; ③ in the later mature—old preiod, gully density decreases as cutting depth decreases. Two example calculations demonstrate that the maths equation of the theoretical maximum of gully density may be used in practice. It can infer drainage landform evolution period and predict soil erosion developing tendency. It supplements quantitative anslysis on landforms shape elements with drainage landform evolution in defferent periods.
陕北黄土丘陵沟壑区地形因子与水土流失的相关性分析
[J].
Correlations between topographical factors and soil and water loss in hilly and gully area of Loess Plateau in Northern Shaanxi
地形因子对喀斯特地貌坡面水土流失影响的机理研究
[J].
Mechanism study on effects of terrain erosion of Karst slope
Time, space, and causality in geomorphology
[J].DOI:10.2475/ajs.263.2.110 URL [本文引用: 2]
地貌发育演化研究的空代时理论与方法
[J].
DOI:10.11821/dlxb201701008
[本文引用: 2]
地貌的发育在特定的条件下往往呈现空间分布上由“新”至“老”的过渡,据此,对地貌类型与特征在空间上的序列采样,即可为研究某种地貌的个体发育提供基本依据。该方法即为地貌学研究中的空代时。本文首先介绍了空代时方法产生的背景与基本概念。分析了近年来空代时方法应用于河流地貌、构造地貌、河口海岸地貌等不同地貌类型演化过程的研究进展。在此基础上,明确了空代时方法在地貌学研究中的适用条件、影响因素及分类体系,并提出了地貌学空代时的研究范式。本文认为今后的研究工作一方面应充分利用海量的地理空间数据,运用空代时方法研究多种空间尺度下的地貌演化的问题;另一方面,应结合现有的物理机制和统计规律,构建集形、数、理一体化的地貌演化模型。
Theories and methods of space-for-time substitution in geomorphology
DOI:10.11821/dlxb201701008
[本文引用: 2]
Geomorphic evolution often presents a spatial pattern of a "young to old" distribution under certain natural environment condition, whereby sampling the geomorphic types and characteristics in spatial sequence can provide some evidence for the evolution of the individual geomorphologic object. This so-called space-for-time substitution has been a methodology in geomorphology research. This paper firstly introduced the basic concepts and background of space-for-time substitution, then a full review has been conducted of recent research progress in geomorphic evolution based on space-for-time substitution, such as fluvial landform, structural landform, estuarine landform and coastal landform. Finally, the explicit terms like suitable conditions, influencing factors and classifications have been summarized so that the research paradigm of space-for-time substitution was proposed. We argued that in the future, the researchers should focus on a full use of massive geographic data for geomorphic evolution research at multi-spatial scales, as well as an effective combination with physical mechanisms and statistical laws for a comprehensive geomorphic evolution modelling.
中国陆地1∶100万数字地貌分类体系研究
[J].地貌分类体系是地貌图研制的关键之一,本文在总结国内外地貌及分类研究的基础上,借鉴20世纪80年代的中国1∶100万地貌图制图规范,基于遥感影像、数字高程模型和计算机自动制图等技术条件,归纳总结了数字地貌分类过程中应遵循的几大原则,分析了它们之间的相互关系,讨论了数字地貌分类的各种指标:包括形态、成因、物质组成和年龄等,提出了中国陆地1∶100万数字地貌三等六级七层的数值分类方法,扩展了以多边形图斑反映形态成因类型,以点、线、面图斑共同反映形态结构类型的数字地貌数据组织方式,并详细划分了各成因类型的不同层次、不同级别的地貌类型。中国1∶100万数字地貌分类体系的研究,为遥感等多源数据的陆地地貌解析和制图提供了规范,也为《中华人民共和国地貌图集》的编制奠定了基础,同时为全国大、中比例尺地貌图的分类和编制研究提供了借鉴。
Research on the classification system of digital land geomorphology of 1:1000000 in China
DOI:10.3724/SP.J.1047.2009.00707 URL [本文引用: 1]
基于DEM数字河网提取时集水面积阈值与河源密度关系的研究
[J].
DOI:10.12082/dqxxkx.2018.180109
[本文引用: 1]
以研究区3030个流域水文数据为基础,利用数字高程模型(DEM)并运用非线性拟合法分析中小流域集水面积阈值与河源密度的相关关系,分析集水面积阈值与河源密度的幂函数关系可得,幂指数a近似为-1,拟合公式常系数k具有区域分布特征,反映了不同地区的河网发育程度,k值越大,河源密度越大,河网越密集,河网发育程度越高。对河源密度随集水面积阈值的变化趋势进行分析,发现2个具有统计意义的阈值临界点,分别为河源从坡面到沟道及从沟道到河道的集水面积分界点,在研究区内选择不同k值区间的贡曲流域、辰清河流域和藤条江流域作为样本流域,利用样本流域数字正射影像(DOM)手工提取其沟谷河网及主河道河网的图形信息和水文信息,并与分界点处阈值提取的河网作对比,将分析得出的河网密度相对误差率作为检验标准,对临界点的物理意义进行检验。
The relationship between the threshold of catchment area for extraction of digital river network from DEM and the river source density
基于DEM的典型地貌区河流形态特征分析
[J].
Research on river morphology characteristics in typical geomorphologic areas based on DEM.
沟沿线约束的黄土水蚀性沟谷提取
[J].
Loess shoulder-line constrained method for waterworn gullies extraction on Loess Plateau
基于DEM的黄土地貌逼近度因子构建及特征分析
[J].
DOI:10.12082/dqxxkx.2020.190495
[本文引用: 1]
沟谷源点作为沟沿线上最为活跃的部位,其分别到上游分水线、下游沟谷线的流线空间比对关系,是表征三线空间结构的重要突破口。它在空间上向流域分水线逼近的程度,是量化黄土流域地貌系统发育程度的重要切入点。为探究黄土地貌区流域沟谷源点向流域分水线逼近的程度,揭示黄土流域地貌发育进程及该进程所表现的主要侵蚀方式,本文从水平和垂直2个维度,构建量化三线空间结构关系的核心因子——逼近度(PI),其中包括水平逼近度(HPI)和垂直逼近度(VPI),基于5 m分辨率数字高程模型,在陕北黄土高原遴选了包含16种地貌类型的42个样区,利用数字地形分析方法,探讨其平均值(MHPI, MVPI)的空间分异规律。另外,选择其中南北序列分别代表黄土塬、残塬、梁状丘陵沟壑和峁状丘陵沟壑区的淳化、宜君、甘泉和绥德4个地区,完备包含一至五级别沟谷的典型流域为重点实验样区,探讨陕北黄土高原流域尺度平均逼近度变异指数(MPIV)序列性特征。实验结果表明:① 陕北黄土高原平均逼近度(MPI)存在强烈的空间自相关,MHPI在南北序列上先增大后减小,东西方向上逐渐减小,在黄河沿岸峡谷丘陵区MHPI达到最大;MVPI由西南—东北先减小后增加,由西北—东南逐渐减小,在渭北黄土台塬区达到最小;② 在流域尺度上,MPIV值的正负与黄土塬区、丘陵沟壑区敏感相关;③ 4个重点样区MHPI、MVPI与其它地形因子存在南北序列上的一致性。104个外部汇流区平均水平逼近度与平均坡度相关性较好(P=0.43, aP=0.75, a
Establishment and feature analysis of loess geomorphology proximity indexes based on DEM.
基于DEM的黄土高原面积高程积分研究
[J].面积高程积分(Hypsometric Integral, HI) 是通过统计流域地表的高程组合信息,从而揭示流域地貌形态与发育特征的重要指标。本文以1:10000 比例尺5 m分辨率DEM数据分析流域面积高程积分计算时的影响因素,以SRTM数字高程模型数据为基本信息源,研究黄土高原重点水土流失区的面积高程积分空间分异特征。研究工作首先讨论并总结了面积高程积分的地学含义,明确了DEM分辨率以及分析面积对于面积高程积分计算的影响,并分析各地貌对象面积高程积分的相关性;然后,面向黄土高原重点水土流失区,采用面向多尺度分割的方法,基于小流域面积高程积分,实现了黄土高原重点水土流失区地貌分区。研究结果表明,DEM分辨率对于小流域面积高程积分计算影响较小,当小流域面积阈值达到10 km<sup>2</sup>时,面积高程积分趋于稳定;各地貌对象中,流域面—正地形—沟沿线、山顶点—山脊线—流域边界这两组组内面积高程积分值相关性非常强;基于面积高程积分的地貌分区,与黄土高原地区水土流失分区图和输沙模数分区图具有相当程度的耦合关系,并细化了原有分区结果。
Spatial variation of hypsometric integral in the Loess Plateau based on DEM.
Hypsometric integral is a terrain analysis factor with apparent physical and geomorphologic meanings which could reflect the landform erosion stage and evolution process. As a macroscopic parameter and method in terrain analysis, the applications of hypsometric integral could reveal the quantitative characteristic of landform evolution in catchment scale. In this paper, 5 m resolution DEMs and 3 arc-second resolution SRTM DEMs are used respectively to identify the impact factors of HI and its spatial variation in the Loess Plateau. Firstly, the geomorphologic meaning is discussed and summarized. The effect of DEM resolution and the analysis area in HI calculating is probed. With different DEM resolutions, the HI values derived could keep almost the same. When the area of catchment reaches 10 km<sup>2</sup>, the HI tends to be stable, which is regarded as a critical area for extracting HI in this study. Then, the geomorphic feature HI is proposed and the correlation of each kind of HI is calculated. There exist two feature groups in which the correlation coefficient is rather large. They are respectively catchment HI, positive terrain HI, shoulder line HI and peak HI, ridge line HI, and catchment boundary HI. Finally, the landform division based on HI is created through multiresolution segmentation in loess area. The coupling relationships exist in this division and water & soil loss map, sediment transport value map. The division in this paper refines the original map to a certain extent.
