史舟 , 徐冬云
, 徐冬云
SHI Zhou, XU Dongyun
收稿日期: 2017-12-19
修回日期: 2018-01-14
网络出版日期: 2018-01-28
版权声明: 2018 地理科学进展 《地理科学进展》杂志 版权所有
基金资助:
作者简介:
作者简介:史舟(1970-),男,教授,博士生导师,主要从事农业遥感与信息技术方面的研究,E-mail: shizhou@zju.edu.cn。
展开
摘要
土壤作为自然地理学的重要研究对象之一,是联系大气、水、生物等其它地理要素的重要枢纽,其信息的快速准确获取研究对现代地理学的发展具有重要意义。本文重点介绍卫星、航空、无人机和地面不同平台搭载的不同类型传感器的探测原理;总结国内外基于星地传感技术的土壤信息快速获取方法及其在土壤属性预测和制图中的应用;阐述现代土壤信息获取在土壤地理学中的应用情况;展望当前土壤星地传感器技术的发展趋势。
关键词:
Abstract
Soil as an important study object of physical geography, acts as the essential link between geographical elements such as water, atmosphere, organisms, and so on. Therefore, research on accurate and efficient acquisition of soil information has great significance in the development of modern geography. In this article, the operation principles of various sensors equipped on satellite, aviation, and unmanned aerial vehicle platforms and ground devices for soil information acquisition were introduced. Then the authors summed up the findings on the methods and techniques of rapid acquisition of soil information based on remote sensing and proximal soil sensing and their applications in soil mapping and soil attribute prediction. Applications of soil information acquisition in soil geography were also explained. Finally, this article discussed the prospect of development of remote and proximal soil sensing.
Keywords:
土壤是形态和演化过程都十分复杂的自然综合体,其形成和地理分布受气候、母质、生物、地形、时间和人类活动等因素的综合交互影响,形成不同空间尺度下土壤分布的地带性与空间异质性。因此,土壤地理学将正确描述和表征土壤分布与演变过程作为其重要研究内容之一,同时将土壤信息获取和动态监测作为重要的基础支撑。
传统土壤信息获取是利用地面土壤取样和实验室化学分析,周期长、成本高、过程复杂、实时性差。受野外调查成本和实际分析样本数量的限制,很难进行大范围土壤信息的重复调查。因此,早在20世纪初,英国洛桑试验站的土壤学家就萌发土壤传感器的想法,设计与开发了第一代土壤信息快速采集器Dynamometer(Keen et al, 1925),并随后投入商用。该设备利用压力杠杆来测试土壤机械紧实度(传感器原型),用发报机的莫尔斯码来连续记录数据(数据采集终端的原型),用石膏模型来表达土壤机械紧实度的空间异质性(计算机数字制图的原型)。同时,美国首先利用航空像片为辅助资料进行土壤调查,1938年推广到全美各州(Bushnell, 1929)。不难理解,靠脚步绘出土壤图的传统土壤地理学家,是多么迫切需要引入新技术、新方法。
经过近一个世纪的发展,包括卫星与航空遥感、近地传感在内的星地传感技术蓬勃发展,其研究成果不断涌现(图1),特别是20世纪80年代后有关土壤遥感与近地传感的研究论文快速增长。其中,土壤近地传感主要是利用田间传感器来获取土壤近地面或土体内信息(Viscarra Rossel et al, 1998)。早在1920's出现了机械式传感器;1960's出现了土壤光谱与X射线荧光光谱技术(X-ray Fluorescence Spectroscopy, XRF)的研究与应用(Bowers et al, 1965; Ristori et al, 1969);1970's出现了土壤电磁感应技术(Electromagnetic Induction, EMI) (Dejong et al, 1979);1990's激光诱导击穿技术(Laser Induced Breakdown Spectroscopy, LIBS)用于土壤微量污染分析(Ciucci et al, 1996)。特别是可见—近红外光谱技术发展迅速。2008年,澳大利亚Raphael牵头建立全球土壤光谱库,目前各国都在开展国家尺度的土壤光谱库建设。同时随着现代材料、电子、计算机等技术的快速发展,土壤近地传感器研发成为土壤科学界和国际大型农业装备公司的研究热点。
土壤航空光学遥感在20世纪20年代就出现。1969年,Macdonald等(1971)利用航空成像雷达进行土壤湿度监测试验。随着1972年世界第一颗资源卫星发射成功,卫星遥感开始用于大面积土壤调查。进入21世纪,无人机遥感(Unmanned Aerial Vehicle, UAV)技术快速发展,已应用于田间尺度的高分辨率土壤调查与制图(图1)。
星地传感技术通过搭载在不同平台(图2)上的传感器获取并提供特定空间和时间范围的观测值。平台属性对遥感数据的时间分辨率、空间分辨率和可搭载传感器类型密切相关,因而对遥感信息的获取有至关重要的影响。通常按照平台不同可以分为卫星、航空、无人机和地面。卫星平台一般在80 km以上,航空平台一般指80 km以下的飞机和气球,无人机平台即无人驾驶有动力飞行器,地面包括野外静态和车载动态测量两种。部分传感器如光谱成像仪、雷达传感器适用于多种平台;部分传感器如电磁感应等仅适用于地面。不同平台获取数据的空间和时间分辨率、覆盖面积等差异明显。如卫星遥感有亚米级的高分辨率(Wordview-3、Quickbird-2等)到10~100 m的中分辨率(Landsat-8等)到大于100 m的低分辨率(Terra的MODIS等),可以满足土壤信息获取从田间小尺度、到区域甚至全球大尺度的要求。航空遥感的应用早于卫星遥感,其空间精度一般在米级以下,可以搭载卫星上各类传感器,同时可以搭载LiDAR、伽马射线等无法在卫星平台上实现的传感器。无人机平台是近年来兴起的新遥感信息获取系统,它以无人驾驶飞行器为载体,通过搭载雷达扫描仪、光谱成像仪等获取数据。无人机遥感由于其传感器离地面更近,因此一般能获取10 cm以下的高分辨率影像。由于土壤经常被地面植被所覆盖,因此卫星遥感多用于大面积退化土壤、障碍性土壤或农闲裸土的直接探测,或提供成土因素相关信息来辅助土壤制图和监测。航空遥感与无人机遥感具有飞行轨迹和时间的灵活性,可利用轮作间隙探测土壤信息。地面的平台可以搭载各类传感器,利用多传感器的数据融合,来进行土壤各种属性的探测,但是作业面积相对有限。
土壤星地探测器按照原理不同可分为电与电磁型、光学与辐射型、机械式型、电化学型等种类。目前卫星和航空遥感搭载的传感器主要是基于光学与辐射型,有可见—近红外—热红外光谱,以及主被动雷达方式。地面传感包括这4类方式,有地面光谱仪,也有电磁感应的大地电导仪,以及探地雷达、土壤紧实度仪和电化学传感器(表1)。
表1 不同类型土壤传感器的测试指标和代表性传感器设备
Tab.1 Working ranges and representative instruments of different types of soil sensors
| 传感器类型 | 测量指标 | 平台 | 传感器设备 |
|---|---|---|---|
| 光学与辐射型 | 质地、有机质、CEC、pH,水分、盐分、温度、土壤 粗糙度、矿物等 | 卫星、航空、 近地 | 光学遥感、微波遥感 地面光谱仪、探地雷达、激光诱导光谱等 |
| 电与电磁型 | 质地、有机质、盐分、水分等 | 近地 | 大地电导率仪、Veris3100、时域反射仪、频谱反射仪 |
| 机械式型 | 紧实度、耐旱力、水分等 | 近地 | 指针式土壤紧实度仪 |
| 电化学型 | pH、硝酸盐、营养元素等 | 近地 | pH计、离子敏感晶体管传感器 |
光学和辐射测量型传感器主要利用电磁能所表现出的特征对土壤特性进行分析。电磁波产生于原子内部运动的电子发生运动轨迹的变化、电子和核子跃迁。不同的物质,其原子内部电子的运动情况不同,电子和核子跃迁所需要的能量也不相同。能量等级与光波的波长、频率相关,因此当不同波段的光波作用于土壤样本的时候,就会产生不同的光谱特征。这类传感器具有非接触性、不受电子干扰、灵敏度高等有别于其他传统传感器的显著特点,可用于土壤有机质、全氮、粘土矿物、氧化铁等属性的探测。
电与电磁型传感器主要利用电流的变化测量土壤颗粒导电或者积累电荷的能力,当仪器接近或侵入土体时,土壤就成为电磁系统中的一部分,当地理位置发生变化的时候,由于天然物理和化学性质在空间上的变异,反馈电压或者电流也会相应地瞬时发生变化。目前这种类型的传感器主要是用于土壤盐分、土壤黏粒含量、黏土层埋深、土壤养分、土壤水分等土壤属性指标的测量分析。典型的仪器主要有EM38、Veris3100,二者均利用电流通过传感器后端的发射线圈产生随时间变化的动态原生磁场,在大地中诱导产生微弱的电涡流,进而诱导产生次生磁场。仪器前端的信号接收线圈同时接收原生磁场和次生磁场的信息,通过测量二者之间的相对关系来测量土壤的电导率。这种利用电磁感应技术进行土壤测量具有快速、实时性、成本较低等优点,能实现田间尺度的土壤电导率快速扫描成图。
机械式传感器主要利用压力杠杆等来估测土壤的机械阻抗,建立与土壤紧实度、土壤耐旱力、土壤水分分布等关系。这类传感器结合其他类型的传感器可进行土壤属性的测量和数字制图。电化学型传感器是以离子导电为基础制成,主要使用的是离子选择电极(ISEs)和离子敏感场效应晶体管 (ISFETs)两种技术,用于土壤pH值、硝酸盐、钾离子等测定。但是目前这类设备的野外快速探测方面还不够成熟。
土壤光谱中包含了大量的分子及化学组分信息,土壤组分不同,各组分的跃迁能级差不同,使土壤吸收光谱曲线存在不同的吸收特征波段,以此来定量分析土壤组分含量。红外光谱主要是基于分子振动的倍频或合频吸收,包括C-H,N-H,O-H等相对轻原子基团,有机物质中的C-O,C-N,N-O,C-C“重”原子基团,以及矿物中的Al-O,Fe-O,Si-O基团。相对轻原子基团的合频和倍频振动主要发生在NIR(700 nm-2500 nm),而“重”原子基团主要位于MIR波段(2500 nm-25000 nm),可见光波段主要是产生电子吸收光谱(400 nm-700 nm) (Kuang et al, 2012; Nocita et al, 2015; Xu et al, 2018)。
目前,土壤光谱探测技术主要开展数据预处理与预测模型的研究。数据预处理主要是针对野外土壤光谱受到各种环境因素以及土壤本身的差异(土壤水分含量、土壤颗粒大小等)的影响,目前国际上主要提出以下3类方法:一是利用室内外干湿样光谱对比,采用外部参数正交化法(External Parameter Orthogonalization, EPO)、直接标准化法(Direct Standardization, DS)、分段直接标准化法(Piecewise Direct Standardization, PDS)等方法直接进行光谱曲线的转换((Minasny et al, 2011; Ji et al, 2015; Liu, Pan, Wang, et al, 2015; Wang et al, 2016);二是采用“Spiking”,从预测样本中挑选有代表性的子集并入建模样本,从而提高模型对预测样本的预测精度(Guerrero et al, 2010);三是通过导数等预处理来提高野外光谱预测精度(Wu et al, 2009)。
土壤光谱预测模型方法主要包括各类线性模型,如多元线性回归、主成分回归、偏最小二乘回归、回归树等(Chang et al, 2001; 史舟, 王乾龙, 等, 2014)以及非线性模型,如支持向量机、Cubist、随机森林、人工神经网络、局部加权回归等方法(Viscarra Rossel et al, 2010; 纪文君等, 2012; 陈颂超等, 2015)。
由于不同区域土壤类型多样,成土因素复杂,造成不同类型土壤的波谱特性和预测模型的差异很大,因此国际上致力于国家尺度乃至全球尺度对不同类型土壤进行大样品的测试分析,建立相应的波谱数据库,来全面评价土壤电磁波谱特性和预测能力。
全球尺度的土壤光谱库建设始于2006年,由美国国家土壤调查中心Brown牵头收集全球的土壤样本,共4184土壤样品(Brown et al, 2006)。2008年开始,由澳大利亚联邦科学与工业研究组织的Viscarra Rossel 组织35个大学和研究所收集了7大洲23631个土壤样本(Viscarra Rossel et al, 2016)。
此外,在洲和国家尺度上也建有相应的土壤光谱库。如欧洲土壤光谱库(LUCAS)包括了覆盖了整个欧洲的20000个土壤样本(Stevens et al, 2013)。美国采集了32084个土壤剖面共144833条光谱数据(USDA, 2013),澳大利亚收集了4000个土壤剖面共21500条光谱数据(Viscarra Rossel et al, 2012)。此外,如法国(Gogéet al, 2012)、丹麦 (Knadel et al, 2012)、巴西(Terra et al, 2015)、中国(史舟等, 2014)也都建立了土壤光谱库。
自20世纪60年代起,研究者对土壤室内vis-NIR光谱做了大量研究,成功预测了有机碳、有机质、全氮含量,机械组成(粘土含量、砂粒含量、粉砂粒含量)、pH值、电导率、CEC等土壤属性状况(Chang et al, 2001; Viscarra Rossel et al, 2006; Stenberg et al, 2010; 史舟, 王乾龙, 等, 2014)。
近20年来,国内外对野外土壤光谱的研究也逐渐增多,包括静态的野外原位光谱测量(“In Situ”) 和动态实时测量(“On-The-Go”)。野外光谱的前期研究主要应用于土壤属性的快速预测(Shonk et al, 1991; Mouazen et al, 2005; Stevens et al, 2008)。随着土壤信息快速获取和数字化制图技术的发展,利用“On-The-Go”技术,结合野外原位测量光谱和其他传感器进行空间变异制图的研究越来越广泛。Christy(2008)设计了一款基于vis-NIR的移动式设备用来获取土壤信息并制图,其后被用于商业化发展;Muñoz等(2011)利用基于vis-NIR的移动平台结合地形因子与航片数据进行了土壤碳制图。同时,野外光谱用于土壤剖面属性预测的研究增多,如Li S等(2015)发明了野外测试土柱高光谱的装置,进行剖面土壤有机碳含量预测并取得了较好的结果。近年来,研究与开发各类土壤信息多源获取集成平台成为热点。如澳大利亚CSIRO研发的利用EM、vis-NIR、γ射线等多传感联合装置用于测试农田土壤有机碳含量(Viscarra Rossel et al, 2017);美国Veris公司开发集成的pH电化学测试仪、vis-NIR和EC传感器于一体的商业化MSPS、P4000平台等。此外,光谱在土壤污染检测方面也有一定的应用(Horta et al, 2015),Shi T C等(2014)通过植被光谱对土壤中的砷含量进行了预测;Chakraborty等(2015)利用vis-NIR光谱结合XRF对土壤石油污染进行了预测,证明加入vis-NIR光谱能提高石油污染的预测效果。
自19世纪20年代开始,航空相片用于土壤调查(Bushnell, 1929)。当时的航空作为传统人工绘制地图的一种数据源,统计和数学方法并未用于联系遥感数据和土壤的关系。遥感数据既可直接探测农闲裸土或退化土壤的信息,同时也可作为辅助数据通过建立土壤—景观模型进行土壤信息的预测。Kristof等(1973)首次将统计推断应用于土壤属性与光谱关系的表征。Moore等(1993)在空间上首次将一系列基于遥感的地形数据用于土壤厚度等属性制图,此后,遥感数据被广泛应用于土壤类型制图与土壤属性预测。
(1) 土壤类型遥感制图。土壤类型综合了土壤的发育及自身特性。遥感信息无法提供复杂的土壤发生信息,因而无法作为土壤类型分类的直接信息源。早期人工借助遥感底图进行土壤类型解译与判别,形成不同比例尺的土壤类型图(王人潮等, 1985)。遥感信息也可作为专家知识判断土壤类型的辅助数据,提供被判断土壤的植被、地形、气候等景观环境信息(Skidmore et al, 1996; 亢庆等, 2008)。而随着数字制图技术的发展,遥感数据更多地作为环境协变量,使用分类树或决策树等数据挖掘方法对区域进行土壤类型制图判断(Hahn et al, 2008; Nanni et al, 2012)。
(2) 土壤属性遥感预测。遥感信息被广泛地应用于土壤有机碳、土壤水分、土壤矿物质等关键属性的预测与制图(Grunwald et al, 2015)。部分土壤属性,如土壤有机碳、土壤矿物、土壤质地、碳酸盐等,在可见—近红外特定波段有特征波谱,可通过获取裸土遥感数据的光谱信息直接进行反演(Mulder et al, 2011),这些研究大部分是在小尺度区域内的裸土上进行(Kruse et al, 2003; Gomez et al, 2008)。当研究扩展到区域尺度以上,简单地通过光谱信息进行反演就不能满足预测的精度要求。一是由于大范围内,非土壤光谱信息,如植被等会影响属性的预测;二是随着范围的增加,通常伴随有复杂的地形,影响光谱特征的因素增加,土壤属性与光谱不再有简单的线性关系。因而,研究者们通过建立遥感获取环境信息与土壤属性建立关系,来进行土壤属性预测。此时遥感已不是获取土壤属性的直接来源,而是为土壤—景观模型提供环境变量。如植被指数、降雨、温度等气候信息、地形等 (Minasny et al, 2016)。由于土壤属性异质性的主控环境因子在田间、区域、全球尺度下都不尽相同 (O'Rourke et al, 2015),而多平台的遥感信息可满足在不同尺度下为土壤属性的预测提供不同比例尺的信息(Miller et al, 2015)。现在通过建立土壤—景观模型已成为土壤属性制图的主流,广泛地用于土壤有机碳等关键属性的区域、国家和全球尺度的预测(Viscarra Rossel et al, 2014; Hengl et al, 2015)。此外,近年来还探索了一些新的数据处理方法用于消除植被覆盖的影响,特别是利用残余土壤光谱 (Bartholomeus et al, 2011)、盲源分离法(Ouerghemmi et al, 2011)以及非负矩阵分解法(Liu, Pan, Shi, et al, 2015)等混合光谱分解算法,分离出土壤光谱再用于土壤属性预测,提高了预测精度,这种新的技术路线将有利于开展中低植被覆盖下区域土壤属性的预测及制图。
(3) 土壤退化遥感监测。土壤退化遥感监测主要包括土壤盐碱化、土壤流失和土壤污染等。土壤盐碱化主要发生在干旱—半干旱区,与土壤水分及盐分矿物息息相关。虽然导致盐化的主要成分NaCl在vis-NIR没有光谱特征,但是在某些区域NaCl与石膏具有相关性,而石膏在1500, 1750, 1950和2340 nm具有吸收特征,因此,仍可利用vis-NIR进行土壤盐分预测(Goldshleger et al, 2010)。前人研究还提出了一系列指数,如盐渍化指数(Salinity Index)、归一化盐渍化指数(Normalized Salinity Index)、冠层响应盐渍化指数(Canopy Response Salinity Index),可从HyMap、Landsat、Hyperion等遥感数据中提取,以表征土壤盐渍化程度(Jabbar et al, 2008; Melendez-Pastor et al, 2010; Scudiero et al, 2015)。此外,在常用的土壤侵蚀方程,修正的风蚀方程(RWEQ)和修正通用流失方程(RUSLE)中重要的因子,如植被指数、地表粗糙度、降水、地形等,也都可通过遥感数据直接或者间接获取(Zhou et al, 2015; Teng et al, 2016)。遥感在土壤污染监测方面的应用研究相对较少。部分学者试图通过建立遥感光谱信息与土壤重金属含量的联系来进行土壤污染研究(Wu et al, 2005; Zhao et al, 2010),目前仅在工矿区重度污染场地的监测有初步的应用。
微波遥感的理论基础是土壤介电特性与土壤水分密切相关,因而微波遥感主要应用于土壤水分监测及与水分相关的土壤盐分和干旱度的监测。微波遥感分为主动获取与被动获取2种方式。被动微波遥感主要特性是不受云层、天气和日照条件的限制,对土壤水分响应高,但空间分辨率低(Moran et al, 2004)。主动微波遥感有更高的空间分辨率,但其反射信息对地表起伏和植被响应敏感,反演土壤水分时需考虑更多的地表信息(Petropoulos et al, 2015)。因此多种土壤水分模型应运而生,如土壤水分反演模型(考虑土壤粗糙度)包括半经验模型(Wang et al, 1981; Oh et al, 1992)、理论模型(Fung et al, 1992; Chen et al, 2003)和参数化模型(Shi et al, 1997, 2005; Zhao et al, 2015)。
被动微波遥感在水分反演上比主动微波遥感更具优势(Petropoulos et al, 2015)。自1978年开始,一些被动遥感的卫星已经发射并应用于监测土壤水分。其中主要的卫星微波遥感土壤水分产品有2006年发射的ASCAT(Advanced Scattermeter)、2002年发射的AMSR-E(Advanced Microwave Scanning Radiometer for EOS)、2009年发射的SMOS(Soil Moisture and Ocean Salinity)以及2015年发射的SMAP(Soil Moisture Active Passive)。其中,SMOS和SMAP传感器采用对植被覆盖穿透性更强的L波段,对地面水分的反演精度更高。SMOS采用被动微波传感器,其空间分辨率在35 km;SMAP同时包括主动和被动微波,空间分辨率在3 km-40 km之间(Petropoulos et al, 2015)。这两个数据产品由于全球尺度的要求及微波遥感自身特点,空间分辨率低。为获取更高质量的土壤水分数据,很多研究聚焦于数据融合,包括主动遥感与被动遥感的融合(Shi J C, et al, 2014)、微波遥感与光谱遥感的结合(Piles et al, 2014; Colliander et al, 2017)。多数据的融合既提高了土壤水分反演的精度,也提高了土壤水分数据的空间分辨率以满足不同尺度研究的需求。主被动遥感的融合优势可在统一平台装载2个传感器获取相同时相的主被动遥感数据,从而提高土壤水分反演的精度及空间分辨率。光谱遥感的优势是可提供更多的数据选择,如地表温度、植被类型及更高的空间分辨率(Petropoulos et al, 2015)。
通过微波遥感获取的介电常数受水分的影响最大,相对而言,通过微波遥感进行土壤盐渍化的研究较少。然而实验证实虽然介电常数的虚部与土壤含盐量无显著的相关性,但是虚部与土壤的盐分含量相关;当含水量一定的时候,盐度的增加会使得介电常数变大,且与土壤碱化无关(Jackson et al, 1987; 邵芸等, 2002)。根据这一特性,微波遥感在土壤盐渍化的应用中主要包括盐渍化土壤的识别与分类 (Metternicht, 1998; Li et al, 2014),以及土壤盐分含量的制图研究 (Bell et al, 2001; Shrestha, 2006)。
探地雷达(Ground Penetrating Radar, GPR)是以探察地下不同介质的电磁性质(介电常数、电导率、磁导率)的差异为物理前提的一种射频(0.10 GHz-3 GHz)电磁技术,浅表地球物理科学技术中的一项重要手段,在工程检测、环境保护、资源勘探、水文水利等科学技术领域中发挥着其他手段无法取代的重要作用。Huisman等(2003)综述了利用GPR检测土壤水分的四种方法。Minet等(2012)利用GPR进行了田间尺度土壤水分制图分析;Tran等(2015)利用探地雷达与频域反射数据联合分析方法对坡面土壤水分高分辨率时空特征进行了定量研究。刘恒柏等(2008)对探地雷达技术在土壤剖面特征探测和土壤含水量测定方面的应用展开了研究;崔凡等 (2014)利用探地雷达对砂壤进行探测并建立了砂壤物理模型,实现了砂壤含水率和紧实度的准确、连续观测。王瑞燕等(2017)探讨分析了利用低频探地雷达技术探测土壤累积入渗量的方法,并得出使用低频探地雷达可实现对土壤累积入渗量的准确探测。胡振琪等利用探地雷达对复垦土壤的分层结构进行了探测(胡振琪等, 2005; 刘宁等, 2016)。此外,也有学者利用探地雷达回波信号进行土壤污染物含量检测(侯晓冬等, 2008),但目前这方面研究还比较少。
电磁感应技术(EMI)主要用于土壤水分、盐分及黏粒等的监测,特别是在土壤盐分快速监测方面有独特优势(Doolittle et al, 2014; Shanahan et al, 2015; Li et al, 2013; Li H Y, 2015)。早期研究主要是对土壤水分及盐分的二维分析及制图,如Martínez等(2010)利用EMI进行了田间尺度水分含量制图分析。但单纯监测土壤表层盐分很难满足盐碱地改良和利用的要求,要达到排盐、减盐的目的,必须掌握土壤整个剖面的盐分含量情况。李洪义等 (2010)利用EM38在地表不同高度测量的土壤表征电导率ECa值,结合EM38电导率线性响应模型和Tikhonov正则化预测了土壤剖面电导率,首次实现了土壤盐分的三维制图分析;Huang等(2015)利用EM38对坡面土壤盐分进行了不同深度的制图分析。
X射线荧光光谱分析仪(XRF)和激光等离子体光谱分析仪(LIBS),主要应用于土壤重金属含量的测量(Scheinost et al, 2002; El Haddad et al, 2013; Hu et al, 2017)。O'Rourke等(2016)基于vis-NIR,mid-IR以及XRF利用模型平均的方法对土壤多种元素进行了分析研究。Kim等(2014)利用LIBS对不同类型土壤Zn污染进行插值分析。冉景(2014)对比研究了PXRF与原子吸收荧光法(AAS)来测定土壤重金属的含量,表明XRF适用于土壤重金属含量的快速测量与评价;余克强等(2017)利用LIBS对土壤中的Al,Fe,Mg等多种元素进行了分析。
除上述探测技术外,机械式传感器也广泛应用于土壤信息获取,主要是结合其它传感器进行土壤属性测量及数字制图等(Grunwald et al, 2001; Quraishi et al, 2013)。
地理学综合研究是对地球表层系统(水圈、土壤圈、大气圈、生物圈)的相互作用以及人地关系的研究(傅伯杰,2014)。其中,土壤圈作为地球表面最重要的圈层系统,是水圈、大气圈和生物圈共同作用的产物,并且维系着全球地表生物圈的存在。土壤地理学旨在理解与回答诸如“土壤是什么”,“为什么是这样”,以及“如何演变成这样等问题”,即研究土壤形态特征、物理化学性质、土壤的形成机理和演变过程、未来土壤变化预测、土壤系统分类、土壤景观信息等 (张甘霖等, 2008)。
(1) 土壤信息与土壤空间表征土壤的形成演变形式繁多,演变过程与成土过程的发展及环境因素的变化(如气候和地形等)密切相关。研究土壤属性特征和时空演变信息,能为合理规划和配置利用土壤资源提供基础信息,并作为评价土壤圈与地表陆地系统之间的耦合关系提供最直接的依据。土壤信息能针对土壤地理格局进行大小、形状、数量、类型和空间组合上的描述,并且能反映出土壤地理格局的空间结构特征、地带性和非地带性规律,以及监测目标的尺度效应(O'Rourke et al, 2015; Zhou et al, 2016)。
(2) 土壤信息与土壤过程演变。土壤信息获取技术能发现和揭示土壤地理现象与过程中时空分布规律和变异性特征。此外,土壤信息获取技术能发现时空尺度上土壤景观及其相关驱动因子的演变规律。通过土壤信息获取技术,能对土壤元素运移、水分迁移、土壤退化、土壤与人类相互作用等等土壤地理过程进行监测和表达。并且通过土壤景观格局的动态变化和空间异质性,揭示土壤地理单元的时空关系及相应的演变过程。土壤信息获取技术能对由侵蚀过程引起的土壤碳迁移进行模拟(Chappell et al, 2016; Teng et al, 2016),还能通过对地表反射率或土壤水分变化过程的监测,对土壤机械组成进行反演分析(Liu et al, 2012; Zeng et al, 2017)。
(3) 土壤信息与地理模拟模型。在复杂多参数的全球生物地球化学模型中,土壤信息获取技术能为土壤的物理、化学、生物和矿物学过程提供相应的微观、动态、综合、定量的指标,从而参与到生物地球化学模型当中。尤其是在刻画与勾勒C、N、P、S等与生命过程和全球变化密切相关的元素循环中,土壤信息获取技术发挥了重要的作用,得到了地理学界的广泛应用(Goglio et al, 2014; Ito et al, 2017)。
(4) 土壤信息与数字土壤制图。土壤制图是土壤地理的主要内容之一,传统的土壤制图主要是进行土壤理化性质、肥力、类型等属性的地理空间分布表达。其成果主要表现为以多边形为基础的矢量表达形式,并服务于地球表层系统研究的各个关键环节。随着多源、多平台传感器的发展以及土壤地理信息的不断进步,数字土壤制图结合数据挖掘技术对大范围区域乃至洲际、全球尺度的土壤相关属性,及其在生物、气候、地形、母质等综合作用下的时空分布特征和推演过程进行模拟(Mulder et al, 2011; 周银等, 2015)。
土壤遥感与近地传感技术具有快速、实时、有效获取土壤属性信息,揭示土壤地理类型的复杂性、空间分布规律和非规律性、时空异质性等特点,已广泛应用于各尺度范围的土壤制图、水土过程模拟、地球生物化学模型中,成为土壤地理学研究中非常重要的一种信息获取手段。综合国家战略和土壤地理学发展规划,土壤遥感与近地传感技术的未来发展趋势可归为以下4点:
(1) 发展土壤新型传感器综合平台,拓展土壤特性及其变化过程的长期动态监测。加强各类土壤光谱传感器向轻型化、便携式、高可靠性和商业化发展,拓展LIBS、电化学传感器走向野外。加强多卫星联网、多无人机协同监测和地面车载多传感集成平台的研发,实现对土壤关键属性及相关环境参数的长期全方位自动采集。搭建远程控制无线传感器及其节点和基站等立体综合监测设备,构建土壤—环境物联网监测体系。推进成果在耕地地力调查与监测、农田测土配方施肥、土壤环境监测网络、土壤碳库估算、典型生态脆弱区土壤退化的监测等方面的应用。
(2) 发展基于多源传感信息的土壤-景观知识模型,开展土壤数字综合制图研究。发挥土壤遥感和近地传感技术的优势,在传统土壤—景观知识框架下,利用土壤形成及演化相关地学背景信息,引入机器学习、人工智能等数据挖掘新技术,发展高精度数字制图模型,进行土壤类型和关键属性的快速更新制图,同时提供更多有关土壤质量、土壤功能等衍生数据产品,提高数字土壤地图产品的现势性、多样性和功能性。此外,发展虚拟现实建模技术,揭示三维乃至四维尺度上土壤属性的特征信息。促进中国土壤数字制图与全球土壤图协调发展,共同解决全球性问题,发挥土壤数字综合制图在土壤功能分析、土地管理、农田综合防治、粮食丰产增效等方面的作用。
(3) 发展全球尺度的地球观测系统,实现土壤圈与其他陆表圈层的联合观测与综合分析。基于主、被动遥感技术,发展全球尺度的土壤水分、地表温、粗糙度等信息的快速提取技术体系,实现与植被、水文、大气圈层的联合观测。并发展基于多传感技术的高分辨率地球系统模式,构建土壤关键属性信息与地球系统模式之间的多尺度、多物理耦合的协调同化方法,综合分析各圈层之间的相互作用关系及耦合循环的动力学过程,完善关键带(Critical Zone)观测体系,预测未来气候变化对土壤碳源汇强度及其它土壤环境关键属性的影响,为长期的全球变化影响与风险评估服务。
(4) 发展共建共享的土壤大数据平台,推进土壤信息化工程建设。基于现代数字地球建设框架,完善现有土壤遥感、近地传感和地面监测等途径,加强土壤重要参数的综合观测,发展土壤多源数据获取及同化核心技术,建成面向全国乃至全球的土壤大数据平台。加强数据标准体系建设,形成土壤大数据集成分析技术体系和关键属性共享数据集,提供土壤关键属性数据共建共享、在线分析和个性化以及可视化服务。推进土壤信息在粮食安全决策、生态环境保护及风险评估、全球变化和灾害应对、以及文化—自然遗产保护与发展等领域的应用,实现土壤信息化工程建设。
The authors have declared that no competing interests exist.
| [1] |
基于局部加权回归的土壤全氮含量可见-近红外光谱反演 [J].Vis-NIR spectral inversion for prediction of soil total nitrogen content in laboratory based on locally weighted regression [J]. |
| [2] |
探地雷达功率谱模型在砂壤含水率和紧实度探测中的应用 [J].
为了快速、高效地探测中国西部地区土地整治后砂壤的物理特性,该研究使用探地雷达对砂壤进行探测,利用自回归移动平均(auto regressive and moving average,ARMA)功率谱估计方法处理数据,建立砂壤物理模型,分析对比不同含水率和紧实度砂壤的功率谱分布特征,分别建立与含水率和紧实度具有最优拟合度的关系模型。结果表明:在频率670 MHz时,低频功率谱能量占全部功率谱能量比值(L/(H+L))与砂壤含水率相关性最强,相关系数达0.952;频率为1 000 MHz时,高频功率谱能量占全部功率谱能量比值(H/(H+L))与紧实度倒数的相关性最强,相关系数达到0.947。通过实际探测验证,该模型可以获得连续、准确、高效的砂壤含水率和紧实度数据,为土地整治工程的质量检测提供技术支持。
Application of ground penetrating radar power spectrum model in detection of water content and degrees of compactness in sandy loam [J].
为了快速、高效地探测中国西部地区土地整治后砂壤的物理特性,该研究使用探地雷达对砂壤进行探测,利用自回归移动平均(auto regressive and moving average,ARMA)功率谱估计方法处理数据,建立砂壤物理模型,分析对比不同含水率和紧实度砂壤的功率谱分布特征,分别建立与含水率和紧实度具有最优拟合度的关系模型。结果表明:在频率670 MHz时,低频功率谱能量占全部功率谱能量比值(L/(H+L))与砂壤含水率相关性最强,相关系数达0.952;频率为1 000 MHz时,高频功率谱能量占全部功率谱能量比值(H/(H+L))与紧实度倒数的相关性最强,相关系数达到0.947。通过实际探测验证,该模型可以获得连续、准确、高效的砂壤含水率和紧实度数据,为土地整治工程的质量检测提供技术支持。
|
| [3] |
地理学综合研究的途径与方法: 格局与过程耦合 [J].https://doi.org/10.11821/dlxb201408002 URL [本文引用: 1] 摘要
地理学是一门以综合性和区域性见长的学科。地理学的综合性通过要素多样化来体现,区域性则表现为区域分异或区域差异。地理学综合研究是对地球表层各要素的相互作用以及人地关系的研究,帮助我们认识地球表层系统的过去、现状和未来的趋势,把握其变化的脉搏。格局是认识世界的表观,过程是理解事物变化的机理,基于长期的野外观测和综合调查以及模型模拟,对不同时空尺度下的地理格局与过程进行耦合研究,是从机理上理解与解决地理学综合研究的有效途径与方法。文章结合在黄土高原地区的相关研究案例,探讨了将格局与过程耦合研究的地理学综合研究的途径与方法。
The integrated studies of geography: Coupling of patterns and processes [J].https://doi.org/10.11821/dlxb201408002 URL [本文引用: 1] 摘要
地理学是一门以综合性和区域性见长的学科。地理学的综合性通过要素多样化来体现,区域性则表现为区域分异或区域差异。地理学综合研究是对地球表层各要素的相互作用以及人地关系的研究,帮助我们认识地球表层系统的过去、现状和未来的趋势,把握其变化的脉搏。格局是认识世界的表观,过程是理解事物变化的机理,基于长期的野外观测和综合调查以及模型模拟,对不同时空尺度下的地理格局与过程进行耦合研究,是从机理上理解与解决地理学综合研究的有效途径与方法。文章结合在黄土高原地区的相关研究案例,探讨了将格局与过程耦合研究的地理学综合研究的途径与方法。
|
| [4] |
基于探地雷达回波信号获取污染土壤中污染物含量的研究进展 [J].
<FONT face=Verdana>从探地雷达GPR(Ground Penetrating Radar )在土壤污染探测中的应用、污染土壤介电常数模型的演化和土壤介电常数求取三方面综述了目前国内外学者利用探地雷达技术开展的土壤污染探测研究.研究认为以土壤介电常数为纽带,采用适宜的方法从雷达回波信号求得介电常数,基于合理的土壤介电常数模型,通过神经网络技术,可驯化建立介电常数和污染土壤多个参数之间联系,从而实现污染土壤中多种污染物含量的监测.</FONT>
Progress on detection of contamination content in the contaminated soilbased on ground penetrating radar [J].
<FONT face=Verdana>从探地雷达GPR(Ground Penetrating Radar )在土壤污染探测中的应用、污染土壤介电常数模型的演化和土壤介电常数求取三方面综述了目前国内外学者利用探地雷达技术开展的土壤污染探测研究.研究认为以土壤介电常数为纽带,采用适宜的方法从雷达回波信号求得介电常数,基于合理的土壤介电常数模型,通过神经网络技术,可驯化建立介电常数和污染土壤多个参数之间联系,从而实现污染土壤中多种污染物含量的监测.</FONT>
|
| [5] |
应用探地雷达检测复垦土壤的分层结构 [J].https://doi.org/10.3969/j.issn.1004-4051.2005.03.020 URL [本文引用: 1] 摘要
复垦土壤的物理条件,是影响作物生长的重要因素.本文利用探地雷 达为手段对研究区的复垦土壤进行了探测.对采集到的探地雷达数据应用小波方法进行了分析.通过将处理后的数据与复垦土壤的剖面进行对比,证实只要采用适当 的数据处理方法,探地雷达可以有效的检测到复垦土壤的分层结构状况.
Study on layer structure of rehabilitated soil using ground-penetrating radar [J].https://doi.org/10.3969/j.issn.1004-4051.2005.03.020 URL [本文引用: 1] 摘要
复垦土壤的物理条件,是影响作物生长的重要因素.本文利用探地雷 达为手段对研究区的复垦土壤进行了探测.对采集到的探地雷达数据应用小波方法进行了分析.通过将处理后的数据与复垦土壤的剖面进行对比,证实只要采用适当 的数据处理方法,探地雷达可以有效的检测到复垦土壤的分层结构状况.
|
| [6] |
基于全谱数据挖掘技术的土壤有机质高光谱预测建模研究 [J].
可见/近红外高光谱技术与建模方法是当前土壤近地传感器研究领域的重要方向, 可应用于土壤养分信息的快速获取和农田作物的精确施肥管理。 以浙江省水稻土为研究对象, 利用以非线性模型为核心的数据挖掘技术, 包括随机森林、 支持向量机、 人工神经网络等方法分别建立了不同建模集和验证集的原始光谱与有机质含量的估测模型。 结果表明: 研究比较的1∶1, 3∶1和全部样本建模并全部验证的三种样本模式划分对建模的结果有一定的影响。 相较于目前常用的偏最小二乘回归(PLSR)建模方法而言, 非线性模型RF和SVM也取得了较好的建模精度, 三种模式下其RDP值均大于1.4。 特别是采用SVM建模方法所得模型具有很好的预测能力, 模式二下其RDP值达到2.16。 同时引入ANN方法改进建立的PLSR-ANN方法显著提高了PLSR的模型预测能力。
Using different data mining algorithms to predict soil organic matter based on visible-near infrared spectroscopy [J].
可见/近红外高光谱技术与建模方法是当前土壤近地传感器研究领域的重要方向, 可应用于土壤养分信息的快速获取和农田作物的精确施肥管理。 以浙江省水稻土为研究对象, 利用以非线性模型为核心的数据挖掘技术, 包括随机森林、 支持向量机、 人工神经网络等方法分别建立了不同建模集和验证集的原始光谱与有机质含量的估测模型。 结果表明: 研究比较的1∶1, 3∶1和全部样本建模并全部验证的三种样本模式划分对建模的结果有一定的影响。 相较于目前常用的偏最小二乘回归(PLSR)建模方法而言, 非线性模型RF和SVM也取得了较好的建模精度, 三种模式下其RDP值均大于1.4。 特别是采用SVM建模方法所得模型具有很好的预测能力, 模式二下其RDP值达到2.16。 同时引入ANN方法改进建立的PLSR-ANN方法显著提高了PLSR的模型预测能力。
|
| [7] |
基于遥感技术的干旱区土壤分类研究 [J].https://doi.org/10.3321/j.issn:1007-4619.2008.01.021 URL Magsci [本文引用: 1] 摘要
以新疆艾比湖地区为研究区域,以ASTER和SPOT卫星数据为基础,探讨了干旱环境下基于土壤与景观关系的土壤遥感自动分类方法.首先,研究以实地调查资料和第二次全国土壤普查数据库为基础,结合遥感图像信息分析了试验区土壤类型与景观的关系.然后,基于遥感图像和地形数据提取了分类特征,并采用Jeffries-Matusita 距离分析建立了适用遥感分类的土壤分类系统和分类特征集.最后,采用最大似然法进行了自动分类.研究证明,基于遥感信息和地形数据提取的分类特征,可有效地区分试验区9类土壤和地表覆被,主要包括:盐碱化土壤、荒漠化土壤等,总体分类精度达到了90%左右.
A study of soil classification based on remote sensing in arid area [J].https://doi.org/10.3321/j.issn:1007-4619.2008.01.021 URL Magsci [本文引用: 1] 摘要
以新疆艾比湖地区为研究区域,以ASTER和SPOT卫星数据为基础,探讨了干旱环境下基于土壤与景观关系的土壤遥感自动分类方法.首先,研究以实地调查资料和第二次全国土壤普查数据库为基础,结合遥感图像信息分析了试验区土壤类型与景观的关系.然后,基于遥感图像和地形数据提取了分类特征,并采用Jeffries-Matusita 距离分析建立了适用遥感分类的土壤分类系统和分类特征集.最后,采用最大似然法进行了自动分类.研究证明,基于遥感信息和地形数据提取的分类特征,可有效地区分试验区9类土壤和地表覆被,主要包括:盐碱化土壤、荒漠化土壤等,总体分类精度达到了90%左右.
|
| [8] |
基于三维普通克立格方法的滨海盐土电导率三维空间变异研究 [J].https://doi.org/10.11766/trxb200805090222 URL [本文引用: 1] 摘要
土壤是一个三维自然空间实体,人们关心的不仅是二维平面上的信息,还包括垂直方向的第三维信息,但是目前土壤属性空间变异研究主要集中在水平方向上.即使 是以土壤属性三维变异特性描述为目的的研究,也仅仅局限于用一系列水平层来描述土壤不同深度土层的属性变化,没有考虑上下层之间的相互影响[1].
Research on three-dimension spatial variability of soil electrical conductivity of coastal saline land using 3D ordinary kriging method [J].https://doi.org/10.11766/trxb200805090222 URL [本文引用: 1] 摘要
土壤是一个三维自然空间实体,人们关心的不仅是二维平面上的信息,还包括垂直方向的第三维信息,但是目前土壤属性空间变异研究主要集中在水平方向上.即使 是以土壤属性三维变异特性描述为目的的研究,也仅仅局限于用一系列水平层来描述土壤不同深度土层的属性变化,没有考虑上下层之间的相互影响[1].
|
| [9] |
砂壤土中目标物的GPR图像解译及土壤含水量反演 [J].Ground penetrating radar imagery interpretation of target in sand loamy soil and soil water content inversion [J]. |
| [10] |
基于修正介电常数模型的煤矿区复垦土壤压实评价 [J].Compaction evaluation of reclamation soil in coal mining district based on modified dielectric constant model [J]. |
| [11] |
便携式X射线荧光光谱法与原子吸收/原子荧光法测定土壤重金属的对比研究 [J].
应用便携式X射线荧光光谱仪(PXRF)分别在原位和实验室条件下对53个土壤样品中的Cu, Pb, As, Cr, Ni和Zn等重金属进行测定, 并与原子吸收/原子荧光法测定值进行对比, 建立一元线性回归模型分析PXRF数据质量。 通过测定土壤样品原位含水量并选取部分样品进行室内水分定量实验, 分析土壤水分对于PXRF测定结果的影响。 结果表明, PXRF检出限分别为Cu: 10.6 mg·kg-1, Pb: 8.1 mg·kg-1, As: 5.7 mg·kg-1, Cr: 22.5 mg·kg-1, Ni: 21.6 mg·kg-1, Zn: 10.4 mg·kg-1; 原位测定时Pb, Cr, Ni和Zn可以达到定量水平; 经过风干磨细处理, Cu, Pb, Cr, Ni和Zn在实验室条件下可以达到定量水平, 说明X射线荧光光谱法适用于土壤重金属的快速测定与评价。 水分对于PXRF测定结果具有“稀释”作用, 原位条件下土壤含水量<15%时与>25%时样品的平均相对误差分别为-17%与-31%; 实验室条件下土壤含水量从风干土水平提高到30%, 测定的平均相对误差由10%变为-24%。 土壤水分升高可能会导致数据质量和准确性降低, 建议原位测定时控制土壤含水量在25%以内。
Comparison of soil heavy metals determined by AAS/AFS and portable X-ray fluorescence analysis [J].
应用便携式X射线荧光光谱仪(PXRF)分别在原位和实验室条件下对53个土壤样品中的Cu, Pb, As, Cr, Ni和Zn等重金属进行测定, 并与原子吸收/原子荧光法测定值进行对比, 建立一元线性回归模型分析PXRF数据质量。 通过测定土壤样品原位含水量并选取部分样品进行室内水分定量实验, 分析土壤水分对于PXRF测定结果的影响。 结果表明, PXRF检出限分别为Cu: 10.6 mg·kg-1, Pb: 8.1 mg·kg-1, As: 5.7 mg·kg-1, Cr: 22.5 mg·kg-1, Ni: 21.6 mg·kg-1, Zn: 10.4 mg·kg-1; 原位测定时Pb, Cr, Ni和Zn可以达到定量水平; 经过风干磨细处理, Cu, Pb, Cr, Ni和Zn在实验室条件下可以达到定量水平, 说明X射线荧光光谱法适用于土壤重金属的快速测定与评价。 水分对于PXRF测定结果具有“稀释”作用, 原位条件下土壤含水量<15%时与>25%时样品的平均相对误差分别为-17%与-31%; 实验室条件下土壤含水量从风干土水平提高到30%, 测定的平均相对误差由10%变为-24%。 土壤水分升高可能会导致数据质量和准确性降低, 建议原位测定时控制土壤含水量在25%以内。
|
| [12] |
含水含盐土壤的微波介电特性分析研究 [J].https://doi.org/10.11834/jrs.20020604 Magsci [本文引用: 1] 摘要
用微波网络分析仪测量了实验室制备的各种不同含水量,含盐量的土壤样品的复介电常数,研究了介电常数的实部和虚部与频率、盐度、含水量的关系。研究表明:频率、盐度对土壤介电常数实部的影响很小;对于某一特定土壤,其介电常数的实部由土壤的含水量决定;在较低频率范围内(f<2GHz),虚部随着频率的增大而迅速下降,高频部分则趋向于一定值,波长较长的波段,如P波段或L波段对土壤含盐程度具有更高的敏感性,含盐量对虚部在较低频范围(f<5GHz)影响很大。同时,采集了内蒙古吉兰泰盐湖区的土壤样品,并测量了其复介电常数,与同步过顶的RADARSAT图像进行了相关分析。分析结果表明雷达图像记录的后向散射强度与含盐土壤复介电常数实部的相关系数为0.23,与虚部的相关系数为0.66,即雷达图像观测的含盐含水士壤的后向散射强度与土壤的含盐量相关性较高。这为利用微波遥感进行土壤盐碱化程度监测,提供了可能和实验依据。
Study on soil microwave dielectric characteristic as salinity and water content [J].https://doi.org/10.11834/jrs.20020604 Magsci [本文引用: 1] 摘要
用微波网络分析仪测量了实验室制备的各种不同含水量,含盐量的土壤样品的复介电常数,研究了介电常数的实部和虚部与频率、盐度、含水量的关系。研究表明:频率、盐度对土壤介电常数实部的影响很小;对于某一特定土壤,其介电常数的实部由土壤的含水量决定;在较低频率范围内(f<2GHz),虚部随着频率的增大而迅速下降,高频部分则趋向于一定值,波长较长的波段,如P波段或L波段对土壤含盐程度具有更高的敏感性,含盐量对虚部在较低频范围(f<5GHz)影响很大。同时,采集了内蒙古吉兰泰盐湖区的土壤样品,并测量了其复介电常数,与同步过顶的RADARSAT图像进行了相关分析。分析结果表明雷达图像记录的后向散射强度与含盐土壤复介电常数实部的相关系数为0.23,与虚部的相关系数为0.66,即雷达图像观测的含盐含水士壤的后向散射强度与土壤的含盐量相关性较高。这为利用微波遥感进行土壤盐碱化程度监测,提供了可能和实验依据。
|
| [13] |
|
| [14] |
中国主要土壤高光谱反射特性分类与有机质光谱预测模型 [J].Development of a national VNIR soil-spectral library for soil classification and prediction of organic matter concentrations [J]. |
| [15] |
MSS卫片目视土壤解译与制图技术研究 [J].MSS weipian mushi turang jieyi yu zhitu jishu [J]. |
| [16] |
基于低频探地雷达的土壤累积入渗量的探测方法研究 [J].Method for measurement of soil cumulative infiltration based on low frequency GPR [J]. |
| [17] |
应用激光诱导击穿光谱对土壤中多元素同时定量分析 [J].
土壤元素的丰缺是对土壤养分检测、 农业按需种植和科学施肥的依据, 是精准农业农情信息感知技术检测的关键点, 更为农业生态、 高效和优质生产提供理论指导。 该研究运用激光诱导击穿光谱(LIBS)技术结合定标曲线法和偏最小二乘回归(PLSR)方法对土壤中的Al, Fe, Mg, Ca, Na和K多种元素同时进行定量分析。 利用LIBS检测仪获取了五种标准土壤样品(国家编号: GBW07446, GBW07447, GBW07454, GBW07455和GBW07456)的LIBS数据之后, 将每种土壤的多条谱线平均处理来消除试验误差。 通过分析所获取的土壤LIBS谱线信息, 选取了Al, Fe, Mg, Ca, Na和K元素的特征分析谱线和分析光谱区间, 并利用谱线的峰值信息和分析光谱区间内的单个或多个谱峰的积分信息(峰面积)与对应元素浓度拟合并建立定标曲线。 结果表明, 基于谱峰的峰面积建立的定标曲线的线性关系优于利用峰值信息建立的定标曲线(Fe除外)。 同时, 针对所选的分析光谱区间和元素的浓度信息, 运用PLSR建立定量分析模型, 其结果明显要优于定标曲线的分析精度, 这也表明LIBS技术结合化学计量学分析在未来光谱化学分析领域有很大应用前景。 研究的结果不仅为现代农业的土壤养分空间分布检测和农田精准施肥技术的应用起指导作用, 还为田间使用的便携式LIBS土壤检测仪的开发奠定了理论基础。
Laser-induced breakdown spectroscopy for simultaneous quantitative analysis of multi-elements in soil [J].
土壤元素的丰缺是对土壤养分检测、 农业按需种植和科学施肥的依据, 是精准农业农情信息感知技术检测的关键点, 更为农业生态、 高效和优质生产提供理论指导。 该研究运用激光诱导击穿光谱(LIBS)技术结合定标曲线法和偏最小二乘回归(PLSR)方法对土壤中的Al, Fe, Mg, Ca, Na和K多种元素同时进行定量分析。 利用LIBS检测仪获取了五种标准土壤样品(国家编号: GBW07446, GBW07447, GBW07454, GBW07455和GBW07456)的LIBS数据之后, 将每种土壤的多条谱线平均处理来消除试验误差。 通过分析所获取的土壤LIBS谱线信息, 选取了Al, Fe, Mg, Ca, Na和K元素的特征分析谱线和分析光谱区间, 并利用谱线的峰值信息和分析光谱区间内的单个或多个谱峰的积分信息(峰面积)与对应元素浓度拟合并建立定标曲线。 结果表明, 基于谱峰的峰面积建立的定标曲线的线性关系优于利用峰值信息建立的定标曲线(Fe除外)。 同时, 针对所选的分析光谱区间和元素的浓度信息, 运用PLSR建立定量分析模型, 其结果明显要优于定标曲线的分析精度, 这也表明LIBS技术结合化学计量学分析在未来光谱化学分析领域有很大应用前景。 研究的结果不仅为现代农业的土壤养分空间分布检测和农田精准施肥技术的应用起指导作用, 还为田间使用的便携式LIBS土壤检测仪的开发奠定了理论基础。
|
| [18] |
中国土壤地理学发展的回顾与展望 [J].https://doi.org/10.3321/j.issn:0564-3929.2008.05.005 URL [本文引用: 1] 摘要
基础土壤地理学的核心内容是土壤在时间和空间中的变化,目标是预测土壤在生态系统中的行为以及在自然和人为影响下的演变、实现土壤资源的有效管理。我国土壤地理学的发展经历了几个重要阶段,20世纪50年代区域和全国性的土壤调查和综合考察奠定了我国土壤地理学的发展基础;20世纪80年代随着全国第二次土壤普查的开始和科学研究恢复,土壤地理学重新复兴,包括土壤发生、土壤分类、土壤制图、土壤遥感等各个分支学科在内的土壤地理学得以迅速发展,这其中1984年开始的“中国土壤系统分类”研究贯穿了此后20多年的发展历程并推动了相关学科的进步;20世纪90年代以后,以3s技术为代表的新技术和新方法全面促进了土壤地理研究的现代化,土壤空间变化描述的内容、方式、应用等都发生了重大变化。未来的土壤地理学研究将面对我国土壤资源制约的国情,重点应该围绕变化中的自然条件和强烈的人为干扰下土壤质量与功能的演变、以土系为主体的土壤基层分类体系、以信息技术和模型模拟相结合的土壤资源数字化表达与管理系统等中心内容,为我国土壤资源的可持续管理、环境保护以及应对全球环境变化服务。
Retrospect and prospect of soil geography in China [J].https://doi.org/10.3321/j.issn:0564-3929.2008.05.005 URL [本文引用: 1] 摘要
基础土壤地理学的核心内容是土壤在时间和空间中的变化,目标是预测土壤在生态系统中的行为以及在自然和人为影响下的演变、实现土壤资源的有效管理。我国土壤地理学的发展经历了几个重要阶段,20世纪50年代区域和全国性的土壤调查和综合考察奠定了我国土壤地理学的发展基础;20世纪80年代随着全国第二次土壤普查的开始和科学研究恢复,土壤地理学重新复兴,包括土壤发生、土壤分类、土壤制图、土壤遥感等各个分支学科在内的土壤地理学得以迅速发展,这其中1984年开始的“中国土壤系统分类”研究贯穿了此后20多年的发展历程并推动了相关学科的进步;20世纪90年代以后,以3s技术为代表的新技术和新方法全面促进了土壤地理研究的现代化,土壤空间变化描述的内容、方式、应用等都发生了重大变化。未来的土壤地理学研究将面对我国土壤资源制约的国情,重点应该围绕变化中的自然条件和强烈的人为干扰下土壤质量与功能的演变、以土系为主体的土壤基层分类体系、以信息技术和模型模拟相结合的土壤资源数字化表达与管理系统等中心内容,为我国土壤资源的可持续管理、环境保护以及应对全球环境变化服务。
|
| [19] |
星地多源数据的区域土壤有机质数字制图 [J].https://doi.org/10.11834/jrs.20154257 URL [本文引用: 1] 摘要
土壤有机质(SOM)是全球碳循环、土壤养分的重要组成部分,精确估算土壤有机质含量具有重要意义.本文以中国东北—华北平原为研究区,收集了1078个土壤样本,以遥感数据(MODIS,TRMM和STRM数据)与土壤地面光谱数据为预测因子,运用基于树形结构的数据挖掘技术构建土壤有机质-环境预测因子模型进行数字土壤制图.通过不同建模样本数建模精度比较,选择300个样本数时的模型为最优模型.建模结果表明土壤光谱和气候因子是研究区SOM变异的主控因子,生物因子次之,而地形因子影响最小.预测结果经检验,RMSE为7.25,R2为0.69,RPD为1.53制图结果与基于第二次全国土壤普查数据的土壤有机质地图具有相似的分布规律,呈现SOM自东北向西南递减的趋势.通过比较分析发现,经过20年左右的土地开发与利用,研究区低SOM和高SOM含量土壤面积减少,而中等SOM含量土壤面积增加.
Regional scale mapping of soil organic matter using remote sensing and visible-near infrared spectroscopy [J].https://doi.org/10.11834/jrs.20154257 URL [本文引用: 1] 摘要
土壤有机质(SOM)是全球碳循环、土壤养分的重要组成部分,精确估算土壤有机质含量具有重要意义.本文以中国东北—华北平原为研究区,收集了1078个土壤样本,以遥感数据(MODIS,TRMM和STRM数据)与土壤地面光谱数据为预测因子,运用基于树形结构的数据挖掘技术构建土壤有机质-环境预测因子模型进行数字土壤制图.通过不同建模样本数建模精度比较,选择300个样本数时的模型为最优模型.建模结果表明土壤光谱和气候因子是研究区SOM变异的主控因子,生物因子次之,而地形因子影响最小.预测结果经检验,RMSE为7.25,R2为0.69,RPD为1.53制图结果与基于第二次全国土壤普查数据的土壤有机质地图具有相似的分布规律,呈现SOM自东北向西南递减的趋势.通过比较分析发现,经过20年左右的土地开发与利用,研究区低SOM和高SOM含量土壤面积减少,而中等SOM含量土壤面积增加.
|
| [20] |
Soil organic carbon mapping of partially vegetated agricultural fields with imaging spectroscopy [J].https://doi.org/10.1016/j.jag.2010.06.009 URL [本文引用: 1] 摘要
Soil Organic Carbon (SOC) is one of the key soil properties, but the large spatial variation makes continuous mapping a complex task. Imaging spectroscopy has proven to be an useful technique for mapping of soil properties, but the applicability decreases rapidly when fields are partially covered with vegetation. In this paper we show that with only a few percent fractional maize cover the accuracy of a Partial Least Square Regression (PLSR) based SOC prediction model drops dramatically. However, this problem can be solved with the use of spectral unmixing techniques. First, the fractional maize cover is determined with linear spectral unmixing, taking the illumination and observation angles into account. In a next step the influence of maize is filtered out from the spectral signal by a new procedure termed Residual Spectral Unmixing (RSU). The residual soil spectra resulting from this procedure are used for mapping of SOC using PLSR, which could be done with accuracies comparable to studies performed on bare soil surfaces (Root Mean Standard Error of Calibration02=021.3402g/kg and Root Mean Standard Error of Prediction02=021.6502g/kg). With the presented RSU approach it is possible to filter out the influence of maize from the mixed spectra, and the residual soil spectra contain enough information for mapping of the SOC distribution within agricultural fields. This can improve the applicability of airborne imaging spectroscopy for soil studies in temperate climates, since the use of the RSU approach can extend the flight-window which is often constrained by the presence of vegetation.
|
| [21] |
The application of dielectric retrieval algorithms for mapping soil salinity in a tropical coastal environment using airborne polarimetric SAR [J].https://doi.org/10.1016/S0034-4257(00)00180-2 URL [本文引用: 1] 摘要
The Alligator River Region of the Northern Territory, Australia, is identified as a region particularly susceptible to saltwater intrusion into systems dominated by freshwater processes. Attempts have been made by the Parks and Wildlife Commission of the NT to restrict the intrusion by creating physical earth barrages. In this study the use of Airborne Polarimetric Synthetic Aperture Radar for mapping soil salinity is examined. Three dielectric retrieval algorithms, the Small Perturbation, Physical Optics, and Dubois models have been implemented, and the results of these were combined to retrieve an improved estimate of the magnitude of the imaginary part of the complex dielectric constant for soil salinity discrimination. An efficient data selection process was employed to allow application of these models in this natural environment. Vegetation correction to the small perturbation and physical optics models before combination with the Dubois model improved classification accuracy in the semivegetated areas.
|
| [22] |
Reflection of radiant energy from soils [J].https://doi.org/10.1097/00010694-196508000-00009 URL [本文引用: 1] 摘要
Data secured with spectrophotometers show that surface moisture content, organic matter, and particle size strongly influence the reflectance and absorptance of solar radiant energy by soils. At all wavelengths measured, on all samples, reflectance decreased and absorptance increased as moisture content increased. By using Gates' direct solar energy distribution curve, one would expect that increasing the moisture content on a Newtonia silt loam from 0.8 to 20.2 percent would increase absorption of radiant energies by at least 14.2 percent of that in the equivalent direct solar beam. The plot of moisture content against reflectance indicates the possibility of using reflectance methods for surface moisture determinations. Results were especially good at 1900 mu, a moisture-sensitive wavelength. The oxidation of soil organic matter increased the reflectance from all samples measured. Again using Gates' distribution curve, 8.2 percent more of the energy in the equivalent direct solar beam might have been reflected by the oxidized Newtonia silt loam sample. With both kaolinite and bentonite clays, reflectance increased exponentially as particle size decreased. The magnitude of reflectance change was very similar with both clays. By applying the kaolinite reflectance data to Gates' direct solar energy distribution curve, one would expect energy absorption to increase by at least an additional 14.6 percent of that in the incident beam when the particle size is increased from 22 mu to 2650 mu. /Author/
|
| [23] |
Global soil characterization with VNIR diffuse reflectance spectroscopy [J].https://doi.org/10.1016/j.geoderma.2005.04.025 URL [本文引用: 1] 摘要
There has been growing interest in the use of diffuse infrared reflectance as a quick, inexpensive tool for soil characterization. In studies reported to date, calibration and validation samples have been collected at either a local or regional scale. For this study, we selected 3768 samples from all 50 U.S. states and two tropical territories and an additional 416 samples from 36 different countries in Africa (125), Asia (104), the Americas (75) and Europe (112). The samples were selected from the National Soil Survey Center archives in Lincoln, NE, USA, with only one sample per pedon and a weighted random sampling to maximize compositional diversity. Applying visible and near-infrared (VNIR) diffuse reflectance spectroscopy (DRS) to air-dry soil (< 2 mm) with auxiliary predictors including sand content or pH, we obtained validation root mean squared deviation (RMSD) estimates of 54 g kg 61 1 for clay, 7.9 g kg 61 1 for soil organic C (SOC), 5.6 g kg 61 1 for inorganic C (IC), 8.9 g kg 61 1 for dithionate–citrate extractable Fe (FEd), and 5.5 cmol c kg 61 1 for cation exchange capacity (CEC) with NH 4 at pH = 7. For all of these properties, boosted regression trees (BRT) outperformed PLS regression, suggesting that this might be a preferred method for VNIR-DRS soil characterization. Using BRT, we were also able to predict ordinal clay mineralogy levels for montmorillonite and kaolinite, with 88% and 96%, respectively, falling within one ordinal unit of reference X-ray diffraction (XRD) values (0–5 on ordinal scale). Given the amount of information obtained in this study with 654 × 10 3 samples, we anticipate that calibrations sufficient for many applications might be obtained with large but obtainable soil-spectral libraries (perhaps 10 4–10 5 samples). The use of auxiliary predictors (potentially from complementary sensors), supplemental local calibration samples and theoretical spectroscopy all have the potential to improve predictions. Our findings suggest that VNIR soil characterization has the potential to replace or augment standard soil characterization techniques where rapid and inexpensive analysis is required.
|
| [24] |
Aerial photography and soil survey [J].https://doi.org/10.2136/sssaj1929.036159950B1020010004x URL [本文引用: 2] 摘要
As you remember, our name was the American Association Soil Survey Workers. This title was. not satisfactory-to some it seemed conceited because we were the only scientific group which saw fit to call the members workers. To'others the name may have seemed to
|
| [25] |
Development of a hybrid proximal sensing method for rapid identification of petroleum contaminated soils [J].https://doi.org/10.1016/j.scitotenv.2015.01.087 URL PMID: 25681776 [本文引用: 1] 摘要
Abstract Using 108 petroleum contaminated soil samples, this pilot study proposed a new analytical approach of combining visible near-infrared diffuse reflectance spectroscopy (VisNIR DRS) and portable X-ray fluorescence spectrometry (PXRF) for rapid and improved quantification of soil petroleum contamination. Results indicated that an advanced fused model where VisNIR DRS spectra-based penalized spline regression (PSR) was used to predict total petroleum hydrocarbon followed by PXRF elemental data-based random forest regression was used to model the PSR residuals, it outperformed (R(2)=0.78, residual prediction deviation (RPD)=2.19) all other models tested, even producing better generalization than using VisNIR DRS alone (RPD's of 1.64, 1.86, and 1.96 for random forest, penalized spline regression, and partial least squares regression, respectively). Additionally, unsupervised principal component analysis using the PXRF+VisNIR DRS system qualitatively separated contaminated soils from control samples. CAPSULE: Fusion of PXRF elemental data and VisNIR derivative spectra produced an optimized model for total petroleum hydrocarbon quantification in soils. Copyright 2015 Elsevier B.V. All rights reserved.
|
| [26] |
Near-infrared reflectance spectroscopy-principal components regression analyses of soil properties [J].https://doi.org/10.2136/sssaj2001.652480x URL [本文引用: 2] 摘要
A fast and convenient soil analytical technique is needed for soil quality assessment and precision soil management. The main objective of this study was to evaluate the ability of near-infrared reflectance spectroscopy (NIRS) to predict diverse soil properties. Near-infrared reflectance spectra, obtained from a Perstrop NIR Systems 6500 scanning monochromator (Foss NIRSystems, Silver Spring, MD), and 33 chemical, physical, and biochemical properties were studied for 802 soil samples collected from four Major Land Resource Areas (MLRAs). Calibrations were based on principal component regression (PCR) using the first derivatives of optical density [log(1/R)] for the 1300- to 2500-nm spectral range. Total C, total N, moisture, cation-exchange capacity (CEC), 1.5 MPa water, basal respiration rate, sand, silt, and Mehlich III extractable Ca were successfully predicted by NIRS (r
|
| [27] |
The global significance of omitting soil erosion from soil organic carbon cycling schemes [J].https://doi.org/10.1038/nclimate2829 URL [本文引用: 1] 摘要
Land surface models do not usually account for soil movement effects on soil organic carbon (SOC). Research utilizing a SOC cycling scheme modified to include soil redistribution now shows potential for reducing uncertainty in SOC flux estimates.
|
| [28] |
Emission of rough surfaces calculated by the integral equation method with comparison to three-dimensional moment method simulations [J].https://doi.org/10.1109/TGRS.2002.807587 URL [本文引用: 1] |
| [29] |
Real-time measurement of soil attributes using on-the-go near infrared reflectance spectroscopy [J].https://doi.org/10.1016/j.compag.2007.02.010 URL [本文引用: 1] 摘要
The spatial variability of soil attributes is cost prohibitive to characterize using traditional soil sampling and laboratory analysis. Yet, the potential benefit of managing soils on a site-specific basis has been recognized. In addition, measurement of terrestrial carbon stocks and their site-specific response to particular management schemes is needed. This paper presents an on-the-go spectrophotometer for in situ measurement of reflectance spectra and evaluates the potential of the system for making real-time predictions of various soil attributes using near infrared reflectance spectroscopy (NIRS). The evaluation was conducted using spectrophotometer data and soil samples from eight fields in central Kansas. For each of the eight fields, a clustering algorithm was used to select 15 sample locations that best represented the spectral data space. Spectral pre-treatments including a derivative and the standard normal variate were considered and calibrations were created using principal components regression (PCR). A one-field-out validation scheme was shown to be a more stringent test than one-sample-out or (1/ m)-out, where m is the number of fields represented in the calibration set. Validation using a one-field-out scheme was emphasized because it is identical to the prediction problem encountered in a real-time context. The best one-field-out validation results were obtained for organic matter (OM), which was predicted with a root-mean-square error (RMSE) of 0.52% and a coefficient of determination ( R 2) of 0.67. Furthermore, the number of fields used for OM one-field-out validation was varied from 3 up to 8 to test the effect of adding samples from more fields to the calibration set. The results indicate that the prediction accuracy and percentage of locations predicted will increase as fields are added.
|
| [30] |
Trace pollutants analysis in soil by a time-resolved laser-induced breakdown spectroscopy technique [J].https://doi.org/10.1007/BF01095271 URL [本文引用: 1] 摘要
The results of a joint experiment of IFAM-Pisa and ENEA-Frascati for the detection of traces of pollutants in soil by a time-resolved laser-induced spectroscopy technique are reported. Using samples of soil with known pollutants' concentration [Geochemical Exploration Reference (GXR) silicate from US Geological Survey], we were able to estimate the sensitivity of this Laser-Induced Breakdown Spectroscopy (LIBS) technique to be of the order of some parts per million for a vast class of metallic pollutants, including extremely dangerous soil pollutants such as copper, lead and chromium.
|
| [31] |
Spatial downscaling of SMAP soil moisture using MODIS land surface temperature and NDVI during SMAPVEX15 [J].https://doi.org/10.1109/LGRS.2017.2753203 URL [本文引用: 1] 摘要
The Soil Moisture Active Passive (SMAP) mission provides a global surface soil moisture (SM) product at 36-km resolution from its L-band radiometer. While the coarse resolution is satisfactory to many applications, there are also a lot of applications which would benefit from a higher resolution SM product. The SMAP radiometer-based SM product was downscaled to 1 km using Moderate Resolution Imaging Spectroradiometer (MODIS) data and validated against airborne data from the Passive Active L-band System instrument. The downscaling approach uses MODIS land surface temperature and normalized difference vegetation index to construct soil evaporative efficiency, which is used to downscale the SMAP SM. The algorithm was applied to one SMAP pixel during the SMAP Validation Experiment 2015 (SMAPVEX15) in a semiarid study area for validation of the approach. SMAPVEX15 offers a unique data set for testing SM downscaling algorithms. The results indicated reasonable skill (root-mean-square difference of 0.053 m /m for 1-km resolution and 0.037 m鲁/m鲁 for 3-km resolution) in resolving high-resolution SM features within the coarse-scale pixel. The success benefits from the fact that the surface temperature in this region is controlled by soil evaporation, the topographical variation within the chosen pixel area is relatively moderate, and the vegetation density is relatively low over most parts of the pixel. The analysis showed that the combination of the SMAP and MODIS data under these conditions can result in a high-resolution SM product with an accuracy suitable for many applications.
|
| [32] |
Measurement of apparent electrical conductivity of soils by an electromagnetic induction probe to aid salinity surveys [J].https://doi.org/10.2136/sssaj1979.03615995004300040040x URL [本文引用: 1] 摘要
A noncontacting soil resistivity probe, based on electromagnetic induction, was used to measure soil salinity. Good correlations were obtained between the apparent bulk soil conductivity measured by the instrument and the electrical conductivity of saturated paste extracts or the bulk electrical conductivity measured by the Wenner four-probe method. The electromagnetic induction technique provided less detailed information on salinity changes with depth than the other methods, but was faster and can provide a continuous record of salinity changes along a transect.
|
| [33] |
The use of electromagnetic induction techniques in soils studies [J].https://doi.org/10.1016/j.geoderma.2014.01.027 URL [本文引用: 1] 摘要
61We review the use of electromagnetic induction (EMI) techniques in soils studies.61EMI allows the rapid collection of large amounts of spatially-oriented data.61Diffuse boundaries between soil map units can be well characterized with EMI.61A wide range of soil properties can be characterized.
|
| [34] |
Artificial neural network for on-site quantitative analysis of soils using laser induced breakdown spectroscopy [J].https://doi.org/10.1016/j.sab.2012.11.007 URL [本文引用: 1] 摘要
Nowadays, due to environmental concerns, fast on-site quantitative analyses of soils are required. Laser induced breakdown spectroscopy is a serious candidate to address this challenge and is especially well suited for multi-elemental analysis of heavy metals. However, saturation and matrix effects prevent from a simple treatment of the LIBS data, namely through a regular calibration curve. This paper details the limits of this approach and consequently emphasizes the advantage of using artificial neural networks well suited for non-linear and multi-variate calibration. This advanced method of data analysis is evaluated in the case of real soil samples and on-site LIBS measurements. The selection of the LIBS data as input data of the network is particularly detailed and finally, resulting errors of prediction lower than 20% for aluminum, calcium, copper and iron demonstrate the good efficiency of the artificial neural networks for on-site quantitative LIBS of soils.
|
| [35] |
Backscattering from a randomly rough dielectric surface [J].https://doi.org/10.1109/36.134085 URL [本文引用: 1] |
| [36] |
Optimization criteria in sample selection step of local regression for quantitative analysis of large soil NIRS database [J].https://doi.org/10.1016/j.chemolab.2011.11.003 URL [本文引用: 1] 摘要
Large soil spectral libraries compiling thousands of NIR (Near Infrared) reflectance spectra have been created encompassing a wide diversity and heterogeneity of spectra. Among the many chemometric approaches to the calibration of chemical and physical properties from these large libraries, local calibrations have the advantage of being able to select the most similar spectra to the spectrum of a target sample. This is particularly relevant when dealing with highly heterogeneous media such as soils, where the mineral matrix has a strong influence on spectral features. A crucial step in the implementation of local calibration procedures is the construction of local neighbourhoods. In this study, we investigate the influence of index computation and neighbour selection on calibration results using local PLSR models on a large soil spectral database. Our indices combine two spectral compression methods (Principal Component Analysis or Fast Fourier Transform) with two distinct distance metrics (Mahalanobis distance or correlation coefficient). Based on a large collection of soil samples provided by the French National Soil Quality Monitoring programme, we constructed calibration models to estimate two chemical (organic carbon and cationic exchange capacity) and two physical (clay and sand content) factors. After neighbour selection, local Partial Least Squares regressions were applied to the selected spectra. Our results highlight the utility of the Fourier transformation of the spectra compared to the classical PCA compression method in achieving a more appropriate neighbourhood selection. We propose an index based on the coefficient correlation with FFT compression that led to a neighbourhood selection giving the best prediction results for the four considered soil constituents.
|
| [37] |
Impact of management strategies on the global warming potential at the cropping system level [J].https://doi.org/10.1016/j.scitotenv.2014.05.070 URL PMID: 24911772 [本文引用: 1] 摘要
Abstract Estimating the greenhouse gas (GHG) emissions from agricultural systems is important in order to assess the impact of agriculture on climate change. In this study experimental data supplemented with results from a biophysical model (DNDC) were combined with life cycle assessment (LCA) to investigate the impact of management strategies on global warming potential of long-term cropping systems at two locations (Breton and Ellerslie) in Alberta, Canada. The aim was to estimate the difference in global warming potential (GWP) of cropping systems due to N fertilizer reduction and residue removal. Reducing the nitrogen fertilizer rate from 75 to 50 kg N ha(-1) decreased on average the emissions of N2O by 39%, NO by 59% and ammonia volatilisation by 57%. No clear trend for soil CO2 emissions was determined among cropping systems. When evaluated on a per hectare basis, cropping systems with residue removal required 6% more energy and had a little change in GWP. Conversely, when evaluated on the basis of gigajoules of harvestable biomass, residue removal resulted in 28% less energy requirement and 33% lower GWP. Reducing nitrogen fertilizer rate resulted in 18% less GWP on average for both functional units at Breton and 39% less GWP at Ellerslie. Nitrous oxide emissions contributed on average 67% to the overall GWP per ha. This study demonstrated that small changes in N fertilizer have a minimal impact on the productivity of the cropping systems but can still have a substantial environmental impact. Crown Copyright 2014. Published by Elsevier B.V. All rights reserved.
|
| [38] |
Soil degradation monitoring by remote sensing: Examples with three degradation processes [J].https://doi.org/10.2136/sssaj2009.0351 URL [本文引用: 1] 摘要
Recent developments in the monitoring of soil degradation processes have used passive remote sensing (diffuse reflectance spectroscopy) and active remote-sensing tools such as ground-penetrating radar (GPR) and frequency domain electromagnetic induction (FDEM). We have limited our review to three important degradation processes: structural crust, salinity, and soil mineral deformation and alterations caused by fire. These degradation processes, leading to declines in soil fertility and productivity, are commonly viewed in terms of their spatial and temporal distribution and variability, making spatial monitoring tools such as remote sensing the preferred choice. Recent work has shown that a hyperspectral (narrow-bands) approach combined with active remote sensing (FDEM and GPR) can be used to provide detailed, three-dimensional maps of soil salinity status in croplands. Such a map could improve our understanding of salinization mechanisms and salt sources, leading to improved drainage. System planning and management. Another pronounced hazard is structural crust formation following rainstorm events, which decreases soil infiltration, accelerates water runoff, and increases the potential for soil erosion. The spatial distribution of soil infiltration can be assessed using spectral information. Finally, recent studies have shown the potential of hyperspectral spectroscopy to assess and monitor mineralogical, chemical, and physical changes, some irreversible, in post-fire soils. The irreversible changes may serve as a footprint of fire intensity but may also affect the burned ecosystem's recovery. This review should serve as a precursor for future innovative studies of soil degradation processes as well as to open up a new frontier for soil preservation using hyperspectral technology. Soil Science Society of America, 5585 Guilford Rd., Madison WI 53711 USA.
|
| [39] |
Soil organic carbon prediction by hyperspectral remote sensing and field vis-NIR spectroscopy: An Australian case study [J].https://doi.org/10.1016/j.geoderma.2008.06.011 URL [本文引用: 1] 摘要
This paper compares predictions of soil organic carbon (SOC) using visible and near infrared reflectance (vis–NIR) hyperspectral proximal and remote sensing data. Soil samples were collected in the Narrabri region, dominated by Vertisols, in north western New South Wales (NSW), Australia. Vis–NIR spectra were collected over this region proximally with an AgriSpec portable spectrometer (350–2500nm) and remotely from the Hyperion hyperspectral sensor onboard satellite (400–2500nm). SOC contents were predicted by partial least-squares regression (PLSR) using both the proximal and remote sensing spectra. The spectral resolution of the proximal and remote sensing data did not affect prediction accuracy. However, predictions of SOC using the Hyperion spectra were less accurate than those of the Agrispec data resampled to similar resolution as the Hyperion spectra. Finally, the SOC map predicted using Hyperion data shows similarity with field observations. There is potential for the use of hyperspectral remote sensing for predictions of soil organic carbon. The use of these techniques will facilitate the implementation of digital soil mapping.
|
| [40] |
Soil layer models created with profile cone penetrometer data [J].https://doi.org/10.1016/S0016-7061(01)00076-3 URL [本文引用: 1] 摘要
In creating soil layer models for our study site, we were challenged (i) to express vagueness of our soil data, while at the same time maintaining adherence to systematic classification principles, and (ii) to describe continuously the spatial distribution of soil materials and layers in three dimensions. We developed a method to create 3-dimensional (3-D) continuous soil layer models describing the distribution of soil materials, reworked loess vs. glacial till. Soil attribute data such as texture, bulk density and water content, in combination with penetration resistance obtained with a profile cone penetrometer on a 10-m grid, were used to describe soil materials and layers. We compared crisp hierarchical clustering with fuzzy k-mean classification in creating soil layer models for a 2.73-ha site in southern Wisconsin. The continuous 3-D soil layer models were developed using horizontal ordinary kriging and vertical linear interpolation. Validation proved that the crisp 3-D soil layer model predicted soil layers more accurately than the fuzzy 3-D soil layer model. We conclude that at the working scale, the crisp classification is superior to the fuzzy classification.
|
| [41] |
Fusion of soil and remote sensing data to model soil properties [J].https://doi.org/10.1016/bs.agron.2014.12.004 URL [本文引用: 1] |
| [42] |
Spiking of NIR regional models using samples from target sites: Effect of model size on prediction accuracy [J].https://doi.org/10.1016/j.geoderma.2009.12.021 URL [本文引用: 1] 摘要
Near infrared reflectance (NIR) spectroscopy has many advantages because it is a rapid and cost-effective technique. A needed steep is the development of soil spectral libraries and models (calibrations using multivariate techniques). The calibrations should contain the variability of the target site soils on which the models are to be used. Many times this premise is not easy to fulfil. A classical way to solve this problem is by the spiking of models with a few samples from the target site (local samples), and the subsequent recalibration of models. In this regional-scale study we hypothesized that small-sized models should integrate the spectral characteristics of local samples more easily than large-sized models and as consequence should produce more accurate predictions. With the aim to test this hypothesis different-sized models were constructed using different quantities of soil samples. Partial least squares (PLS) regression was used to construct the models which were relating NIR spectra to the Nitrogen Kjeldahl (NKj) contents in soil samples. Two strategies were used for the selection of samples in models: (i) strategy based on spectra characteristics (SC) and (ii) strategy based on NKj values (NV) of the samples. These different-sized models were sequentially spiked with local samples from target sites and recalibrated. The predictions accuracies obtained with the models before and after spiking were studied being the NKj the soil property selected. In general all predictions were very accurate including those obtained before the spiking of models. Predictions accuracy increased as consequence of spiking in three of the four target sites studied. A negative trend was observed between prediction accuracy and model size. The lower errors were obtained using small-sized models after spiking which were more accurate than local models too. It was noticeable the high accuracy obtained by local models which were constructed using only 20 local samples. Before spiking SC models were more accurate than NV models but scarce differences between both strategies were observed after spiking with 20 samples. The results suggested that small-sized models can be useful for local predictions after spiking and they were also emphasizing the relevant role of local samples in models. The results obtained could encourage the expansion of this technique because large data based seem not be needed. Therefore NIR users could primarily focus most of their efforts on obtaining highly accurate analytical values in a few set of samples.
|
| [43] |
Estimation of soil types by non linear analysis of remote sensing data [J].https://doi.org/10.5194/npg-15-115-2008 URL [本文引用: 1] 摘要
The knowledge of soil type and soil texture is crucial for environmental monitoring purpose and risk assessment. Unfortunately, their mapping using classical techniques is time consuming and costly. We present here a way to estimate soil types based on limited field observations and remote sensing data. Due to the fact that the relation between the soil types and the considered attributes that were extracted from remote sensing data is expected to be non-linear, we apply Support Vector Machines (SVM) for soil type classification. Special attention is drawn to different training site distributions and the kind of input variables. We show that SVM based on carefully selected input variables proved to be an appropriate method for soil type estimation.
|
| [44] |
Mapping soil properties of Africa at 250 m resolution: Random forests significantly improve current predictions [J].https://doi.org/10.1371/journal.pone.0125814 URL PMID: 4482144 [本文引用: 1] 摘要
80% of arable land in Africa has low soil fertility and suffers from physical soil problems. Additionally, significant amounts of nutrients are lost every year due to unsustainable soil management practices. This is partially the result of insufficient use of soil management knowledge. To help bridge the soil information gap in Africa, the Africa Soil Information Service (AfSIS) project was established in 2008. Over the period 2008 2014, the AfSIS project compiled two point data sets: the Africa Soil Profiles (legacy) database and the AfSIS Sentinel Site database. These data sets contain over 28 thousand sampling locations and represent the most comprehensive soil sample data sets of the African continent to date. Utilizing these point data sets in combination with a large number of covariates, we have generated a series of spatial predictions of soil properties relevant to the agricultural management rganic carbon, pH, sand, silt and clay fractions, bulk density, cation-exchange capacity, total nitrogen, exchangeable acidity, Al content and exchangeable bases (Ca, K, Mg, Na). We specifically investigate differences between two predictive approaches: random forests and linear regression. Results of 5-fold cross-validation demonstrate that the random forests algorithm consistently outperforms the linear regression algorithm, with average decreases of 15 75% in Root Mean Squared Error (RMSE) across soil properties and depths. Fitting and running random forests models takes an order of magnitude more time and the modelling success is sensitive to artifacts in the input data, but as long as quality-controlled point data are provided, an increase in soil mapping accuracy can be expected. Results also indicate that globally predicted soil classes (USDA Soil Taxonomy, especially Alfisols and Mollisols) help improve continental scale soil property mapping, and are among the most important predictors. This indicates a promising potential for transferring pedological knowledge from data rich countries to countries with limited soil data.
|
| [45] |
Potential of integrated field spectroscopy and spatial analysis for enhanced assessment of soil contamination: A prospective review [J].https://doi.org/10.1016/j.geoderma.2014.11.024 URL [本文引用: 1] 摘要
There are tens of millions of contaminated soil sites in the world, and with an increasing population and associated risk there is a growing pressure to remediate them. A barrier to remediation is the lack of cost-effective approaches to assessment. Soil contaminants include a wide range of natural and synthetic metallic and organic compounds and minerals thus making analytical costs potentially very large. Further, soil contaminants show a large degree of spatial variation which increases the burden on sampling costs. This paper reviews potentially cost-effective methods for measurement, sampling design, and assessment. Current tiered investigation approaches and sampling strategies can be improved by using new technologies such as proximal sensing. Design of sampling can be aided by on-the-go proximal soil sensing; and expedited by subsequent adaptive spatially optimal sampling and prediction procedures enabled by field spectroscopic methods and advanced geostatistics. Field deployment of portable Visible & Near Infrared [wavelength 400–250002nm] (Vis-NIR) and X-ray fluorescence (PXRF) spectroscopies will require special calibration approaches but show huge potential for synergistic use. The use of mid-infrared spectroscopy [wavelength 2500–25,00002nm, wavenumber 4000–40002cm 61021 ] (MIR) for field implementation requires further adaptive research. We propose an integrated field-deployable methodology as a basis for further developments.
|
| [46] |
Application of portable XRF and VNIR sensors for rapid assessment of soil heavy metal pollution [J].https://doi.org/10.1371/journal.pone.0172438 URL PMID: 5325278 [本文引用: 1] 摘要
Abstract Rapid heavy metal soil surveys at large scale with high sampling density could not be conducted with traditional laboratory physical and chemical analyses because of the high cost, low efficiency and heavy workload involved. This study explored a rapid approach to assess heavy metals contamination in 301 farmland soils from Fuyang in Zhejiang Province, in the southern Yangtze River Delta, China, using portable proximal soil sensors. Portable X-ray fluorescence spectroscopy (PXRF) was used to determine soil heavy metals total concentrations while soil pH was predicted by portable visible-near infrared spectroscopy (PVNIR). Zn, Cu and Pb were successfully predicted by PXRF (R2 >0.90 and RPD >2.50) while As and Ni were predicted with less accuracy (R2 <0.75 and RPD <1.40). The pH values were well predicted by PVNIR. Classification of heavy metals contamination grades in farmland soils was conducted based on previous results; the Kappa coefficient was 0.87, which showed that the combination of PXRF and PVNIR was an effective and rapid method to determine the degree of pollution with soil heavy metals. This study provides a new approach to assess soil heavy metals pollution; this method will facilitate large-scale surveys of soil heavy metal pollution.
|
| [47] |
Modeling soil salinity along a hillslope in Iran by inversion of EM38 data [J].https://doi.org/10.2136/sssaj2014.11.0447 URL [本文引用: 1] 摘要
Abstract Electromagnetic (EM) induction has been used to characterize the spatial distribution of salinity. However, most studies have been undertaken to map the areal distribution of average profile salinity using measurements of the apparent electrical conductivity (ECa – mS m-1). In this study, an EM38 was used to map the distribution of salinity with depth along a 26-km hill slope in central Iran. We generated electromagnetic conductivity images (EMCI) by inverting EM38 ECa data collected at various heights in the EM4Soil software. A number of parameters including forward modelling (cumulative function-CF and full solution-FS), inversion algorithm (S1 and S2), damping factor (85) and combinations of different heights were considered to generate calculated soil true electrical conductivity (82 - mS m-1). By comparing different 82 against electrical conductivity of a saturated soil-paste extract (ECe - dS m-1) at various depths, we found that the strongest correlation and smallest modelling error was achieved using the FS, S1, 85 = 12 and ECa data collected at 0.4 m alone. We then compared the results achieved by developing a linear regression between 82 and ECe at various depths with those achieved using multiple linear regression (MLR) established between ECa and ECe. The inversion method was less time-consuming and more robust than the MLR approach. The predicted ECe increased from the crest to the base of the toposequence. The results were consistent with the underlying geology, climate and local topography. The methodology can be used as guidance for base line salinity monitoring and management.
|
| [48] |
Measuring soil water content with ground penetrating radar: A review [J].https://doi.org/10.2136/vzj2003.0476 URL [本文引用: 1] 摘要
Abstract Ground penetrating radar (GPR) was used to measure the distribution of soil water content below point and line sources of water. Vertical time domain reflectometry (TDR) probes were installed below and around the water sources. The TDR probes were used to measure soil water content for comparison to the GPR data. The GPR measurements were performed in zero offset gather (ZOG) and multiple offset gather (MOG) survey modes with the antennas in horizontal bore holes located on opposite sides and below the water sources. The ZOG survey mode gave an estimate of the average water content in the horizontal plane below the water sources at a prescribed interval between the horizontal boreholes. The MOG survey mode produced a tomographic image of the distribution of soil water content in the same horizontal plane below the water sources. I similar range of values of water contents was measured by TDR and GPR methods.
|
| [49] |
Global distribution of clay-size minerals on land surface for biogeochemical and climatological studies [J].https://doi.org/10.1038/sdata.2017.103 URL PMID: 5667577 [本文引用: 1] 摘要
Abstract Clay-size minerals play important roles in terrestrial biogeochemistry and atmospheric physics, but their data have been only partially compiled at global scale. We present a global dataset of clay-size minerals in the topsoil and subsoil at different spatial resolutions. The data of soil clay and its mineralogical composition were gathered through a literature survey and aggregated by soil orders of the Soil Taxonomy for each of the ten groups: gibbsite, kaolinite, illite/mica, smectite, vermiculite, chlorite, iron oxide, quartz, non-crystalline, and others. Using a global soil map, a global dataset of soil clay-size mineral distribution was developed at resolutions of 2' to 2 grid cells. The data uncertainty associated with data variability and assumption was evaluated using a Monte Carlo method, and validity of the clay-size mineral distribution obtained in this study was examined by comparing with other datasets. The global soil clay data offer spatially explicit studies on terrestrial biogeochemical cycles, dust emission to the atmosphere, and other interdisciplinary earth sciences.
|
| [50] |
Land degradation due to salinization in arid and semi-arid regions with the aid of geo-information techniques [J].https://doi.org/10.1007/s11806-008-0013-z URL [本文引用: 1] |
| [51] |
Salinity effects on the microwave emission of soils [J]. |
| [52] |
Accounting for the effects of water and the environment on proximally sensed vis-NIR soil spectra and their calibrations [J].https://doi.org/10.1111/ejss.12239 URL [本文引用: 1] 摘要
Visible–near infrared (vis–NIR) spectroscopy can be used to estimate soil properties effectively using spectroscopic calibrations derived from data contained in spectroscopic databases. However, these calibrations cannot be used with proximally sensed (field) spectra because the spectra in these databases are recorded in the laboratory and are different to field spectra. Environmental factors, such as the amount of water in the soil, ambient light, temperature and the condition of the soil surface, cause the differences. Here, we investigated the use of direct standardization (DS) to remove those environmental factors from field spectra. We selected 104 sensing (sampling) sites from nine paddy fields in Zhejiang province, China. At each site, vis–NIR spectra were recorded with a portable spectrometer. The soils were also sampled to record their spectra under laboratory conditions and to measure their soil organic matter (SOM) content. The resulting data were divided into training and validation sets. A subset of the corresponding field and laboratory spectra in the training set (the transfer set) was used to derive the DS transfer matrix, which characterizes the differences between the field and laboratory spectra. Using DS, we transferred the field spectra of the validation samples so that they acquired the characteristics of spectra that were measured in the laboratory. A partial least squares regression (PLSR) of SOM on the laboratory spectra of the training set was then used to predict both the original field spectra and the DS‐transferred field spectra. The assessment statistics of the predictions were improved from R0565=650.25 and RPD65=650.35 to R0565=650.69 and RPD65=651.61. We also performed independent predictions of SOM on the DS‐transferred field spectra with a PLSR derived using the Chinese soil spectroscopic database (CSSD), which was developed in the laboratory. The R05and RPD values of these predictions were 0.70 and 1.79, respectively. Predictions of SOM with the DS‐transferred field spectra were more accurate than those treated with external parameter orthogonalisation (EPO), and more accurate than predictions made by spiking. Our results show that DS can effectively account for the effects of water and environmental factors on field spectra and improve predictions of SOM. DS is conceptually straightforward and allows the use of calibrations made with laboratory‐measured spectra to predict soil properties from proximally sensed (field) spectra, without needing to recalibrate the models.
|
| [53] |
Studies in soil cultivation. I. The evolution of a reliable dynamometer technique for use in soil cultivation experiments [J].https://doi.org/10.1017/S002185960000681X URL [本文引用: 1] 摘要
An account is given of a reliable technique that has been evolved for making dynamometer measurements in the field. It has been shown that quite small variations in the trace of the drawbar pull are significant, and correspond to actual variations in the resistance of the soil. No significant change in drawbar pull is produced by imperfect adjustments in the hitch or set of the implement within the limits met with in ordinary ploughing, except in so far as the depth of working is affected. The drawbar pull bears a linear relationship to ploughing depth within the region of ordinary ploughing. The slope of the land is without appreciable effect on the drawbar pull up to gradients of 1 in 40.
|
| [54] |
Kriging interpolation method for laser induced breakdown spectroscopy (LIBS) analysis of Zn in various soils [J].https://doi.org/10.1039/c3ja50233c URL [本文引用: 1] 摘要
Laser induced breakdown spectroscopy (LIBS) was used to determine Zn concentrations in various types of soils, and discarding and kriging interpolation methods were combined to enhance the accuracy and precision of the LIBS analysis. In order to determine Zn concentrations in 10 field soils, the discarding method was used for pre-treatment of LIBS data acquisition. A remarkable decrease of relative standard deviation was observed indicating a significant increase of pulse-to-pulse precision. Nine artificial soil sets containing different contents of sand, kaolin, and goethite were manufactured for the interpolation database, and they displayed differing LIBS broadband spectra due to their respective sample matrices. In addition, the calibration slope of each soil set varied significantly showing up to a 3.36-fold difference. We found that the matrix effect derived from sand, kaolin, and goethite contents can be determined by detecting major elements in soil (Si, Al, and Fe) from LIBS analysis without additional measurements. The kriging interpolation model was applied using the database obtained from the artificial soil sets. The concentration of Zn in field soils calculated from data treatment methods showed significantly accurate results when compared to ICP-OES analysis results. By minimizing factors affecting the LIBS result, heavy metal concentrations in various types of soils can be determined using a developed database without calibration.
|
| [55] |
|
| [56] |
Spectral mapping of soil organic matter[R]. LARS Technical Reports. Purdue, |
| [57] |
Comparison of airborne hyperspectral data and EO-1 Hyperion for mineral mapping [J].https://doi.org/10.1109/TGRS.2003.812908 URL [本文引用: 1] 摘要
Airborne hyperspectral data have been available to researchers since the early 1980s and their use for geologic applications is well documented. The launch of the National Aeronautics and Space Administration Earth Observing 1 Hyperion sensor in November 2000 marked the establishment of a test bed for spaceborne hyperspectral capabilities. Hyperion covers the 0.4-2.5- m range with 242 spectral bands at approximately 10-nm spectral resolution and 30-m spatial resolution. Analytical Imaging and Geophysics LLC and the Commonwealth Scientific and Industrial Research Organisation have been involved in efforts to evaluate, validate, and demonstrate Hyperions's utility for geologic mapping in a variety of sites in the United States and around the world. Initial results over several sites with established ground truth and years of airborne hyperspectral data show that Hyperion data from the shortwave infrared spectrometer can be used to produce useful geologic (mineralogic) information. Minerals mapped include carbonates, chlorite, epidote, kaolinite, alunite, buddingtonite, muscovite, hydrothermal silica, and zeolite. Hyperion data collected under optimum conditions (summer season, bright targets, well-exposed geology) indicate that Hyperion data meet prelaunch specifications and allow subtle distinctions such as determining the difference between calcite and dolomite and mapping solid solution differences in micas caused by substitution in octahedral molecular sites. Comparison of airborne hyperspectral data [from the Airborne Visible/Infrared Imaging Spectrometer (AVIRIS)] to the Hyperion data establishes that Hyperion provides similar basic mineralogic information, with the principal limitation being limited mapping of fine spectral detail under less-than-optimum acquisition conditions (winter season, dark targets) based on lower signal-to-noise ratios. Case histories demonstrate the analysis methodologies and level of information available from the Hyperion data. They also show the viability of Hyperion as a means of extending hyperspectral mineral mapping to areas not accessible to aircraft sensors. The analysis results demonstrate that spaceborne hyperspectral sensors can produce useful mineralogic information, but also indicate that SNR improvements a- re required for future spaceborne sensors to allow the same level of mapping that is currently possible from airborne sensors such as AVIRIS.
|
| [58] |
Sensing soil properties in the laboratory, in situ, and on-line: A Review [J].https://doi.org/10.1016/B978-0-12-394275-3.00003-1 URL [本文引用: 1] |
| [59] |
Mapping the three-dimensional variation of soil salinity in a rice-paddy soil [J].https://doi.org/10.1016/j.geoderma.2012.11.005 URL [本文引用: 1] 摘要
Soil salinity is widespread in a variety of environments, and land managers need to map its severity and extent both laterally and vertically. In this research we explore the inversion of apparent electrical conductivity (EC a ) measured with an EM38 using a linear model and Tikhonov regularization to model electrical conductivity (σ) profiles in a saline paddy field in the Yangtze delta of China. The modelled σ matched closely the directly measured bulk electrical conductivity (σ b ) in the topsoil within our calibration field. Discrepancies were greatest between 0.4 and 0.802m, below which they converged again, and were judged small enough to map soil salinity. Equivalent EC a data, recorded in an adjacent field, was similarly inverted with the modelled σ analysed geostatistically. In this regard, the σ data at 10 depths were treated as 10 correlated variates, and experimental auto-and cross-variograms were computed by the method of moments from them. A linear model of coregionalization fitted well, and it was used to cokrige σ on 502m02×02502m blocks on a fine grid. The kriging errors, computed as the square roots of the cokriging variances, were typically about 5% of the kriged estimates. Estimates of σ were then converted into the universal standard of soil salinity measurement (i.e. electrical conductivity of a saturated soil paste extract — EC e ). The results indicate that an irregularly shaped patch of strongly saline topsoil (i.e. 8–1202dS02m 61021 ) and subsoil salinity (i.e. >021602dS02m 61021 ) at the southern end of the field was consistent with a yield reduction of some 33%; and as compared with the weakly saline conditions evident at the northern end of the field (e.g. topsoil EC e 2–402dS02m 61021 ) where yield was much larger. We conclude that the approach has merit and might be useful in providing a baseline set of data and a method that can used to monitor and evaluate the management of salinity.
|
| [60] |
Mapping soil salinity in the Yangtze delta: REML and universal kriging (E-BLUP) revisited [J].https://doi.org/10.1016/j.geoderma.2014.08.008 URL [本文引用: 1] 摘要
61Salinity in land reclaimed from the Yangtze delta was mapped geostatistically.61Residual maximum likelihood (REML) separated spatial trend from random residuals.61UK with REML variograms was used to predict and map salinity from the data.61Approximately half of the area mapped would yield a profitable crop of rice.61GenStat code for REML and UK is appended.
|
| [61] |
In situ measurements of organic carbon in soil profiles using vis-NIR spectroscopy on the Qinghai-Tibet Plateau [J].https://doi.org/10.1021/es504272x URL PMID: 25828919 [本文引用: 1] 摘要
Abstract We wish to estimate the amount of carbon (C) stored in the soil at high altitudes, for which there is little information. Collecting and transporting large numbers of soil samples from such terrain are difficult, and we have therefore evaluated the feasibility of scanning with visible near-infrared (vis-NIR) spectroscopy in situ for the rapid measurement of the soil in the field. We took 28 cores ( 1 m depth and 5 cm diameter) of soil at altitudes from 2900 to 4500 m in the Sygera Mountains on the Qinghai-Tibet Plateau, China. Spectra were acquired from fresh, vertical faces 5 5 cm in area from the centers of the cores to give 413 spectra in all. The raw spectra were pretreated by several methods to remove noise, and statistical models were built to predict of the organic C in the samples from the spectra by partial least-squares regression (PLSR) and least-squares support vector machine (LS-SVM). The bootstrap was used to assess the uncertainty of the predictions by the several combinations of pretreatment and models. The predictions by LS-SVM from the field spectra, for which R(2) = 0.81, the root-mean-square error RMSE = 8.40, and the ratio of the interquartile distance RPIQ = 2.66, were comparable to the PLSR predictions from the laboratory spectra (R(2) = 0.85, RMSE = 7.28, RPIQ = 3.09). We conclude that vis-NIR scanning in situ in the field is a sufficiently accurate rapid means of estimating the concentration of organic C in soil profiles in this high region and perhaps elsewhere.
|
| [62] |
Identification of saline-alkali soil based on target decomposition of full-polarization radar data [J].https://doi.org/10.1117/1.JRS.8.083511 URL [本文引用: 1] 摘要
The potential of C-band polarimetric synthetic aperture radar data for the discrimination of saline-alkali soils in the western Jilin Province, China, is shown. This area is one of the three saline-alkali landscapes in the world; the presence of saline-alkali soils severely restricts the development of local farming and limits the land use. It is extremely important to identify saline-alkali landscapes accurately and effectively. Radar remote sensing is one of the most promising approaches for saline-alkali soil identification due to the sensitivity of radar data to the dielectric and geometric characteristics of objects, its weather-independent imaging capability, and its potential to acquire subsurface information, independent of the frequency band. Full polarimetric radar data from the RADARSAT-2 satellite were used. We focused on target decomposition theory and the statistical classification approach using a Wishart distribution to identify saline-alkali soils. The precise validation of the classification results is based on 129 ground sampling points. The results indicate that the polarimetric classifications using the H- method performed poorly, with Kappa values of approximately 0.29. The classification method based on Freeman-Durden decomposition showed better results, with Kappa values of approximately 0.54 and an overall accuracy of 68.22%. The best result was achieved using an input of anisotropy, with Kappa values of approximately 0.62 and an overall accuracy of 74.42%. The validity of the anisotropy approach implies that the scattering randomness of saline-alkali soil is very strong, which reflects the complex scattering characteristics of saline-alkali landscapes. Further study of the scattering characteristics of saline-alkali soil is necessary.
|
| [63] |
Soil texture mapping over low relief areas using land surface feedback dynamic patterns extracted from MODIS [J].https://doi.org/10.1016/j.geoderma.2011.05.007 URL [本文引用: 1] 摘要
In low relief areas such as plains, easily obtained soil forming factors generally do not co-vary with soil conditions over space to the level that they can be used effectively in digital soil mapping. Mapping variation of soil properties over such areas remains a challenge. This paper presents an approach to mapping soil texture using environmental covariates derived from temporal responses of the land surface to a rainfall event (dynamic feedbacks) collected through remote sensing techniques. The approach consists of four steps: (1) construction of a set of environmental covariates from dynamic feedbacks of the land surface, captured daily from MODIS (Moderate Resolution Imaging Spectroradiometer) images over a short period (6 7 days) after a major rain event; (2) derivation of environmental classes based on the set of environmental covariates using a fuzzy c-means clustering; (3) Identification of typical soil texture value for each of the environmental classes from a dataset of field soil samples; (4) mapping of spatial variation of soil texture through a linearly weighted averaging function. The approach was applied to produce soil texture maps in a low relief area situated in south-central Manitoba, Canada. Its performance was assessed through comparison with soil texture maps generated from 1:20,000 traditional soil survey. The assessment was based on 34 field sample sites, independent of the samples used for prediction. The error values (9.42 for MAE and 12.56 for RMSE) of A-horizon percentage of sand from the proposed approach are less than these from the detailed soil survey (10.59 for MAE and 15.12 for RMSE). Similar results were obtained for A-horizon percentage of clay. In addition, the difference between the results of multiple linear regression analysis without and with the MODIS derived variables further demonstrated the effectiveness of the variables at differentiating patterns of soil texture. These indicated that the proposed approach is effective for mapping the variation of soil texture over the low relief area and it could be used to map other soil property variation over similar areas.
|
| [64] |
Predicting soil salt content over partially vegetated surfaces using non-negative matrix factorization [J].https://doi.org/10.1109/JSTARS.2015.2478490 URL [本文引用: 1] 摘要
Remote sensing has been widely applied to map soil salinity in the last few decades. However, a notable decrease in the accuracy of soil salt content (SSC) predictions occurred when the soil surfaces were partially vegetated. To minimize the influence of partial vegetation cover on spectral reflectance, we applied a spectral separation method, non-negative matrix factorization (NMF), to extract soil spectral information from a controlled field experiment with three varying factors [vegetation coverage, soil moisture content (SMC), and SSC]. The method was applied without prior knowledge of, or restrictions on the mixed and source spectra. Soil samples and spectral reflectance collected on three periods were used to determine the effectiveness of NMF-extracted soil spectra with partial least squares regression (PLSR). The results indicated that SSC can be predicted by bare soil spectra. NMF effectively separated soil spectra from the observed spectra, and the SSC was successfully predicted from the extracted soil spectra within a wide range of vegetation cover (0%-64.7%) within defined moisture levels (<;0.15g g-1 by weight). The approach proposed in this study will improve the prediction accuracy of SSC for partially vegetated surfaces and will expand the application of remote sensing.
|
| [65] |
Predicting soil salinity with Vis-NIR spectra after removing the effects of soil moisture using external parameter orthogonalization [J].https://doi.org/10.1371/journal.pone.0140688 URL PMID: 4607364 [本文引用: 1] 摘要
Abstract Robust models for predicting soil salinity that use visible and near-infrared (vis-NIR) reflectance spectroscopy are needed to better quantify soil salinity in agricultural fields. Currently available models are not sufficiently robust for variable soil moisture contents. Thus, we used external parameter orthogonalization (EPO), which effectively projects spectra onto the subspace orthogonal to unwanted variation, to remove the variations caused by an external factor, e.g., the influences of soil moisture on spectral reflectance. In this study, 570 spectra between 380 and 2400 nm were obtained from soils with various soil moisture contents and salt concentrations in the laboratory; 3 soil types 10 salt concentrations 19 soil moisture levels were used. To examine the effectiveness of EPO, we compared the partial least squares regression (PLSR) results established from spectra with and without EPO correction. The EPO method effectively removed the effects of moisture, and the accuracy and robustness of the soil salt contents (SSCs) prediction model, which was built using the EPO-corrected spectra under various soil moisture conditions, were significantly improved relative to the spectra without EPO correction. This study contributes to the removal of soil moisture effects from soil salinity estimations when using vis-NIR reflectance spectroscopy and can assist others in quantifying soil salinity in the future.
|
| [66] |
Soil moisture detection with imaging radars [J].https://doi.org/10.1029/WR007i001p00100 URL [本文引用: 1] 摘要
The high degree of correlation between the electrical properties of soil and soil moisture content are well known. Considerable experimental work has been conducted by using radar for the determination of soil moisture. However, in the transition from a controlled measurement device to an operational imaging radar, the effects of soil moisture have been extremely difficult to separate from other terrain parameters influencing the radar return signal. The data presented in this study suggest that presently available dual polarized, K-band, side-looking imaging radars provide a capability for revealing a qualitative estimate of soil moisture content. When used as a supplement to aerial photography in temperate climates, radar imagery analysis will decrease the ambiguity of soil type reconnaissance. In the Arctic, an imaging radar may provide data for mapping regions of permafrost, and this process could be accomplished in a sequential manner regardless of weather or time of day. The use of additional multifrequency multipolarization imaging radars and the relative foliage penetration of each should be investigated as a possible means of gathering quantitative soil moisture information.
|
| [67] |
Field-scale soil moisture pattern mapping using electromagnetic induction [J].https://doi.org/10.2136/vzj2009.0160 URL [本文引用: 1] 摘要
ABSTRACT Soil apparent electrical conductivity (EC(a)) responds to time-variable soil properties, such as soil water content (theta), and can therefore be used to characterize the spatial and temporal dynamics of theta at the field scale. When clay content is high and uniform and the theta range small, however, it is not clear whether EC(a) maps can be used for this purpose. A soil management experiment established in a Vertisol in 1982 was surveyed for EC(a) on 13 occasions to capture changing soil conditions and to determine the sources of this variability. Less variation with time was found in subsoil than in topsoil EC(a) patterns, especially within the conventional tillage (CT) plots, in areas with shallow soil, and along the drainage network. Using the 13 EC(a) relative difference data sets as variables, principal component (PC) analysis showed that the first three PCs explained 90% of their total variance. The time-stable or mean EC(a) pattern was significantly correlated with PC1 and could also be associated with topography, soil depth, and soil structure but could not be related to a single survey. Topography and soil management could be associated with PC2 and PC3, respectively. Time-stable theta patterns, inferred from 26 surveys, revealed topographical and management characteristics and showed significant relationships (P < 0.001) with EC(a)-derived patterns like soil porosity and infiltration caused by soil management, topography, and rainfall. Electromagnetic induction sensors were useful for mapping soil spatial variability and changing soil conditions due to management effects and external forcing in uniform clay soils.
|
| [68] |
Applying imaging spectroscopy techniques to map saline soils with ASTER images [J].https://doi.org/10.1016/j.geoderma.2010.02.015 URL [本文引用: 1] 摘要
This work presents a multi-temporal study (years 2000, 2004 and 2007) of saline soils based on multispectral Advanced Spaceborne Thermal Emission and Reflection Radiometer (ASTER) images. Its main contribution is the evaluation of different remote sensing methodologies for mapping saline soils in areas highly affected by soil degradation. The study area is located in SE Spain (between the cities of Elche and Alicante) and is characterized by a semiarid climate and the presence of numerous saline soils and salt-flats. Imaging spectroscopy techniques such as Matched Filtering (MF) and Mixture Tuned Matched Filtering (MTMF) techniques were used for mapping saline soils. Two different approaches were applied for mapping saline soils: 1) using image based spectra of saline and non-saline training areas, and 2) using the spectrum of the halite mineral as a proxy to the spectra of saline soils, because halite concentrations are significant in the saline soils of the study area. MF and MTMF mapping techniques were applied in both methodological approaches. Accuracy assessment was evaluated with the Receiver Operating Characteristic (ROC) plot technique. A validation procedure was applied with an independent saline and non-saline validation dataset. Training and validation saline and non-saline pixels were limited to areas with low vegetation coverage to avoid spectral interferences. High ROC values were obtained for the image based approach in the training and validation stages. Large differences between ROC training vs. validation values were not found. The halite spectrum based approach retrieved lower ROC training and validation values. Furthermore, the MTMF technique achieved better results than the MF in the halite spectrum based approach. Significant differences in the mapping performance were evaluated with the ANOVA test for the time of acquisition of scenes, the methodological approach, and the mapping technique factors. The image based approach was found to be the best methodology for saline soil mapping and monitoring.
|
| [69] |
Fuzzy classification of JERS-1 SAR data: An evaluation of its performance for soil salinity mapping [J].https://doi.org/10.1016/S0304-3800(98)00095-7 URL [本文引用: 1] 摘要
Remote sensing of surface features has been used intensively to identify and map salt-affected areas. Salt-tolerant vegetation is among the indicators used to separate saline-alkaline areas from non-affected ones. However, this type of vegetation causes spectral confusion and erroneous labelling between salinity and alkalinity classes when working with optical sensors such as Landstat TM or Spot. Accordingly, this paper evaluates the capabilities of the microwave range to map saline and alkaline areas. Fuzzy sets are used to model the information classes, and a fuzzy overlay model is implemented to classify the JERS-1 radar satellite image. The study shows that fuzzy classification of JERS-1 SAR data provides reliable detection (overall accuracy equal to 81%) of areas degraded by salinity-alkalinity processes. The main problems appear to be due to the interaction between soil roughness and radar backscattering, which determined erroneous allocation of alkaline and saline-alkaline areas to non-affected areas.
|
| [70] |
Impact of multi-scale predictor selection for modeling soil properties [J].https://doi.org/10.1016/j.geoderma.2014.09.018 URL [本文引用: 1] 摘要
61Potentially useful predictors for digital soil mapping are often overlooked.61Different analysis scales should be treated as unique predictor variables.61The use of multi-scale predictor variables can greatly increase model performance.61Experimentation with subsets of predictor pools for data mining tools can be productive.
|
| [71] |
Digital soil mapping: A brief history and some lessons [J].https://doi.org/10.1016/j.geoderma.2015.07.017 URL [本文引用: 1] 摘要
Digital soil mapping (DSM) is a successful sub discipline of soil science with an active research output. The success of digital soil mapping is a confluence of several factors in the beginning of 2000 including the increased availability of spatial data (digital elevation model, satellite imagery), the availability of computing power for processing data, the development of data-mining tools and GIS, and numerous applications beyond geostatistics. In addition, there was an increased global demand for spatial data including uncertainty assessments, and a rejuvenation of many soil survey and university centres which helped in the spreading of digital soil mapping technologies and knowledge. The theoretical framework for digital soil mapping was formalised in a 2003 paper in Geoderma . In this paper, we define what constitutes digital soil mapping, sketch a brief history of it, and discuss some lessons. Digital soil mapping requires three components: the input in the form of field and laboratory observational methods, the process used in terms of spatial and non-spatial soil inference systems, and the output in the form of spatial soil information systems, which includes outputs in the form of rasters of prediction along with the uncertainty of prediction. We also illustrate the history with a number of sleeping beauty papers that seem too precocious and consequently the ideas were not taken up by contemporaries and largely forgotten. It took another 30 to 40 years before the ideas were rediscovered and then flourished. Examples include proximal soil sensing that was developed in the 1920s, soil spectroscopy in 1970s, and soil mapping based on similarity of environmental factors in 1979. In summary, the coming together of emerging topics and timeliness greatly assists in the development of paradigm. We learned that research and ideas that are too precocious are largely ignored such work warrants (re)discovery.
|
| [72] |
Removing the effect of soil moisture from NIR diffuse reflectance spectra for the prediction of soil organic carbon [J].https://doi.org/10.1016/j.geoderma.2011.09.008 URL [本文引用: 1] 摘要
Field measurement using NIR spectroscopy is becoming a popular method to provide in situ, rapid, and inexpensive estimation of soil organic carbon (SOC) content. However NIR reflectance is quite sensitive to external environmental conditions, such as temperature and soil moisture. In the field, the soil moisture content can be highly variable. It is a challenge to find a chemometric method that allows for prediction of soil organic carbon from spectra obtained under field conditions that is insensitive to variable moisture content. This paper utilises an external parameter orthogonalisation (EPO) algorithm to remove the effect of soil moisture from NIR spectra for the calibration of SOC content. The algorithm projects all the soil spectra orthogonal to the space of unwanted variation, and thus the variations of soil moisture can be effectively removed. We designed a protocol with 3 independent datasets to be used for calibration of NIR spectra: (1) the calibration dataset, which contains soil samples with measured spectra and SOC content under standard (or laboratory) condition (air-dried), (2) the EPO development dataset contains spectra under laboratory condition (air-dried samples) and spectra collected under field conditions (varying soil moisture content), and (3) the validation dataset contains spectra collected under field condition and measured SOC content. We conducted experiments using soils at different moisture contents in laboratory conditions. Using the EPO algorithm, we are able to remove the effect of soil moisture from the spectra, which resulted in improved calibration and prediction of SOC content.
|
| [73] |
Validation of ground penetrating radar full-waveform inversion for field scale soil moisture mapping [J].https://doi.org/10.1016/j.jhydrol.2011.12.034 URL [本文引用: 1] 摘要
Ground penetrating radar (GPR) is an efficient method for soil moisture mapping at the field scale, bridging the scale gap between small-scale invasive sensors and large-scale remote sensing instruments. Nevertheless, commonly-used GPR approaches for soil moisture characterization suffer from several limitations and the determination of the uncertainties in GPR soil moisture sensing has been poorly addressed. Herein, we used a proximal GPR method based on full-waveform inversion of ultra-wideband radar data for mapping soil moisture and we evaluated uncertainties in the soil moisture maps by three methods. First, GPR-derived soil moisture uncertainties were computed from GPR data inversions, according to measurements and modeling errors, and to the sensitivity of the electromagnetic model to soil moisture. Second, the repeatability of soil moisture mapping was evaluated. Third, GPR-derived soil moisture was compared with ground-truth measurements (soil core sampling). The proposed GPR method appeared to be highly precise and accurate, with a spatially averaged GPR inversion uncertainty of 0.003902m 3 02m 613 , a repetition uncertainty of 0.016902m 3 02m 613 , and an uncertainty of 0.023302m 3 02m 613 when compared with ground-truth measurements. These uncertainties were mapped and appeared to be related to some local model inadequacies and to small-scale variability of soil moisture. In a soil moisture mapping framework, the interpolation was found to be the main source of the observed uncertainties. The proposed GPR method was proven to be largely reliable in terms of accuracy and precision and appeared to be highly efficient for soil moisture mapping at the field scale.
|
| [74] |
Soil attribute prediction using terrain analysis [J].https://doi.org/10.2136/sssaj1993.03615995005700020026x URL [本文引用: 1] |
| [75] |
Estimating soil moisture at the watershed scale with satellite-based radar and land surface models [J].https://doi.org/10.5589/m04-043 URL [本文引用: 1] 摘要
Spatially distributed soil moisture profiles are required for watershed applications such as drought and flood prediction, crop irrigation scheduling, pest management, and determining mobility with lightweight vehicles. Satellite-based soil moisture can be obtained from passive microwave, active microwave, and optical sensors, although the coarse spatial resolution of passive microwave and the inability to obtain vertically resolved information from optical sensors limit their usefulness for watershed-scale applications. Active microwave sensors such as synthetic aperture radar (SAR) currently represent the best approach for obtaining spatially distributed surface soil moisture at scales of 10 100 m for watersheds ranging from 1 000 to 25 000 km2. Although SAR provides surface soil moisture, the applications listed above require vertically resolved soil moisture profiles. To obtain distributed soil moisture profiles, a combined approach of calibration and data assimilation in soil vegetation atmosphere transfer (SVAT) models based on recent advances in soil physics is the most promising avenue of research. This review summarizes the state of the science using current satellite-based sensors to determine watershed-scale surface soil moisture distribution and the state of combining SVAT models with data assimilation and calibration approaches for the estimation of profile soil moisture. The basic conclusion of this review is that currently orbiting SAR sensors combined with available SVAT models could provide distributed profile soil moisture information with known accuracy at the watershed scale. The priority areas for future research should include image-based approaches for mapping surface roughness, determination of soil moisture in densely vegetated sites, active and passive microwave data fusion, and joint calibration and data assimilation approaches for a combined remote sensing modeling system. For validation, a worldwide in situ soil moisture monitoring program should be implemented. Finally, to realize the full potential of satellite-based soil moisture estimation for watershed applications, it will be necessary to continue sensor development, improve image availability and timely delivery, and reduce image cost.
|
| [76] |
Towards development of on-line soil moisture content sensor using a fibre-type NIR spectrophotometer [J].https://doi.org/10.1016/j.still.2004.03.022 URL [本文引用: 1] 摘要
As the soil moisture content ( w) is a deterministic factor for site-specific irrigation, seeding, transplanting and compaction detection, an on-line measurement system will bring these applications into practice. A fibre-type visible (VIS) and near-infrared (NIR) spectrophotometer, with a light reflectance measurement range of 306.5–1710.9 nm was used to measure w during field operation. The spectrophotometer optical unit was attached to the subsoiler chisel backside to perform the light reflectance measurement from the soil surface on the bottom of the trench opened by the proceeded chisel. The spectrophotometer–optical unit system was calibrated for w under stationary laboratory conditions on samples collected from an Arenic Cambisol field with different soil textures. A partial least square analysis was carried out in order to establish a statistical model relating soil light spectra with the gravimetric w of the 0.005–0.26 kg kg 611 range. This model was validated with the full cross validation method resulting in a small root mean square error of cross validation (RMSECV) of 0.0175 kg kg 611 and a high validation correlation of 0.978. Further validation of the model developed in the laboratory under stationary state showed also a small root mean square error of prediction (RMSEP) of 0.0165 kg kg 611 and a prediction correlation of 0.982. When the NIR sensor-model system was used to determine w, based on on-line field measurement, a relatively larger RMSEP of 0.025 kg kg 611 and lower prediction correlation of 0.75 were found. However, a reasonably similar spatial distribution of w was found between the on-line NIR measurement and oven drying methods. Therefore, the on-line NIR w sensor developed is recommended to provide valuable information towards the site-specific applications in soils.
|
| [77] |
The use of remote sensing in soil and terrain mapping: A review [J].https://doi.org/10.1016/j.geoderma.2010.12.018 URL [本文引用: 2] 摘要
78 Remote sensing offers possibilities for improving current soil databases. 78 Soil attribute retrievals from remote sensing should be used as covariates in DSM. 78 The gap between proximal and remote sensing has to be bridged. 78 We will be seeing future instruments launched soon enhancing the perspectives of DSM. 78 A coherent multidisciplinary method for soil and terrain mapping should be developed.
|
| [78] |
Soil carbon mapping using on-the-go near infrared spectroscopy, topography and aerial photographs [J].https://doi.org/10.1016/j.geoderma.2011.07.017 URL [本文引用: 1] 摘要
78 Pre-processing of NIR data did not improved carbon prediction accuracy in sandy soils. 78 Topographical features improved SC prediction accuracy in aerial data. 78 Aerial data produced higher prediction accuracy than NIR in independent test data sets. 78 Aerial photography with topography is preferable to spectral NIR for SC prediction in sandy soils.
|
| [79] |
Soil surface spectral data from Landsat imagery for soil class discrimination [J].https://doi.org/10.4025/actasciagron.v34i1.12204 URL [本文引用: 1] 摘要
the aim of this study was to develop and test a method to determine and discriminate soil classes in the state of s paulo, brazil, based on spectral data obtained via landsat satellite imagery. satellite reflectance images were extracted from 185 spectral reading points, and discriminant equations were obtained to establish each soil class within the studied area. sixteen soil classes were analyzed, and discriminant equations that comprised tm5/landsat sensor bands 1, 2, 3, 4, 5, and 7 were established. the results showed that this methodology could effectively identify individual soil classes using discriminant analyses of the spectral data obtained from the surface. success rates of > 40% were achieved for 14 of the 16 evaluated soil classes when applying the satellite image data. when the 10 soil classes containing the largest number of minimum cartographic areas were used, the hit rate increased to > 50%, for seven soil classes with a global hit rate of 52%. when the soil classes were grouped based on their parent materials, the hit rate increased to 70%. thus, we concluded that the spectral method for soil classification was efficient.
|
| [80] |
Soil Spectroscopy: An alternative to wet chemistry for soil monitoring [J].https://doi.org/10.1016/bs.agron.2015.02.002 URL [本文引用: 1] |
| [81] |
An empirical model and an inversion technique for radar scattering from bare soil surfaces [J].https://doi.org/10.1109/36.134086 URL [本文引用: 1] 摘要
Not Available
|
| [82] |
Soil organic carbon across scales [J].https://doi.org/10.1111/gcb.12959 URL PMID: 25918852 [本文引用: 2] 摘要
Abstract Mechanistic understanding of scale effects is important for interpreting the processes that control the global carbon cycle. Greater attention should be given to scale in soil organic carbon (SOC) science so that we can devise better policy to protect/enhance existing SOC stocks and ensure sustainable use of soils. Global issues such as climate change require consideration of SOC stock changes at the global and biosphere scale, but human interaction occurs at the landscape scale, with consequences at the pedon, aggregate and particle scales. This review evaluates our understanding of SOC across all these scales in the context of the processes involved in SOC cycling at each scale and with emphasis on stabilizing SOC. Current synergy between science and policy is explored at each scale to determine how well each is represented in the management of SOC. An outline of how SOC might be integrated into a framework of soil security is examined. We conclude that SOC processes at the biosphere to biome scales are not well understood. Instead, SOC has come to be viewed as a large-scale pool subjects to carbon flux. Better understanding exists for SOC processes operating at the scales of the pedon, aggregate and particle. At the landscape scale, the influence of large- and small-scale processes has the greatest interaction and is exposed to the greatest modification through agricultural management. Policy implemented at regional or national scale tends to focus at the landscape scale without due consideration of the larger scale factors controlling SOC or the impacts of policy for SOC at the smaller SOC scales. What is required is a framework that can be integrated across a continuum of scales to optimize SOC management. 2015 John Wiley & Sons Ltd.
|
| [83] |
An assessment of model averaging to improve predictive power of portable vis-NIR and XRF for the determination of agronomic soil properties [J].https://doi.org/10.1016/j.geoderma.2016.05.005 URL [本文引用: 1] 摘要
Many soil science laboratories are now equipped with technology platforms in portable visible near infrared (vis-NIR) and X-ray fluorescence (XRF) spectrometers. These technologies have complementary capabilities, where XRF is known to accurately measure the soil's inorganic element concentration, and vis-NIR has the ability to estimate the soil's organic component and mineralogy suites. In this study data mining was used to estimate soil properties from the vis-NIR spectra, and in a novel way from the XRF spectral data. The prediction outcomes were combined into a single prediction outcome, using formal methods called model averaging procedures. Combining model outcomes derived from spectra using model averaging techniques improves or maintains the prediction status (as ratio of performance to inter-quartile distance) of vis-NIR and XRF models for a wide range of soil properties of agronomic importance. Overall, the relative improvement in %RMSE ranged from 4 to 44%. Weight preference in model averaging was related to the inference of soil chemical and physical properties from vis-NIR and XRF spectra. For example, the weights preference the vis-NIR predictions for soil pH, soil carbon (C), clay, and XRF predictions for most of the elemental soil properties. Based on both the relative improvement in RMSE and RPIQ status, model averaging was found to be suitable for soil pH, soil C (soil organic C (SOC) and total C (TC)), soil texture (sand and clay), CEC and total elements K, Mg, Co, Cr and Mn. Optimum prediction performance for total elements Cu and Zn is achieved by XRF alone. The unreliable RPIQ status for total elements P, S, Mo, Se and exchangeable Ca, Mg, K, and Na derived from vis-NIR and XRF predictions in this study did not improve with model averaging. Overall, Granger-Ramanathan averaging produced similar or better outcomes compared to variance weighted averaging. This model averaging approach is more simple to compute requiring only to fit a simple multiple linear regression model, unlike the VWA approach in which the weighting is estimated for each soil property, and thus in the interests of parsimony is recommended as the model averaging technique to be adopted as protocol. More conventional use of portable XRF in soil analysis is to employ the elemental concentrations measured by the XRF device to predict other soil properties, generally applying multiple linear regression models. When XRF is used in a conventional way to determine elemental concentrations it was demonstrated to be highly reliable for elemental concentrations present in high concentrations, but predictions of elemental content derived from XRF spectra was more effective for elements present in low concentrations. This in turn reduces the capacity of XRF elemental concentrations to be used in the prediction of other soil properties by inference.
|
| [84] |
Surface soil moisture retrievals from remote sensing: Current status, products & future trends [J].https://doi.org/10.1016/j.pce.2015.02.009 URL [本文引用: 4] 摘要
It is evident from this review that there is potential for more accurate estimation of SMC exploiting EO technology, particularly so, by exploring the use of synergistic approaches between a variety of EO instruments. Given the importance of SMC in Earth’s land surface interactions and to a large range of applications, one can appreciate that its accurate estimation is critical in addressing key scientific and practical challenges in today’s world such as food security, sustainable planning and management of water resources. The launch of new, more sophisticated satellites strengthens the development of innovative research approaches and scientific inventions that will result in a range of pioneering and ground-breaking advancements in the retrievals of soil moisture from space.
|
| [85] |
A downscaling approach for SMOS land observations: Evaluation of high-resolution soil moisture maps over the Iberian Peninsula [J].https://doi.org/10.1109/JSTARS.2014.2325398 URL [本文引用: 1] 摘要
The ESA's Soil Moisture and Ocean Salinity (SMOS) mission is the first satellite devoted to measure the Earth's surface soil moisture. It has a spatial resolution of ~ 40 km and a 3-day revisit. In this paper, a downscaling algorithm is presented as a new ability to obtain multiresolution soil moisture estimates from SMOS using visible-to-infrared remotely sensed observations. This algorithm is applied to combine 2 years of SMOS and MODIS Terra/Aqua data over the Iberian Peninsula into fine-scale (1 km) soil moisture estimates. Disaggregated soil moisture maps are compared to 0-5 cm ground-based measurements from the REMEDHUS network. Three matching strategies are employed: 1) a comparison at 40 km spatial resolution is undertaken to ensure SMOS sensitivity is preserved in the downscaled maps; 2) the spatio-temporal correlation of downscaled maps is analyzed through comparison with point-scale observations; and 3) high-resolution maps and ground-based observations are aggregated per land-use to identify spatial patterns related with vegetation activity and soil type. Results show that the downscaling method improves the spatial representation of SMOS coarse soil moisture estimates while maintaining temporal correlation and root mean squared differences with ground-based measurements. The dynamic range of in situ soil moisture measurements is reproduced in the high-resolution maps, including stations with different mean soil wetness conditions. Downscaled maps capture the soil moisture dynamics of general land uses, with the exception of irrigated crops. This evaluation study supports the use of this downscaling approach to enhance the spatial resolution of SMOS observations over semi-arid regions such as the Iberian Peninsula.
|
| [86] |
Applying blind source separation on hyperspectral data for clay content estimation over partially vegetated surfaces [J].https://doi.org/10.1016/j.geoderma.2011.04.019 URL [本文引用: 1] 摘要
Hyperspectral imagery has proven to be a useful technique for mapping soil surface properties. However vegetation cover has a significant influence on spectral reflectance and the applicability of hyperspectral images for soil property estimations decreases when surfaces are partially covered by vegetation. To maximize information extraction from hyperspectral data, we apply a “double-extraction” technique: 1) extraction of a soil reflectance spectrum s , using blind source separation (BSS) techniques from mixed hyperspectral spectra without any information about the proportion of the components in the mixture nor the original spectra that composed the mixed spectra and 2) extraction of soil property contents from the soil reflectance spectrum s by classical chemometric methods. The Infomax algorithm is used as the BSS algorithm for this approach, and the chemometric method is the partial least squares regression (PLSR). The estimated soil property after soil signals extraction is the clay content, and the hyperspectral datasets are from Hymap airborne data. First, experiments were performed using simulated linear spectral mixtures of one soil spectrum and one vegetation spectrum (vineyards). Second, the “double-extraction” method was applied to grids of 302×023 Hymap mixed spectra, which were centered on surfaces partially covered by vineyards. Our simulated experiments and applications to Hymap data show that the BSS concept provides accurate soil reflectance spectra for clay content estimation. The clay content estimations are accurate compared to physico-chemical values (the mean error of estimation is always inferior to 5002g/kg in simulated experiments and predominantly inferior to 9002g/kg in Hymap mixed pixels treatments). We conclude that the “double-extraction” method, which requires no a priori information is a promising method for soil property prediction using hyperspectral imagery over partially vegetated surfaces.
|
| [87] |
Calibration of an on-line sensor for measurement of topsoil bulk density in all soil textures [J].https://doi.org/10.1016/j.still.2012.08.005 URL [本文引用: 1] 摘要
For clay soils, the correlation between the measured and on-line predicted BD was satisfactory ( R 2 02=020.54–0.69), and suggested a large negative CF02>02610.24802Mg02m 613 . For other soil types with lighter soil textures, accuracy of measurements varied ( R 2 02=020.51–0.96), with lower CF values than those calculated for clay soils and ranged between negative and positive values (610.00702Mg02m 613 02<02CF02<020.07902Mg02m 613 ). The ANN analysis resulted in the best model to predict CF as function of MC and soil texture fractions ( R 2 02=020.96), which allowed the utilisation of the on-line measurement system for any field having any texture and average MC. The on-line BD sensor was shown to be capable of predicting field dry BD rapidly for a large number of samples, as compared with traditional methods.
|
| [88] |
Metallic microelements of soil determined by X-ray fluorescence [J]. |
| [89] |
Combining selective sequential extractions, x-ray absorption spectroscopy, and principal component analysis for quantitative zinc speciation in soil [J].https://doi.org/10.1021/es025669f URL PMID: 12523415 [本文引用: 1] 摘要
Selective sequential extractions (SSE) and, more recently, X-ray absorption fine-structure IXAFS) spectroscopy have been used to characterize the speciation of metal contaminants in soils and sediments. However, both methods have specific limitations when multiple metal species coexist in soils and sediments. In this study, we tested a combined approach, in which XAFS spectra were collected after each of 6 SSE steps, and then analyzed by multishell fitting, principal component analysis (PCA) and linear combination fits (LCF), to determine the Zn speciation in a smelter-contaminated, strongly acidic soil. In the topsoil, Zn was predominately found in the smelter-emitted minerals franklinite (60%) and sphalerite (30%) and as aqueous or outer-sphere Zn2+ (10%). In the subsoil, aqueous or outer-sphere Zn2+ prevailed (55%), but 45% of Zn was incorporated by hydroxy-Al interlayers of phyllosilicates. Formation of such Zn-bearing hydroxy-interlayers, which has been observed here for the first time, may be an important mechanism to reduce the solubility of Zn in those soils, which are too acidic to retain Zn by formation of inner-sphere sorption complexes, layered double hydroxides or phyllosilicates. The stepwise removal of Zn fractions by SSE significantly improved the identification of species by XAFS and PCA and their subsequent quantification by LCF. While SSE alone provided excellent estimates of the amount of mobile Zn species, it failed to identify and quantify Zn associated with mineral phases because of nonspecific dissolution and the precipitation of Zn oxalate. The systematic combination of chemical extraction, spectroscopy, and advanced statistical analysis allowed us to identify and quantify both mobile and recalcitrant species with high reliability and precision.
|
| [90] |
Regional-scale soil salinity assessment using Landsat ETM + canopy reflectance [J].https://doi.org/10.1016/j.rse.2015.08.026 URL [本文引用: 1] 摘要
Soil salinization is widely recognized to be a major threat to worldwide agriculture. Despite decades of research in soil mapping, no reliable and up-to-date salinity maps are available for large geographical regions, especially for the salinity ranges that are most relevant to agricultural productivity (i.e., salinities less than 2002dS02m 61021 , when measured as the electrical conductivity of the soil saturation extract). This paper explores the potentials and limitations of assessing and mapping soil salinity via linear modeling of remote sensing vegetation indices. A case study is presented for western San Joaquin Valley, California, USA using multi-year Landsat 7 ETM02+ canopy reflectance and the Canopy Response Salinity Index (CRSI). Highly detailed salinity maps for 22 fields comprising 54202ha were used for ground-truthing. Re-gridded to 3002×023002m, the ground-truth data totaled over 500002pixels with salinity values in the range 0 to 35.202dS02m 61021 . Multi-year maximum values of CRSI were used to model soil salinity. Soil type, meteorological data, and crop type were evaluated as covariates. All considered models were evaluated for their fit to the whole data set as well as their performance in a leave-one-field-out spatial cross-validation. The best performing model was a function of CRSI, crop type (i.e., cropped or fallow), rainfall, and average minimum temperature, with R 2 02=020.728 when evaluated against all data and R 2 02=020.611 for the cross-validation predictions. Broken out by salinity classes, the mean absolute errors (MAE) for the cross-validation predictions were (all units dS02m 61021 ): 2.94 for the 0–2 interval (non-saline), 2.12 for 2–4 (slightly saline), 2.35 for 4–8 (moderately saline), 3.23 for 8–16 (strongly saline), and 5.64 for >0216 (extremely saline). On a per-field basis, the validation predictions had good agreement with the field average (R 2 02=020.79, MAE02=022.4602dS02m 61021 ), minimum (R 2 02=020.76, MAE02=022.2502dS02m 61021 ), and maximum (R 2 02=020.76, MAE02=023.0902dS02m 61021 ) observed salinity. Overall, reasonably accurate and precise high resolution, regional-scale remote sensing of soil salinity is possible, even over the critical range of 0 to 2002dS02m 61021 , where researchers and policy makers must focus to prevent loss of agricultural productivity and ecosystem health.
|
| [91] |
The use of electromagnetic induction to monitor changes in soil moisture profiles beneath different wheat genotypes [J].https://doi.org/10.2136/sssaj2014.09.0360 URL [本文引用: 1] 摘要
There has been recent interest in the use of surface deployed geophysical methods to estimate soil moisture profiles. In this study we applied multi-coil, frequency domain, electromagnetic induction (EMI) geophysical surveys to determine electrical conductivity () profiles of the root zone of four winter wheat (Triticum aestivum) genotypes, grown in randomized block experiment with four replicates. Field measurements of apparent electrical conductivity (a) were obtained at sites with two different soil textures. We used the cumulative sensitivity model to predict EMI conductivity data from the conductivity profile measured with electrical resistivity tomography (ERT) on a subset of the plots we investigated. During the inversion of the EMI data, conductivities were adjusted on all plots so that they were consistent with ERT data. Changes in electrical conductivity of field soil, with depth computed from inversion of EMI data, over the growth period were compared with measured changes in soil water content. Laboratory measurements confirmed a positive correlation between electrical conductivity and soil water content. Between crop emergence and maturity water extraction by the different wheat genotypes reduced water content by up to 30 percent. Comparing changes in electrical conductivity between reference profiles determined shortly after crop emergence, with electrical conductivity profiles at later dates as the crop matured, we were able to use EMI to remotely monitor moisture extraction by the roots of different wheat genotypes, with depth and over time.
|
| [92] |
Soil moisture downscaling algorithm for combining radar and radiometer observations for SMAP mission [C]// |
| [93] |
A parameterized multifrequency-polarization surface emission model [J].https://doi.org/10.1109/TGRS.2005.857902 URL [本文引用: 1] 摘要
This study develops a parameterized bare surface emission model for the applications in analyses of the passive microwave satellite measurements from the Advanced Microwave Scanning Radiometer-Earth Observing System(AMSR-E).We first evaluated the capability of the Advanced Integral Equation Model(AIEM) in simulating wide band and high incidence surface emission signals in comparison with the INRA's field experimental data obtained in 1993.The evaluation results showed a very good agreement.With the confirmed confidence,we generated a bare surface emission database for a wide range of surface dielectric and roughness properties under AMSR-E sensor configurations using the AIEM model.Through the evaluations of the commonly used semi-empirical models with both the AIEM simulated and the field experimental data,we developed a parameterized multi-frequency-polarization surface emission model-the Q_p model.This model relates the effects of the surface roughness on the emission signals through the roughness variable Q_p at the polarization p.The Q_p can be simply described as a single surface roughness property-the ratio of the surface rms.height and the correlation length.The comparison of the emissivity simulations by the Q_p and AIEM models indicated that the absolute error is extremely small at the magnitude of 10~(-3).The newly developed surface emission model should be very useful in modeling,improving our understanding,analyses,and predictions of the AMSR-E measurements.
|
| [94] |
Estimation of bare surface soil moisture and surface roughness parameter using L-band SAR image data [J].https://doi.org/10.1109/36.628792 URL [本文引用: 1] |
| [95] |
Monitoring arsenic contamination in agricultural soils with reflectance spectroscopy of rice plants [J].https://doi.org/10.1021/es405361n URL PMID: 24804926 [本文引用: 1] 摘要
The objective of this study was to explore the feasibility and to investigate the mechanism for rapidly monitoring arsenic (As) contamination in agricultural soils with the reflectance spectra of rice plants. Several data pretreatment methods were applied to improve the prediction accuracy. The prediction of soil As contents was achieved by partial least-squares regression (PLSR) using laboratory and field spectra of rice plants, as well as linear regression employing normalized difference spectral index (NDSI) calculated from fild spectra. For laboratory spectra, the optimal PLSR model for predicting soil As contents was achieved using Savitzky-Golay smoothing (SG), first derivative and mean center (MC) (root-mean-square error of prediction (RMSEP)=14.7 mg kg(-1); r=0.64; residual predictive deviation (RPD)=1.31). For field spectra, the optimal PLSR model was also achieved using SG, first derivative and MC (RMSEP=13.7 mg kg(-1); r=0.71; RPD=1.43). In addition, the NDSI with 812 and 782 nm obtained a prediction accuracy with r=0.68, RMSEP=13.7 mg kg(-1), and RPD=1.36. These results indicated that it was feasible to monitor the As contamination in agricultural soils using the reflectance spectra of rice plants. The prediction mechanism might be the relationship between the As contents in soils and the chlorophyll-a/-b contents and cell structure in leaves or canopies of rice plants.
|
| [96] |
Spectroscopic sensing of soil organic matter content [J].https://doi.org/10.13031/2013.31826 URL [本文引用: 1] 摘要
A prototype real-time soil organic matter sensor has been developed. The sensor consists of compact transmitter and receiver modules which utilize light reflectance to measure percentage organic matter. Laboratory tests were conducted to determine optimal light wavelengths for use with typical landscapes in the midwestern United States. Preliminary field tests have proven successful for soils ranging from below 1% to over 6% organic matter. The sensor promises to be useful for prescription applications of soil applied chemicals
|
| [97] |
Relating soil electrical conductivity to remote sensing and other soil properties for assessing soil salinity in northeast Thailand [J].https://doi.org/10.1002/ldr.752 URL [本文引用: 1] 摘要
Abstract Mapping and monitoring of soil salinity is required to establish its areal extent and also to keep track of changes in salinity in order to formulate appropriate and timely management strategies for reclamation and rehabilitation of such soils. Remote sensing data have been increasingly used in soil-salinity studies as they are not only quicker but are also useful for making realistic predictions. A study was conducted in northeast Thailand to understand the relationship of spectral reflectance and physico-chemical soil properties to electrical conductivity (EC) by using remote sensing data (Landsat; ETM+) and laboratory analysis of soil sample data. Multiple regression analysis was used to examine the relationships between EC and spectral/soil properties and to generate several models. In the case of spectral properties, mid-infrared band (Landsat; band 7) and near-infrared (band 4) were found to be most correlated with the observed EC values of the surface layer of the soil. For the soil properties, chloride (Cl), sodium (Na), phosphorus (P), and sodium adsorption ratio (SAR) were found to be most correlated with observed EC values. Similarly, for the subsurface layer, Cl and P were found to be significant predictors of observed EC values. Copyright 2006 John Wiley & Sons, Ltd.
|
| [98] |
An operational GIS expert system for mapping forest soils [J].
ABSTRACT The successful integration of a Bayesian expert system with a commercially available geographic information system (GIS) (Genamap) is described. The package mapped forest soils into five soil landscape classes by utilizing a digital terrain model and vegetation map, as well as knowledge provided by a soil scientist. It is concluded that the map produced by the expert system was as accurate as the map drawn by the soil scientist, within a 95 percent confidence interval. An overall mapping accuracy of 69.8 percent was achieved for the soil maps produced by the expert system, while the conventionally derived map had an accuracy of 73.6 percent.
|
| [99] |
Visible and near infrared spectroscopy in soil science [J].https://doi.org/10.1016/S0065-2113(10)07005-7 URL [本文引用: 1] |
| [100] |
Prediction of soil organic carbon at the European scale by visible and near infrared reflectance spectroscopy [J].https://doi.org/10.1371/journal.pone.0066409 URL PMID: 23840459 [本文引用: 1] 摘要
Abstract Soil organic carbon is a key soil property related to soil fertility, aggregate stability and the exchange of CO2 with the atmosphere. Existing soil maps and inventories can rarely be used to monitor the state and evolution in soil organic carbon content due to their poor spatial resolution, lack of consistency and high updating costs. Visible and Near Infrared diffuse reflectance spectroscopy is an alternative method to provide cheap and high-density soil data. However, there are still some uncertainties on its capacity to produce reliable predictions for areas characterized by large soil diversity. Using a large-scale EU soil survey of about 20,000 samples and covering 23 countries, we assessed the performance of reflectance spectroscopy for the prediction of soil organic carbon content. The best calibrations achieved a root mean square error ranging from 4 to 15 g C kg(-1) for mineral soils and a root mean square error of 50 g C kg(-1) for organic soil materials. Model errors are shown to be related to the levels of soil organic carbon and variations in other soil properties such as sand and clay content. Although errors are 5 times larger than the reproducibility error of the laboratory method, reflectance spectroscopy provides unbiased predictions of the soil organic carbon content. Such estimates could be used for assessing the mean soil organic carbon content of large geographical entities or countries. This study is a first step towards providing uniform continental-scale spectroscopic estimations of soil organic carbon, meeting an increasing demand for information on the state of the soil that can be used in biogeochemical models and the monitoring of soil degradation.
|
| [101] |
Laboratory, field and airborne spectroscopy for monitoring organic carbon content in agricultural soils [J].https://doi.org/10.1016/j.geoderma.2007.12.009 URL [本文引用: 1] 摘要
The temporal evolution in Soil Organic Carbon (SOC) content is often used in estimations of greenhouse gas fluxes and is an important indicator of soil quality. Regional estimates of SOC changes can only be obtained by analyzing very large number of samples over large areas due to the strong spatial variability in SOC contents. Visible and Near Infrared Spectroscopy (VNIRS) provides an alternative to chemical analyses. The benefits of this technique include a reduction of the sampling processing time, an increase of the number of samples that can be analyzed within time and budget constraints and hence an improvement of the detection of small changes in SOC stocks for a given area. Carbon contents are predicted from spectra through Partial Least Square Regressions (PLSR). The performance of three different instrumental settings (laboratory, field and airborne spectroscopy) has been assessed and their relative advantages for soil monitoring studies have been outlined using the concept of Minimal Detectable Difference. It appears that ground-based spectrometers give Root Mean Square Errors of Cross-Validation similar to the limit of repeatability of a routine SOC analytical technique such as the Walkley and Black method (卤 1聽g C kg 鈭 1). The airborne spectrometer, despite its greater potential to cover large areas during a single flight campaign, has some difficulties to reach such values due to a lower Signal-to-Noise Ratio. Because of its statistical nature, the method and its potential rely on the stability of the calibrations obtained. It appears that calibrations are currently site-specific due to variation in soil type and surface condition. However, it is shown that PLSR can take into account both soil and spectral variation caused by different measuring campaigns and study areas. Further research is needed to develop regional spectral libraries in order to be able to use VNIRS as a robust analytical technique for precisely determining the SOC content and its spatial variation.
|
| [102] |
Assimilating satellite imagery and visible-near infrared spectroscopy to model and map soil loss by water erosion in Australia [J].https://doi.org/10.1016/j.envsoft.2015.11.024 URL [本文引用: 2] 摘要
61Remote sensing, spectroscopy and digital soil mapping were combined to model and map erosion in Australia using the RUSLE.61The potential average soil loss by water erosion in Australia is 1.86 (±0.6) t02ha611y611.61The estimates are the most current for Australia.61Our approach is novel and will be valuable for other large and sparsely sampled areas of the world.
|
| [103] |
Spectral libraries for quantitative analyses of tropical Brazilian soils: Comparing vis-NIR and mid-IR reflectance data [J].https://doi.org/10.1016/j.geoderma.2015.04.017 URL [本文引用: 1] 摘要
Reflectance spectroscopy has great potential to monitor and evaluate soils at large scale; however, its effectiveness in predicting properties from tropical soils still needs to be tested since their mineralogy, organic matter levels, and charge and ion adsorption dynamics are different from temperate soils. Also, it is important to assess the most appropriate spectral range for quantification of specific soil property. Therefore, this study aimed to predict physical, chemical, and mineralogical soil properties using vis–NIR (350–250002nm) and mid-IR (4000–40002cm 61021 ) spectral libraries and statistically compare their modeling performances. We used 1259 soil samples distributed along four Brazilian States. Soil particle size, chemical analyses including macro and micronutrients, and oxides from sulfuric acid digestion were performed. Vis–NIR reflectance data were obtained by the FieldSpec Pro sensor while mid-IR data were collected using the Nicolet 6700 FT-IR sensor. Support Vector Machine was used as multiple regression algorithm and modeling performance was evaluated by R 2 , RMSE and RPIQ. This research presented a complete prediction analysis of soil properties important for survey, classification, and fertility management. Models fit very well (0.7602≤02R 2 02≤020.90 and 2.8102≤02RPIQ02≤025.62) for sand, clay, Al 3+ , H + Al 3+ , CEC, clay activity, Fe 2 O 3 , and TiO 2 predictions, and showed reasonable performance (0.5002≤02R 2 02≤020.73 and 1.8302≤02RPIQ02≤023.78) for OC, Ca, Mg, SB, V%, m%, pH in H 2 O, oxides (Si, Al, and Mn), and Cu and Mn (micronutrients). Phosphorus, potassium and some micronutrients (Fe and B) were not reliably quantified (R 2 02≤020.47 and RPIQ02≤021.83). For both spectral ranges, performance indices were kept in testing steps, and no atypical distribution pattern was identified by residual analysis. Statistically, mid-IR spectral models showed better performance for 60% of the studied properties. For some oxides (Al, Fe, Ti, and Mn), vis–NIR models were better. Models developed from vis–NIR and mid-IR spectral libraries are effective and useful to quantify properties suggesting soil mineralogy, reactivity, fertility and acidity of tropical Brazilian soils; however, mid-IR is the greatest potential spectral range. The excellent results of clay (0.8502≤02R 2 02≤020.88 and 3.8802≤02RPIQ02≤025.56) and sand (0.8502≤02R 2 02≤020.90 and 4.8502≤02RPIQ02≤025.62) modeling prove that at least soil particle size analyses can be efficiently replaced by the reflectance spectroscopy methods.
|
| [104] |
High-resolution space-time quantification of soil moisture along a hillslope using joint analysis of ground penetrating radar and frequency domain reflectometry data [J].https://doi.org/10.1016/j.jhydrol.2015.01.065 URL [本文引用: 1] 摘要
We combined ground-penetrating radar (GPR) and frequency domain reflectometry (FDR) to assess the space–time variability of soil moisture along a hillslope. Time-lapse GPR and FDR measurements were conducted weekly during the period 23/03–08/06/2011 along a cultivated hillslope in the Belgian loam belt. A full-wave GPR model, a soil dielectric mixing model and the Debye equation were combined to directly estimate soil moisture from GPR measurements. Measured GPR data were well reproduced by the full-wave GPR model, resulting in a relatively good agreement between the GPR and FDR-derived soil moisture. Subsequently, we merged the soil moisture obtained from both techniques in a data fusion framework and we investigated its spatial and temporal variability. The results indicate that there was a high correlation between the spatial variability of soil moisture and topography as well as between its temporal variability and rainfall. A temporal stability analysis showed that soil moisture at the footslope is higher and more stable than that at the summits and backslopes. The proposed approach appears to be promising for assessing soil moisture at the hillslope scale with a relatively high space–time resolution.
|
| [105] |
USDA (United States Department of Agriculture). 2016. Rapid Carbon Assessment (RaCA): Methodology, Sampling, and Summary [EB/OL]. [ |
| [106] |
Using data mining to model and interpret soil diffuse reflectance spectra [J].https://doi.org/10.1016/j.geoderma.2009.12.025 URL [本文引用: 1] 摘要
The aims of this paper are: to compare different data mining algorithms for modelling soil visible–near infrared (vis–NIR: 350–250002nm) diffuse reflectance spectra and to assess the interpretability of the results. We compared multiple linear regression (MLR), partial least squares regression (PLSR), multivariate adaptive regression splines (MARS), support vector machines (SVM), random forests (RF), boosted trees (BT) and artificial neural networks (ANN) to estimate soil organic carbon (SOC), clay content (CC) and pH measured in water (pH). The comparisons were also performed using a selected set of wavelet coefficients from a discrete wavelet transform (DWT). Feature selection techniques to reduce model complexity and to interpret and evaluate the models were tested. The dataset consists of 1104 samples from Australia. Comparisons were made in terms of the root mean square error (RMSE), the corresponding R 2 and the Akaike Information Criterion (AIC). Ten-fold-leave-group out cross validation was used to optimise and validate the models. Predictions of the three soil properties by SVM using all vis–NIR wavelengths produced the smallest RMSE values, followed by MARS and PLSR. RF and especially BT were out-performed by all other approaches. For all techniques, implementing them on a reduced number of wavelet coefficients, between 72 and 137 coefficients, produced better results. Feature selection (FS) using the variable importance for projection (FS VIP ) returned 29–31 selected features, while FS MARS returned between 11 and 14 features. DWT–ANN produced the smallest RMSE of all techniques tested followed by FS VIP –ANN and FS MARS –ANN. However, both the FS VIP –ANN and FS MARS –ANN models used a smaller number of features for the predictions than DWT–ANN. This is reflected in their AIC, which suggests that, when both the accuracy and parsimony of the model are taken into consideration, the best SOC model was the FS MARS –ANN, and the best CC and pH models were those from FS VIP –ANN. Analysis of the selected bands shows that: (i) SOC is related to wavelengths indicating C―O, C═O, and N―H compounds, (ii) CC is related to wavelengths indicating minerals, and (iii) pH is related to wavelengths indicating both minerals and organic material. Thus, the results are sensible and can be used for comparison to other soils. A systematic comparison like the one presented here is important as the nature of the target function has a strong influence on the performance of the different algorithms.
|
| [107] |
A global spectral library to characterize the world's soil [J].https://doi.org/10.1016/j.earscirev.2016.01.012 URL [本文引用: 1] 摘要
Soil provides ecosystem services, supports human health and habitation, stores carbon and regulates emissions of greenhouse gases. Unprecedented pressures on soil from degradation and urbanization are threatening agro-ecological balances and food security. It is important that we learn more about soil to sustainably manage and preserve it for future generations. To this end, we developed and analyzed a global soil visibleear infrared (visIR) spectral library. It is currently the largest and most diverse database of its kind. We show that the information encoded in the spectra can describe soil composition and be associated to land cover and its global geographic distribution, which acts as a surrogate for global climate variability. We also show the usefulness of the global spectra for predicting soil attributes such as soil organic and inorganic carbon, clay, silt, sand and iron contents, cation exchange capacity, and pH. Using wavelets to treat the spectra, which were recorded in different laboratories using different spectrometers and methods, helped to improve the spectroscopic modelling. We found that modelling a diverse set of spectra with a machine learning algorithm can find the local relationships in the data to produce accurate predictions of soil properties. The spectroscopic models that we derived are parsimonious and robust, and using them we derived a harmonized global soil attribute dataset, which might serve to facilitate research on soil at the global scale. This spectroscopic approach should help to deal with the shortage of data on soil to better understand it and to meet the growing demand for information to assess and monitor soil at scales ranging from regional to global. New contributions to the library are encouraged so that this work and our collaboration might progress to develop a dynamic and easily updatable database with better global coverage. We hope that this work will reinvigorate our community's discussion towards larger, more coordinated collaborations. We also hope that use of the database will deepen our understanding of soil so that we might sustainably manage it and extend the research outcomes of the soil, earth and environmental sciences towards applications that we have not yet dreamed of.
|
| [108] |
Novel proximal sensing for monitoring soil organic C stocks and condition [J].https://doi.org/10.1021/acs.est.7b00889 URL PMID: 28414454 [本文引用: 1] 摘要
Abstract Soil information is needed for environmental monitoring to address current concerns over food, water and energy securities, land degradation, and climate change. We developed the Soil Condition ANalysis System (SCANS) to help address these needs. It integrates an automated soil core sensing system (CSS) with statistical analytics and modeling to characterize soil at fine depth resolutions and across landscapes. The CSS's sensors include a -ray attenuation densitometer to measure bulk density, digital cameras to image the measured soil, and a visible-near-infrared (vis-NIR) spectrometer to measure iron oxides and clay mineralogy. The spectra are also modeled to estimate total soil organic carbon (C), particulate, humus, and resistant organic C (POC, HOC, and ROC, respectively), clay content, cation exchange capacity (CEC), pH, volumetric water content, available water capacity (AWC), and their uncertainties. Measurements of bulk density and organic C are combined to estimate C stocks. Kalman smoothing is used to derive complete soil property profiles with propagated uncertainties. The SCANS provides rapid, precise, quantitative, and spatially explicit information about the properties of soil profiles with a level of detail that is difficult to obtain with other approaches. The information gained effectively deepens our understanding of soil and calls attention to the central role soil plays in our environment.
|
| [109] |
Laboratory evaluation of a proximal sensing technique for simultaneous measurement of soil clay and water content [J].https://doi.org/10.1016/S0016-7061(98)00023-8 URL [本文引用: 1] 摘要
Precision agriculture, largely the application of information and communications' technologies to in-field data gathering and management, may be regarded as `best practice' for crop growth in the future because of its twin goals of maximising economic returns whilst concurrently minimising environmental impact. The practice of precision agriculture, whether it be to differentially apply fertiliser, seed, pesticide, irrigation or tillage requires detailed knowledge of the spatial and temporal variation of crop yield components, weeds, soil-borne pests and attributes of physical, chemical and biological soil fertility. However, a detailed description of fine or even coarse scale variation in soil properties has always been difficult and costly to perform. Sensing and scanning technologies are currently being developed to more efficiently and economically describe and obtain precise information on the extent and variability of soil attributes which affect crop growth and yield. Combining these technologies with vastly improved ground positioning systems allows detailed mapping of soil resource and crop yield variability which may therefore be an important input for site-specific decision making. Experiments were conducted to design an invasive sensor for real-time, simultaneous measurements of clay, organic matter and soil water content from reflectance of a suitable wavelength or combination of wavelengths in the near infra-red (NIR) portion of the electromagnetic spectrum. Soil materials were prepared with varying amounts of clay, soil water and organic matter according to a response-surface design, and the reflectance spectra measured at 2-nm intervals from 1300 nm to 2500 nm. Response-surface models were fitted to the reflectance data at specified wavelengths. Reflectance showed significant response to clay content and soil water but not to organic matter. A thorough selection procedure using non-linear modelling and root-mean-square-error of prediction was used to derive the four most suitable wavelengths (1600, 1800, 2000 and 2100 nm) for simultaneously measuring clay and soil water content. In a simulation experiment clay content was more accurately predicted than water content.
|
| [110] |
Visible, near infrared, mid infrared or combined diffuse reflectance spectroscopy for simultaneous assessment of various soil properties [J].https://doi.org/10.1016/j.geoderma.2005.03.007 URL [本文引用: 1] 摘要
Historically, our understanding of the soil and assessment of its quality and function has been gained through routine soil chemical and physical laboratory analysis. There is a global thrust towards the development of more time- and cost-efficient methodologies for soil analysis as there is a great demand for larger amounts of good quality, inexpensive soil data to be used in environmental monitoring, modelling and precision agriculture. Diffuse reflectance spectroscopy provides a good alternative that may be used to enhance or replace conventional methods of soil analysis, as it overcomes some of their limitations. Spectroscopy is rapid, timely, less expensive, non-destructive, straightforward and sometimes more accurate than conventional analysis. Furthermore, a single spectrum allows for simultaneous characterisation of various soil properties and the techniques are adaptable for ‘on-the-go’ field use. The aims of this paper are threefold: (i) determine the value of qualitative analysis in the visible (VIS) (400–700 nm), near infrared (NIR) (700–2500 nm) and mid infrared (MIR) (2500–25,000 nm); (ii) compare the simultaneous predictions of a number of different soil properties in each of these regions and the combined VIS–NIR–MIR to determine whether the combined information produces better predictions of soil properties than each of the individual regions; and (iii) deduce which of these regions may be best suited for simultaneous analysis of various soil properties. In this instance we implemented partial least-squares regression (PLSR) to construct calibration models, which were independently validated for the prediction of various soil properties from the soil spectra. The soil properties examined were soil pH Ca , pH w , lime requirement (LR), organic carbon (OC), clay, silt, sand, cation exchange capacity (CEC), exchangeable calcium (Ca), exchangeable aluminium (Al), nitrate–nitrogen (NO 3 –N), available phosphorus (P Col ), exchangeable potassium (K) and electrical conductivity (EC). Our results demonstrated the value of qualitative soil interpretations using the loading weight vectors from the PLSR decomposition. The MIR was more suitable than the VIS or NIR for this type of analysis due to the higher incidence spectral bands in this region as well as the higher intensity and specificity of the signal. Quantitatively, the accuracy of PLSR predictions in each of the VIS, NIR, MIR and VIS–NIR–MIR spectral regions varied considerably amongst properties. However, more accurate predictions were obtained using the MIR for pH, LR, OC, CEC, clay, silt and sand contents, P and EC. The NIR produced more accurate predictions for exchangeable Al and K than any of the ranges. There were only minor improvements in predictions of clay, silt and sand content using the combined VIS–NIR–MIR range. This work demonstrates the potential of diffuse reflectance spectroscopy using the VIS, NIR and MIR for more efficient soil analysis and the acquisition of soil information.
|
| [111] |
Predicting soil properties from the Australian soil visible-near infrared spectroscopic database [J].https://doi.org/10.1111/j.1365-2389.2012.01495.x URL [本文引用: 1] 摘要
<P>There are reflectance spectra in the visible and near infrared wavelengths from some 20 000 archived samples of soil in Australia. Their particular forms depend on absorbances at specific wavelengths characteristic of components in the soil such as water, iron oxides, clay minerals and carbon compounds, and so one might expect to be able to predict soil properties from the spectra. We tested a tree-based technique for the prediction of 24 soil properties. A tree is first constructed by the definition of rules that separate the data into fairly homogeneous groups for any given property on both the absorptions at specified wavelengths and other, categoric, variables. Then within each group the property is predicted from the absorptions at those wavelengths by ordinary least-squares regression. The spectroscopic predictions of the soil properties were compared with actual values in a subset of sample data separated from the whole data for validation. The criteria of success that we used were the root mean squared error (RMSE) to measure the inaccuracy of our predictions, the mean error (ME) to measure their bias and the standard deviation of the error (SDE) to measure their imprecision. We also used the ratio of performance to deviation (RPD), which is the ratio of the standard deviation of the observed values to the RMSE of the predictions; the larger it is the better does the technique perform. We found good predictions (RPD>2) for clay and total sand content, for total organic carbon and total nitrogen, pH, cation exchange capacity, and exchangeable calcium, magnesium and sodium. Several other properties were moderately well predicted (1.5 RPD < 2); they included air-dry water content, volumetric water content at field capacity and wilting point, bulk density, the contents of silt, fine sand and coarse sand, total and exchangeable potassium, total phosphorus and extractable iron. Properties that were poorly predicted (RPD < 1.5) include the carbon-to-nitrogen ratio, available phosphorus and exchangeable acidity. We conclude that even though the predictions are less accurate than direct measurements, the spectra are cheap yet valuable sources of information for predicting values of individual soil properties when large numbers of analyses are needed, for example, for soil mapping.</P>
|
| [112] |
Baseline map of organic carbon in Australian soil to support national carbon accounting and monitoring under climate change [J].https://doi.org/10.1111/gcb.12569 URL PMID: 24599716 [本文引用: 1] 摘要
Abstract We can effectively monitor soil condition-and develop sound policies to offset the emissions of greenhouse gases-only with accurate data from which to define baselines. Currently, estimates of soil organic C for countries or continents are either unavailable or largely uncertain because they are derived from sparse data, with large gaps over many areas of the Earth. Here, we derive spatially explicit estimates, and their uncertainty, of the distribution and stock of organic C in the soil of Australia. We assembled and harmonized data from several sources to produce the most comprehensive set of data on the current stock of organic C in soil of the continent. Using them, we have produced a fine spatial resolution baseline map of organic C at the continental scale. We describe how we made it by combining the bootstrap, a decision tree with piecewise regression on environmental variables and geostatistical modelling of residuals. Values of stock were predicted at the nodes of a 3-arc-sec (approximately 90 m) grid and mapped together with their uncertainties. We then calculated baselines of soil organic C storage over the whole of Australia, its states and territories, and regions that define bioclimatic zones, vegetation classes and land use. The average amount of organic C in Australian topsoil is estimated to be 29.7 t ha(-1) with 95% confidence limits of 22.6 and 37.9 t ha(-1) . The total stock of organic C in the 0-30 cm layer of soil for the continent is 24.97 Gt with 95% confidence limits of 19.04 and 31.83 Gt. This represents approximately 3.5% of the total stock in the upper 30 cm of soil worldwide. Australia occupies 5.2% of the global land area, so the total organic C stock of Australian soil makes an important contribution to the global carbon cycle, and it provides a significant potential for sequestration. As the most reliable approximation of the stock of organic C in Australian soil in 2010, our estimates have important applications. They could support Australia's National Carbon Accounting System, help guide the formulation of policy around carbon offset schemes, improve Australia's carbon balances, serve to direct future sampling for inventory, guide the design of monitoring networks and provide a benchmark against which to assess the impact of changes in land cover, land management and climate on the stock of C in Australia. In this way, these estimates would help us to develop strategies to adapt and mitigate the effects of climate change. 2014 The Authors. Global Change Biology Published by John Wiley & Sons Ltd.
|
| [113] |
Improving the prediction of soil organic matter using visible and near infrared spectroscopy of moist samples [J].https://doi.org/10.1255/jnirs.1184 URL [本文引用: 1] 摘要
Soil moisture reduces the accuracy of in situ measurements of soil properties using visible and near infrared reflectance spectroscopy and limits the application scope of existing soil spectral libraries built from air-dried samples. The preprocessing method of external parameter orthogonalisation (EPO) has been successfully used to improve the prediction of soil organic matter (SOM) in moist samples. However, the traditional strategy of EPO development (EPOI) requires a complex experimental design. In this study, we proposed a new EPO strategy (EPOII) that only uses a single sample but containing various soil moisture content (SMC) levels. Reflectance spectra (350– 2500 nm) of 130 samples with different SMC levels were measured in the laboratory. We built calibration models using air-dried samples and partial least squares regression before and after EPOI and EPOII, which were validated using air-dried samples and moist samples, respectively. For the validation of moist samples, we first classified the SMC into four groups (A: all SMC levels; B: SMC < 0.1 g g611; C: 0.1 < SMC < 0.2 g g611; and D: SMC > 0.2 g g611) and then used a Monte Carlo method to simulate SMC distributions in the field with a result of 500 cases for each SMC group. Before EPO, an apparent decrease in the accuracy of the SOM predictions for moist samples occurred in each SMC group when using the calibration model derived from air-dried samples, compared with that of air-dried samples. Both EPOI and EPOII improved the SOM prediction of moist samples for most scenarios of SMC variations (groups A–C), but did not apply to the scenario with both large SMC variation and high SMC (group D). When considering EPOII, it could be a feasible strategy of EPO implementation for removing moisture effects on SOM prediction using visible and near infrared spectroscopy, although the degree of improvement was less than that from EPOI. Also, EPOII will pave the way as a standard pretreatment especially for soil spectra measured in the field when projection matrices of EPOII have been derived and incorporated in spectroscopy-related software.
|
| [114] |
Remote sensing of soil moisture content, over bare field at 1.4 GHz frequency [J].https://doi.org/10.1029/JC086iC06p05277 URL [本文引用: 1] 摘要
An algorithm for estimating moisture content of a bare soil from the observed brightness temperature at 1.4 GHz is discussed and applied to a limited data base. The method is based on a radiative transfer model calculation, which has been successfully used in the past to account for many observational results, with some modifications to take into account the effect of surface roughness. Besides the measured brightness temperatures, the three additional inputs required by the method are the effective soil thermodynamic temperature, the precise relation between moisture content and the smooth field brightness temperatures and a pair of parameters related to surface roughness. The procedures of estimating surface roughness parameters and of obtaining moisture content from observed brightness temperature are discussed. The algorithm is applied to observations from truck mounted and airborne radiometers. The estimated moisture contents compare favorably with the observations in the top 2 cm layer.
|
| [115] |
Alleviating moisture content effects on the visible near-infrared diffuse-reflectance sensing of soils [J].https://doi.org/10.1097/SSL.0b013e3181b21491 URL [本文引用: 1] 摘要
With rising ambient temperature and atmospheric carbon dioxide levels, there is an urgent need to monitor soil carbon stocks over large regions of the earth. Near-infrared diffuse reflectance sensing (NIRS) of soils, using satellite- or airplane-based instruments, is increasingly regarded as a potential method of choice for this purpose. Considerable research has been devoted to NIRS in the las...
|
| [116] |
Possibilities of reflectance spectroscopy for the assessment of contaminant elements in suburban soils [J].https://doi.org/10.1016/j.apgeochem.2005.01.009 URL [本文引用: 1] 摘要
Due to rapid economic development, high levels of potentially harmful elements are continuously being released into the suburban soils of the Nanjing area, China. Conventional methods for investigating soil potentially harmful element contamination based on raster sampling and chemical analysis are time consuming and relatively expensive. Reflectance spectroscopy within the visible-near-infrared region has been widely used to predict soil constituents due to its rapidity, convenience and accuracy. The objective of this study was to examine the possibility of using soil reflectance spectra as a rapid method to simultaneously assess contaminant metals (Ni, Cr, Cu, Hg, Pb, Zn) and As in the suburban soils of the Nanjing area. One hundred and twenty soil samples were collected for chemical analyses and spectral measurements. Prediction of contaminant elements was achieved by a partial least-square regression (PLSR) approach. According to their relationships with Fe, the seven contaminant elements could be categorized into two groups. The results showed that the prediction accuracy for Group II (Ni, Cr, Cu and Hg) was higher than that for Group I (Pb, Zn and As). This finding was consistent with the fact that the correlation coefficients between Group II and Fe were higher than that between Group I and Fe. It was concluded that element-sorption by spectrally active Fe oxides was the major mechanism by which to predict spectrally featureless contaminant elements. This conclusion was strengthened by the fact that the PLSR regression coefficients, which revealed the most important wavelengths for prediction, were attributed to absorption features of Fe oxides. Future study with real remote sensing data and field measurements are strongly recommended.
|
| [117] |
Assessment of important soil properties related to Chinese Soil Taxonomy based on vis-NIR reflectance spectroscopy [J].https://doi.org/10.1016/j.compag.2017.11.029 URL [本文引用: 1] 摘要
react-text: 175 Diffuse reflectance spectroscopy within the visible and near-infrared (Vis-NIR) range is a promising way for acquisition of soil properties and digital soil mapping. The diffuse reflectance spectroscopy technique is rapid, nondestructive, environment-friendly and more efficient than the conventional analysis method. However, due to the diversity and spatial heterogeneity of soil, the... /react-text react-text: 176 /react-text [Show full abstract]
|
| [118] |
The impact of rainfall magnitude on the performance of digital soil mapping over low-relief areas using a land surface dynamic feedback method [J].https://doi.org/10.1016/j.ecolind.2016.08.023 URL [本文引用: 1] 摘要
Previous studies have demonstrated that the pattern of land surface dynamic feedbacks (LSDF) based on remote sensing images after a rainfall event can be used to derive environmental covariates to assist in predicting soil texture variation over low-relief areas. However, the impact of the rainfall magnitude on the performance of these covariates has not been thoroughly investigated. The objective of this study was to investigate this impact during ten observation periods following rainfall events of different magnitudes (0–4002mm). An individual predictive soil mapping method (iPSM) was used to predict soil texture over space based on the environmental covariates derived from land surface dynamic feedbacks. The prediction error showed strong negative correlation with rainfall magnitude ( Pearson ’ s r between root-mean squared error of prediction and rainfall magnitude02=02610.943 for percentage of sand and 610.883 for percentage of clay). When the rainfall reaches a certain magnitude, the prediction error becomes stable. The recommended rain magnitude (threshold) using LSDF method in this study area is larger than 2002mm for both sand and clay percentage. The predictive maps based on different observed periods with similar rainfall magnitudes show only slight differences. Rainfall magnitude can thus be said to have a significant impact on the prediction accuracy of soil texture mapping. Greater rainfall magnitude will improve the prediction accuracy when using the LSDF. And high wind speed, high evaporation and low relative humidity during the observed periods also improved the prediction accuracy, all by stimulating differential soil drying.
|
| [119] |
Parametric exponentially correlated surface emission model for L-band passive microwave soil moisture retrieval [J].https://doi.org/10.1109/URSIGASS.2014.6929685 URL [本文引用: 1] 摘要
Soil Moisture and Ocean Salinity (SMOS) satellite observations offer a unique resource for near-surface soil moisture retrievals. It could provide multi-angular microwave emission signals at L-band and thus provide an entree to infer soil moisture and roughness for bare soil. In this study, a simple model for simulating the L-band microwave emission from exponentially correlated surface was developed and implemented into soil moisture retrieval algorithm. The approach was based on the parameterization of an effective roughness parameter in relation with surface roughness variables (root mean square height and correlation length) and incidence angle. The parameterization was developed on a large set of simulations by a physical model of the advanced integral equation model (AIEM) over a wide range of geophysical properties. This methodology was then implemented using SMOSREX observations to estimate both soil roughness and surface soil moisture content. Results indicated the model developed in this paper can be very useful in understanding the effects of surface roughness on microwave emission and soil moisture retrieval algorithms from L-band passive microwave observations.
|
| [120] |
Spatial interrelations and multi-scale sources of soil heavy metal variability in a typical urban-rural transition area in Yangtze River Delta region of China [J].https://doi.org/10.1016/j.geoderma.2010.02.020 URL [本文引用: 1] 摘要
Information and knowledge about the spatial variability and multi-scale sources of soil heavy metal variability are important for risk assessment, soil remediation, as well as effective management recommendations. Topsoil samples (0–2002cm) ( n 02=02330) were collected from Luhe County, China. Geostatistical multivariate factorial kriging with robust estimates of variograms, spatial overly analysis and indicator kriging were applied to explore the correlations among soil heavy metals (Cu, Zn, Pb, Cr, Ni, Cd, and Hg) across different spatial scales, identify the sources of spatial variability, and evaluate the potential risk of soil contamination. High variability of soil heavy metals was observed and the correlations among the selected soil heavy metals in the study area depend on spatial scale. Copper, Zn, Cr, and Ni at short-range scale (202km) are mainly controlled by geology (bed rock), while land use greatly affected the long-range variations of Cd and Hg. The strong correlations between Cr and Ni at short- and long-range (1102km) scale indicate that the sources of Cr and Ni are predominately geochemical. However, anthropogenic activities had profound impacts on the concentrations of Cu, Zn, Pb, Cd, and Hg. The potential contamination risk, defined here as measured soil heavy metal concentrations which exceeded the background values of Chinese Environmental Quality Standard for Soils, was observed in Cu, Zn and Pb, and the areas covered 3%, 3.4%, and 1.4%, respectively. The possible sources of Cu and Zn contamination can be considered as the current and historic industrial emissions from Dachang industrial zone, and the potential areas of Pb contamination could be attributed to the industrial emissions from Dachang industrial zone, small factories and heavy traffic flows in/nearby downtown area of the county. While the Hg contamination risk was closely related to the widely use of Hg-related pesticide during 1940–1970s.
|
| [121] |
Revealing the scale-specific controls of soil organic matter at large scale in Northeast and North China Plain [J].https://doi.org/10.1016/j.geoderma.2016.02.006 URL [本文引用: 1] 摘要
Soil organic matter (SOM) plays an important role in terrestrial ecosystem functioning and is closely related to soil fertility and soil health. Better understanding on the spatial distribution of SOM is vital to agriculture and C-cycle management. With the advancement of digital soil mapping framework and data mining technology, selection of environmental covariates become critical to identify the controls of SOM spatial distribution at different scales and were rarely discussed in previous studies. The objectives of this study were to separate the scale-specific variations in SOM and their dominant controls at those scales along two transects from Northeast and North China Plain. Spatial distribution of SOM was separated into seven scale components (six details, D1 through D6 and one approximation, A6) along each transect using the discrete wavelet transform. The largest variations in SOM were separated in A6 (>02128002km) along the northeast transect (91.2% of the total) and D5 (320–64002km) along the north transect (40.6% of the total). Unlike the northeast transect, considerable amount of variations was also separated in other scale components of the north transect. There were no significant correlations between the scale-components of SOM and terrain factors along both the transects. While a relatively stronger correlation was observed between SOM and climatic and vegetation factors along the northeast transect, no significant correlation was observed along the north transect at large scales. This may be due to the long-term cultivation in the Northern China Plain. Principal components 1 and 3 identified from the proximally sensed visible and near infrared (vis–NIR) spectra had strong correlation with SOM along the north transect while the principle component 2 was highly correlated with SOM along the northeast transect. The scale-specific controlling factors at different locations may help in selecting environmental factors in digital soil mapping at different scales for improving mapping accuracy.
|
| [122] |
An estimation method of soil wind erosion in Inner Mongolia of China based on geographic information system and remote sensing [J].https://doi.org/10.1007/s40333-015-0122-0 URL [本文引用: 1] |

/
| 〈 |
|
〉 |
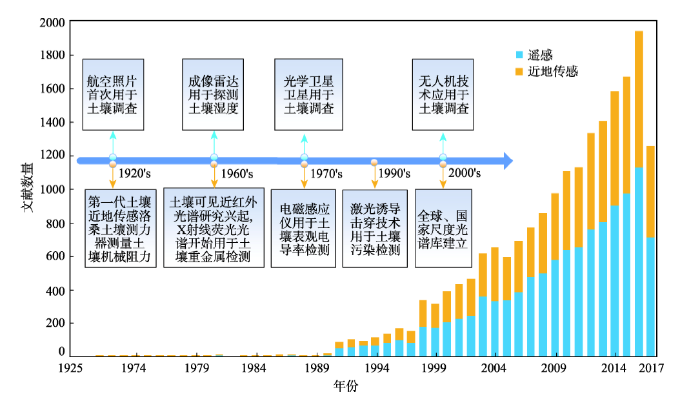
