郑景云 , 方修琦
, 方修琦
ZHENG Jingyun, FANG Xiuqi
通讯作者:
收稿日期: 2018-01-2
修回日期: 2018-01-15
网络出版日期: 2018-01-28
版权声明: 2018 地理科学进展 《地理科学进展》杂志 版权所有
基金资助:
展开
摘要
气候学是自然地理学的重要组成部分;过去气候变化和当代气候增暖的影响与适应研究是中国自然地理学在气候变化领域的2个主要研究方向。本文综述了这2个研究方向的主要进展,包括:分别简述研究的意义、发展历程与主要科学问题;梳理总结中国过去气候变化重建与时空特征分析,历史时期气候变化的影响,全球增暖背景下中国气候区划变动特征,全球增暖对中国自然生态系统、水资源、农业等方面影响的区域差异,气候变化的综合风险区划等方面的前沿进展,特别是在各方面所取得的主要科学认识;以期为未来的深入研究,特别是编制相关领域和学科发展战略提供参考。
关键词:
Abstract
As a key subfield in climatology, the study of climate changes is the research focus of physical geography in China. In this article, we review recent progress in such study, which focused on past climate changes and climate change impacts and adaptations in the context of present global warming. The highlights and results of the studies are summarized, especially on the following issues: reconstruction of past climate in China, analysis of the spatiotemporal patterns of climate changes and their impacts during historical times in China, characteristics of changes on climate regionalization in China under global warming since 1950, regional difference of impacts of recent global warming on natural ecosystems, water resources, and agriculture in China, and comprehensive climate change risk regionalization of China. These results provided a solid scientific basis for forming disciplinary development strategies and further studies of related issues in the field of physical geography in China.
Keywords:
气候学是自然地理学的重要组成部分,也是大气科学分支学科;气候变化是气候学研究的传统领域。20世纪70年代以来,随着全球增暖问题日益突出,气候变化研究得到迅速发展,成为当前国内外学术界乃至社会各界关注的“热点”。与大气科学领域的气候变化研究重点相比,中国自然地理学中的气候变化研究主要侧重于“过去气候变化”和“当代气候增暖的影响与适应”2个研究方向。
过去气候变化是全球变化研究的核心内容,国际上主要通过过去全球变化计划(Past Global Changes, PAGES)推动和引领,重点关注过去2000年、全新世、过去15万年等3个重点时域(Temporal Stream)和年代至万年尺度的变化史实与机制问题(PAGES, 2009),并与CLIVAR计划共同发起了“提供古气候图景:理解气候变率与可预报性的需要”的交叉计划(Duplessy et al, 1994),紧密地将气候变化历史重建与气候变化的时空特征分析及预测等问题结合起来。PAGES大致经历了3个发展阶段(PAGES, 2009):1989-2000年,以代用资料的获取和局地气候变化重建为研究重点;2000-2009年,区域气候变化记录集成为核心;2009年以来,研究重点转为:气候驱动力,地球系统动力学,区域气候变化动力学机制,过去人类—气候—生态系统相互作用;以及定年、代用资料校准与验证、气候模拟、资料集成等4个共性技术问题。
在过去气候变化研究中,自然地理学主要关注全新世以来,特别是过去2000年;因为这一时段是气候从仅受自然驱动到叠加人类影响的衔接时段,对辨识当代增暖是否超出自然变率、区分自然与人为驱动对气候变化的贡献、诊断气候在年代至百年尺度上的变化机制、了解气候多尺度变化的影响与适应特征、预估和应对未来气候变化等有独特价值。当前主要关注以下4方面:①各种代用记录的准确定年、样品的实验分析、记录的解释、校准和验证过程中不确定性的定量分析;②全球框架下区域尺度的气候重建研究;③气候变化与人类活动的相互作用;④气候模式的优化、重建与模拟结果的对比以及年代至百年尺度的气候变化机制。
中国历史悠久,文献记载丰富、记述详尽,且其中拥有大量的气候、灾异及其影响记录,这些记录定年准、指示要素明确;同时,中国地理环境多样,从而孕育、留存了树轮、冰芯、湖芯、石笋和珊瑚等多种类型的高分辨率气候变化自然代用证据;为气候变化重建提供了独特的代用资料基础,使中国成为开展过去全球变化研究的理想区域(国家自然科学基金委员会, 1998)。
经过数代人的努力,中国历史气候变化研究在竺可桢(Chu, 1973)开创的基础上得到了蓬勃发展;不但通过持续查阅正史、地方志、清代和民国档案、日记等史料中的气象、物候、灾异及其影响记载,整编了多部历史气象记录资料集(张德二, 2004; 中国科学院地理科学与资源研究所历史气候资料整编委员会《清实录》编选组, 2016),建立了历史气候变化文献数据库(郑景云等, 2002);而且也采集大量的树轮、冰芯、湖芯、石笋、珊瑚等自然证据,建立发展了利用自然证据进行气候变化研究的新手段,实现了研究方法与国际研究的接轨;同时编制了《中国近五百年旱涝分布图集》(中央气象局气象科学研究院, 1981),出版了中国历史气候变化等专著(张丕远, 1996; 王绍武, 2011)。特别是21世纪以来,其研究内容也拓展至气候变化的定量重建及结果不确定性分析、多源代用资料集成、年—年代—百年尺度气候变化的区域差异及机制诊断、气候变化对历史时期社会经济发展的影响等多个方面,取得了若干有国际显示度的成果。仅最近10余年,就发表了约500篇相关论文,出版了10余部资料集和专著;其中利用史料重建的中国温度序列及部分树轮、冰芯等代用资料被国际古气候数据库收录,在半球、洲际温度序列集成重建、亚洲格网干旱指数数据集研制等工作得到广泛引用(National Research Council, 2006; Osborn et al, 2006; Hegerl et al, 2007; Mann et al, 2008, 2009; Jones et al, 2009; Cook et al, 2010; Christiansen et al, 2011; PAGES2k Consortium, 2013, 2017)。
1.2.1 中国过去2000年气候变化时空特征
利用历史文献及树轮等代用证据,中国学者已重建了一批高分辨率气候变化序列,揭示了过去2000年中国冷暖与干湿变化的若干重要特征,同时结合气候模拟,诊断了历史时期温暖气候的形成机制及其与20世纪增暖的差异。主要认识概括如下:
(1) 冷暖变化基本特征及中世纪气候增暖与当代增暖的机制差异:中国过去2000年温度变化存在50~70年、100~120年、200~250年和准600年等多尺度的周期波动;其间公元1-200、550-760、950-1300年和20世纪等4个时段气候总体温暖,公元210-350、420-530、780-940和1320-1900年等相对寒冷;特别是其中950-1300和1320-1900年分别与北半球其他区域存在的中世纪气候异常期和小冰期基本对应。此外,从温度变幅看,冷暖期间的百年尺度最大温度变幅约达1.0℃,年代际最大变幅约为1.5℃;且出现过数个(如公元660-760、1020-1120、1190-1290年)与20世纪温暖程度基本相似的百年温暖时段(Ge et al, 2013)。
尽管在过去2000年中国曾存在数个与20世纪温暖程度相仿的暖期,但这并不能否认20世纪全球显著增暖主要是因人类活动引发的温室效应增强所致(王绍武等, 2013)。因为区域温度重建结果和模拟均显示:20世纪气候增暖在北半球几乎同步,而中世纪增暖在空间上则存在幅度和位相差异。如在中世纪气候异常期,中国东部尽管都有显著的温暖时段,但东北和东中部的暖期出现时间却不尽一致,且同期青藏高原的温暖程度却极弱;类似特征在北半球的各大洲也同样存在(葛全胜等, 2015)。模拟诊断发现:这一差异可能是因驱动历史暖期和20世纪暖期的主控因子和物理机制不同而致(王志远等, 2014)。中世纪全球增暖主要受太阳短波辐射变化驱动;短波辐射在到达地球后,通过加热下垫面、特别是被海洋吸收后,再发射长波辐射加热大气,这一物理机制称为“海洋恒温机制(thermostat mechanism)”;由于地球下垫面具有显著的不均质性,因而导致增暖出现非均匀特征。但20世纪的全球增暖则主要受温室气体的控制,温室气体在大气中随大气环流均匀扩散并吸收长波辐射直接加热大气,因此其增暖在全球具有较强一致性,这一机制称为“大气稳定机制(stabilization mechanism)”(Liu et al, 2013)。此外,模拟还显示:这两种不同的增暖机制虽均导致全球平均降水量增加,但增加幅度和影响区域差异显著。
(2) 干湿与极端旱涝变化特征:大量的重建结果分析显示,中国多数地区的干湿变化均存在显著的年代际(10~35年)、多年代(40~75年)和世纪(80~150年)等3个尺度的准周期性波动。其中在东部季风区,10~35年周期性变率的方差解释量占总方差的28.6%~33.3%,多年代尺度占13.9%~15.7%,世纪尺度占9.0%~13.0%(Zheng et al, 2017);而且也存在千年尺度的趋势变化。从整个东部季风区总体看,在千年尺度上,干湿变化趋势大致可分为2个阶段:一是公元初-13世纪前期,总的趋势是在波动中逐渐变干;二是13世纪中期后-20世纪,总趋势是在波动中转湿。在多年代和百年尺度上,魏晋南北朝期间(公元221-580年)气候总体偏干,仅240s-290s、410s-420s、460s-520s等时段相对湿润;隋唐期间(公元581-907年)则在过去2000年平均水平上下波动,其中公元600年、730年、820年和900年前后气候偏湿,而660年、760年、800年和850年前后气候偏干;五代-北宋(公元908-1127年)气候总体略偏湿,但存在转干趋势;南宋-元代(公元1128-1368年)气候总体偏干,但在波动中逐渐趋湿;明代(1369-1644年)前期气候湿润,中期(约1430-1550年)持续偏干,中后期虽曾两度(1570和1600年前后)短暂转湿,但趋势为波动转干,明末则出现了自秦汉以来最为严重的持续性干旱事件,并因此引发了社会动荡和大规模的农民起义(Zheng et al, 2014);清代(1645-1911年)气候总体湿润,但年代际波动极为显著,1720、1785、1810和1877年前后还出现了持续性极端干旱;20世纪气候在波动中趋干,其中40年代中期-60年代中期较为湿润,80年代起则再次转干。
从极端旱涝发生状况看,公元101-150、251-300、951-1000、1701-1750、1801-1850和1901-1950年极端大涝多发;301-400、751-800、1051-1150、1501-1550和1601-1650年极端干旱多发;特别是1551-1600年则既多发极端干旱,又多发极端大涝;且在气候总体偏干的12-14世纪和15世纪后期-17世纪中期多发极端连旱;相对偏湿的10-11世纪及17世纪中期以后,多发极端连涝(郑景云等, 2014);特别是其间的大部分持续性干旱事件还得到了位于季风边缘区的万象洞石笋δ18O变化序列(Zhang et al, 2008)的印证。
然而,无论是重建、还是模拟结果都显示,中国东部季风区在各个尺度上的干湿周期变化信号均不稳定,从而使得不同地带的干湿变化对应关系极为复杂,如在年代际和多年代尺度上,华北和江淮地区的干湿在1736-1780和1966-1991年基本同步,但在1785-1834、1886-1915和1942-1960年等时段,则呈反相变化;华北和江南地区的干湿在公元760-870、1180-1390、1490-1650和1730年之后,大致呈反相变化,其他时段的反相却不显著;且3个地区的极端旱、涝事件多发时段也存在差异。
在秦岭西侧至祁连山东段、柴达木盆地东沿等半干旱地区,利用数十个地点树轮资料集成重建的过去千年干湿变化序列(Shao et al, 2010; Yang et al, 2014)显示:11世纪、13世纪中叶、14世纪、16世纪后半叶-17世纪初、18世纪后半叶、19世纪后半叶以及20世纪后半叶气候湿润,其他时段则气候干旱。而在西部干旱区,1000-1350年间相对偏干,1500-1850年降水偏多、气候相对偏湿,近几十年气候则从暖干转为暖湿(Chen et al, 2010)。
1.2.2 历史时期气候变化对中国社会经济发展的影响
历史时期气候变化对社会经济发展的影响是当前全球变化研究的热点与难点之一。集成中国过去温度、干湿与极端旱涝事件等高分辨率重建结果,结合利用丰富历史文献定量重建的丰歉(Yin et al, 2015)、经济(Wei et al, 2015)、财政(Wei et al, 2014)、社会兴衰等级与人口增长率、饥荒指数、农民起义频次、农牧民族战争频次(Fang et al, 2015)等社会经济序列,通过对比分析揭示了气候变化与社会经济发展过程的宏观对应特征,以及极端气候在其中的可能影响(方修琦等, 2017)。主要结论如下:
(1) 中国历史上的社会经济波动与气候变化之间总体上存在“冷抑暖扬”对应关系。即在暖期时,中国往往呈现农业生产发达、经济繁荣、人口增加、国力强盛态势。反之,寒冷阶段往往农业萎缩、经济衰退、国力式微、社会动荡;其中在15次王朝更替中,有11次出现在冷期或相对寒冷时段(葛全胜等, 2011)。
(2) 气候趋势变化主要通过粮食安全和财政收支影响社会经济系统的脆弱性,极端气候事件则多在由暖转冷背景下的社会高脆弱时段触发重大社会危机。这主要是因为:在宏观尺度上,暖期对应的人口增长和经济发展会增加社会对资源环境的压力,使得在气候恶化(特别是转冷或极端旱涝事件增加)时,会导致资源的相对短缺,引发农业生产萎缩、经济衰退,造成人地关系失衡(Zhang et al, 2007; Fang et al, 2015)。如在过去2000年中国社会的9个高风险期中,有8个与气候由暖转冷过程一致,使得以农业为基础的社会系统风险持续上升,导致其间的一些极端气候事件与重大灾害往往成为社会危机和动荡(甚至全面动荡、战争和朝代更替等)的触发因素(Zheng et al, 2014; Wei et al, 2015)。
(3) 人类对气候变化影响的响应手段与方式多样,从农业生产、赈济、移民到社会危机处置等的响应层序,既与气候变化幅度之间存在一定的对应关系,也与社会脆弱性密切相关;其响应过程中增强的适应能力往往还是促进后续社会发展的重要因素(葛全胜等, 2014)。
然而,应当指出的是,气候变化对社会经济发展的影响不仅受制于气候和极端事件变化的冲击,更多地还取决于由人口、经济、文化、体制、管理(governance)等众多人文因素组成的社会经济系统脆弱性;这些人文因素又有其自身变化规律。因而,气候变化对人类社会的影响与人类对气候变化的适应并不是简单的线性“驱动—响应”关系,其中存在着复杂的多尺度(包括时间和空间)相互作用过程和响应特征(IPCC, 2012)。如仅在气候变化对农(牧)业生产影响及其对食物的人均供给量、民生(特别是温饱与饥荒)、社会稳定性等冲击过程中,就存在多种时空尺度的非线性影响与响应过程;每个过程都可能产生抑制或放大作用,且因地、因时而异(葛全胜等, 2014; Fang et al, 2015)。案例分析表明:在明、清两朝后期,气候恶化特征基本相似,即均呈现气候转冷、极端旱涝事件多发等特征,但其对社会影响后果却因二者社会背景和响应策略、方式的不同,而呈现显著差异(Ye et al, 2012; Xiao et al, 2015)。因此,气候与极端事件变化对人类社会的最终冲击后果,不只受气候变化时空差异的影响,还在更大程度上受制于社会组织、政府决策部门和受众等对气候变化冲击的认知及其响应弹性与敏感性;需要通过逐个案例分析,才能深入了解影响与响应在各种时空尺度上的具体过程及其复杂性。然而,目前这方面的案例研究还极少,有待深入开展。
科学评估当代全球增暖的各种影响,是因地制宜应对未来气候变化、保障可持续发展的科学基础,对国家和地区发展战略制定、国家参与全球变化治理等都具有重大意义。
中国自20世纪80年代末开始启动这一领域研究,其中地理学者从气候变化的区域差异入手,主要关注:全球增暖对中国气候和自然综合区划的影响,全球增暖对中国自然生态系统、水资源、农业等影响(包括利、弊两方面)的区域差异,以及气候变化的综合风险区划等问题。
揭示气候区域分异格局变化对全球增暖的响应特征,有助于因地制宜制定区域气候变化适应策略,是各地、各行业适应未来气候变化的重要依据。其中在全球层面上,已有研究(Kalvová et al, 2003)发现:与20世纪初期相比,1961-1990年的热带、温带和寒带分布范围均有一定程度的扩展,分别达1.86%、0.45%和1.31%;而干旱区和极地寒冷带的分布范围则分别缩小了1.89%和1.72%。中国地域广、气候类型多,加之气候变化时空差异显著,因此辨识气候区划及界限变动对全球增暖响应特征一直是中国地理学关注的重点问题,并开展了不少研究,但由于不同研究使用的方法、特别是资料和分析指标不同,因而认识也不一致。
最近,郑景云等(2013a, 2013b)利用1951-2010年中国756个站气象观测日值数据集,对因台站迁移及测站类型变更导致的资料进行了整合与均一性订正;然后按照同一区划原则,采用同一方法和标准,分别编制了1951-1980年、1961-1990年、1971-2000年和1981-2010年等4个时段的全国气候区划;通过不同时段间的对比,定量揭示了20世纪全球增暖背景下的中国气候区划及其主要区划界线的变化特征(廖要明等, 2014)。主要结论如下:
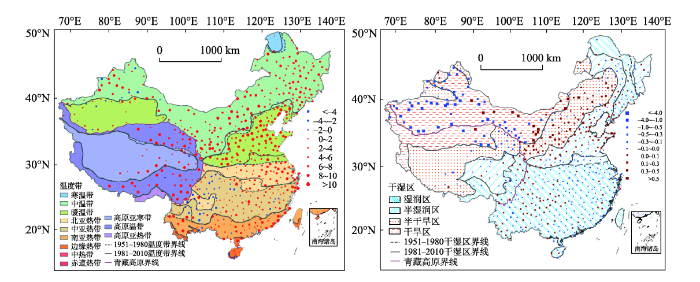
(1) 受1951-2010年间中国气候总体增暖及各地降水波动等的影响,气候区划界线也相应出现了一定程度的变化。与1951-1980年相比,1981-2010年中国有30个气候区出现了水平位置移动或范围盈缩;寒温带界线出现了小幅北移和西缩;暖温带、北亚热带、中亚热带、南亚热带等温度带的北界均出现了北移。其中暖温带北界东段的最大北移幅度和北亚热带北界东段的平均北移幅度均达1个纬度以上,且北亚热带北界已越过淮河;中亚热带北界虽然东段北移幅度较小,但中段最大移动幅度已达2个纬度,从江汉平原南沿移到了江汉平原北部;南亚热带北界西段也北移了0.5~2.0个纬度。同时,青藏高原高原温带范围出现了一定程度的扩展,亚寒带范围则有所缩小(图1a)(卞娟娟等, 2013)。
图1 中国1951-1980年至1981-2010年温度带与日平均气温稳定≥10 ℃日数(a, 红圆点为增加,兰色为减少)和干湿区界线与年干燥度(b, 红方块为转干,蓝色为转湿)变化(
Fig.1 Changes in the demarcation lines for temperature zones and the number of days with daily temperature above 10℃ (red dots: increase, blue dots: decrease) (a), and the demarcation lines for moisture regions and aridity index (red squares: drier, blue squares: wetter) (b) in China from 1951-1980 to 1981-2010 (
(2) 过去60年(1951-2010年)中国的干湿区界线虽仅在淮河流域的半湿润—湿润界线出现了约1个纬度的北移,东北的中温带地区湿润—半湿润东界有所东移,大兴安岭中部与南部的半湿润—半干旱界线有小幅北扩;但大多数区域的干湿状况变化都出现了一定程度的变化(图1b)。其中总体特征为:东北的湿润、半湿润区转干与趋湿并存;北方的半干旱和半湿润及位于内蒙的干旱区总体转干;甘肃、新疆及青藏高原等西部干旱区、半干旱区总体转湿;南方湿润区则是东部(包括江淮、江南和东南等)总体转湿,西南大部总体转干,但云南大部趋干与转湿并存(卞娟娟等, 2013)。
全球增暖的影响涉及自然与社会经济系统的多个方面,特别是水资源、自然生态、农业系统等因与气候变化直接相关而尤被广泛关注,也是中国地理学者涉猎全球变化研究最广泛的领域,涉及局地、区域、全国和年际、年代际等多个时空尺度;主要研究结果已分别被三次气候变化国家报告全面评估(《气候变化国家评估报告》编写委员会, 2007; 《第二次气候变化国家评估报告》编写委员会, 2011;《第三次气候变化国家评估报告》编写委员会, 2015),初步厘清了气候变化对中国若干领域影响的区域利弊(表1)。其中:
表1 当代气候变化对中国若干关键领域影响及区域利(+)弊(-)特征(
Tab.1 Positive and negative impacts of recent climate change on several sectors for different regions in China (Adapted from Wu et al, 2016)
| 受影响 领域/系统 | 主要利弊 | 重点区域的影响利弊 | |
|---|---|---|---|
| 有利 | 不利 | ||
| 水资源 | 冰川融水径流增加 | 径流量总体下降,区域径流变异性加大;旱涝灾害加重 | 华北地区(-)、华中地区(-)、西南地区(-)、西北地区(+) |
| 冰冻圈环境 | 冰川融水增加;冰封期缩短;凌期趋于缓和;渤海及黄海北部海冰冰情总体缓解 | 冰川萎缩、厚度减薄;冰湖溃决风险加大;多年冻土面积萎缩;雪灾频次总体增加;局部海冰冰情年际变率加大 | 东北地区(-)、西南地区(-)、西北地区(+&-) |
| 森林与其他自然生态系统 | 森林总体碳汇增加;温带草原增加;高山牧场草原界线上移 | 北方落叶林减少;西部荒漠化、生产力下降;东部湿地萎缩;局部物种消失 | 东北地区(-)、西南地区(+&-)、西北地区(-) |
| 海岸带和近海环境 | 海洋酸化加剧;赤潮、风暴潮加重;海岸侵蚀强度增大;红树林和珊瑚礁退化 | 华东地区、华南地区 | |
| 农业 | 热量资源增加;复种指数增加 | 耕地质量下降;用水供需矛盾加剧;病虫害加重 | 东北地区(+)、华北地区(+)、华东地区(-)、华中地区(+)、西北地区(+) |
| 环境质量与人体健康 | 水体富营养化及大气污染等加剧;传染病及自然疫源性疾病增加、流行区域扩大 | 华东地区、华中地区 | |
(1) 对水资源影响的主要特征为:西部地区冰川萎缩、融水径流增加(丁永建等, 2009),但全国径流量总体下降,区域径流变异性加大(叶柏生等, 2008; 王国庆等, 2011),其中近50年气候变化对海河流域、黄河中游河川径流减少的贡献率分别达26%和38%(Tang et al, 2008)。在RCP4.5排放情景下, 未来中国水资源南多北少格局不会改变, 北疆和黄河以北地区的水资源量也可能增加,但全国水资源量总体可能减少5%以内,且旱涝灾害频次和强度可能增加,冰湖溃决突发洪水风险加大。由于气候变化很可能导致农业、工业、生活需水增加, 因此中国水资源的区域性供需矛盾可能进一步加剧。
(2) 对自然生态系统影响的主要特征为:北方温带森林分布北移高扩,生长期延长,森林总体碳汇增加(Ren et al, 2011; Liu et al, 2012),温带草原增加,高山牧场草原界线上移;但同时也导致局地生境改变,从而使一些物种发生局地消失,并导致北方落叶林减少,草原分布东移,西部部分区域的荒漠化趋势加剧、自然生产力下降(李英年等, 2003; 严作良等, 2003),东部湿地总体萎缩。未来预估显示:温度上升在3℃以内,气候变化虽然不太可能对中国生态系统可持续性造成不可逆转的影响,且近期的负面效应也不明显,但中、远期却会对生态系统可持续性产生显著的负面影响(Wu et al, 2010)。
(3) 对农业影响的主要特征为:在气候增暖促进复种指数增加的同时,也导致小麦和玉米单产分别下降1.27%和1.73%,并导致耕地质量总体下降,农作物病虫害总体呈加重态势(潘根兴等, 2011; 霍治国等, 2012; Tao et al, 2012)。预估在不考虑主要农作物品种改良和农业生产管理技术进步的背景下,未来因气候增暖导致的区域性水资源短缺将是限制农业可持续发展最主要因素,造成中国粮食自给率下降,粮食安全风险增加(Ye et al, 2013)。
此外,在气候变化对冰冻圈环境、海岸带和近海环境、环境质量与人体健康等的影响方面,也取得了若干重要结果(表1)。
借鉴自然地理学综合区划方法论,辨识中国不同区域的温度、降水变化类型,揭示其变化趋势和波动特征的区域分异,对深入认识不同区域的气候变化与相关的自然灾害及环境风险等,从而更针对性地制定区域适应气候变化的举措具有重要价值;这也是近年地理学者关注的新问题。利用气象观测和未来气候情景模拟资料,史培军等(2014)揭示了过去50年中国气候变化的区域分异特征;吴绍洪等(2017)编制了未来中国气候变化综合风险区划。
(1) 过去50年中国气候变化的区域分异特征。新近研究结果(史培军等, 2014)显示:1961-2010年,中国的温度、降水变化分为5个趋势带14个波动特征区。其中:I是东北—华北暖干趋势带,包括:小兴安岭—长白山—三江平原气温波动增强降水波动减弱区(Ⅰ1)、大兴安岭—辽西山地—科尔沁沙地气温波动减弱降水波动增强区(Ⅰ2)、华北山地—平原—山东半岛气温波动减弱降水波动减弱区(Ⅰ3)、黄土高原—汾河谷地气温波动增强降水量波动减弱区(Ⅰ4);Ⅱ是华东—华中湿暖趋势带,包括:淮河流域—长江下游平原气温波动减弱降水波动增强区(Ⅱ1)、长江下游沿江平原—浙江—赣北—湘东降水波动增强气温波动减弱区(Ⅱ2)、南岭东部丘陵山地气温波动减弱降水波动减弱区(Ⅱ3);Ⅲ是西南—华南干暖趋势带,包括秦岭西部山地—四川盆地气温波动增强降水波动减弱区(Ⅲ1)、秦岭东部—鄂西山地气温波动增强降水波动减弱区(Ⅲ2)、云贵高原—南岭西部山地丘陵降水波动增强气温波动增强区(Ⅲ3);Ⅳ是藏东南—西南湿暖趋势带,包括:Ⅳ藏东南山地—高原降水波动增强气温波动增强区(Ⅳ1)、横断山区山地岭谷降水波动增强气温波动增强区(Ⅳ2);Ⅴ是西北—青藏高原暖湿趋势带,包括:新疆山地—祁连山—内蒙古高原气温波动减弱降水波动增强区(Ⅴ1)、青藏高原气温波动增强降水波动增强区(Ⅴ2)。此外,还有研究根据各地降水变率、降水量的偏度、峰度和频率分布形式、周期波动及突变等变化特征的区域差异,按3个等级进一步划分了中国1961-2010年降水变化区(梁圆等, 2016)。
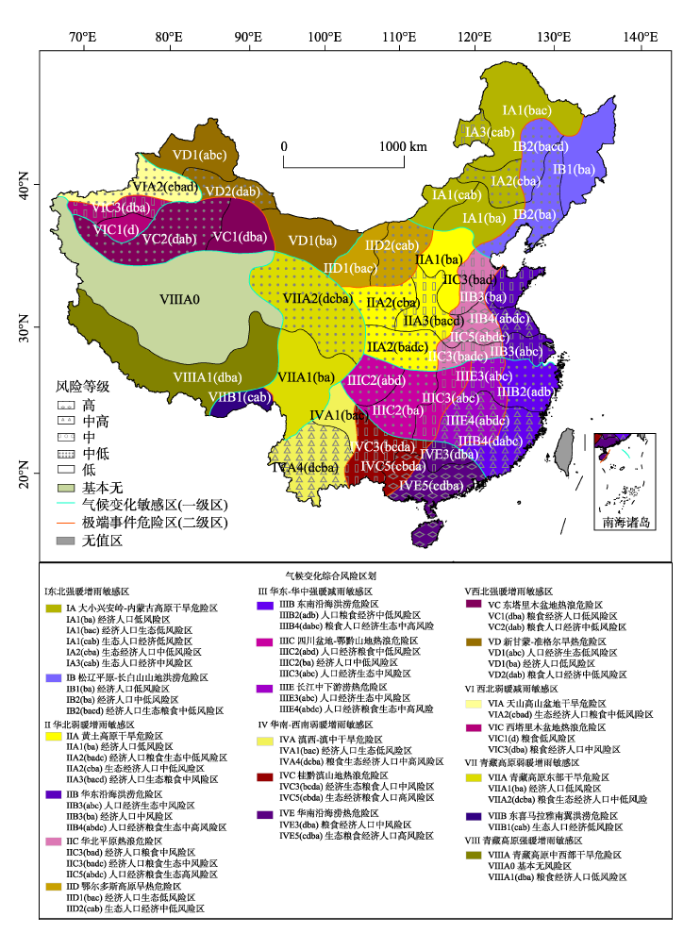
(2) 未来中国气候变化综合风险区划。在依次辨识未来气温变化线性趋势与全国平均的差异及降水增减特征、主要极端事件(干旱、高温热浪和洪涝)的发生频次和程度与二者对各类承险体(粮食生产、生态系统、人口与经济系统)的综合影响等级基础上,吴绍洪等(2017)根据温室气体排放RCP8.5①(①即假定人口增长最快、技术革新水平较低、能源改善十分缓慢,导致持续过高的能源需求以及大量的温室气体排放,2100年辐射强迫高达8.5 W/m2。)
情景下的2021-2050年气候模拟结果,采用3级区划方案进行了中国气候变化未来情景综合风险区划;将中国分为8个气候变化敏感区、19个极端事件危险区和46个综合风险区(图2),揭示了中国气候变化综合风险的区域分异特征。
图2 中国气候变化(2021-2050,RCP8.5)综合风险区划(
Fig.2 China's comprehensive climate change risk regionalization (2021-2050, RCP 8.5) (
结果表明:在RCP8.5情景下,2021-2050年中国将继续增暖,其中增暖趋势强烈的区域主要分布在东北、西北、青藏高原中西部及华东—华中的部分地区;其他地区则呈弱增暖趋势;除新疆天山及南疆盆地、内蒙大部及长江以南至南岭以北的区域降水减少外,其他大部分地区的降水均增加。同时,全国多数地区的干旱、洪涝和高温热浪危险性增高。其中,内蒙古南部、黄土高原、西南南部、新疆北部、青海省及西藏西部是干旱危险性增高最大的区域;华北内陆、华东内陆、四川盆地、华南、内蒙古西部、准格尔盆地和塔里木盆地等为高温热浪高危险区;而洪涝高危险区则主要分布在东部沿海、长江中下游平原、华南地区及东喜马拉雅山南翼。其中,在鄂尔多斯及其西北侧的新甘蒙—准格尔等地,则是干旱和高温热浪的危险性同时增高;长江中下游至华南沿海等地,洪涝和高温热浪危险性均增高。
综合考虑区域粮食生产、生态系统、人口与经济系统脆弱性与暴露度,以及未来增暖强弱、降水增减和干旱、高温热浪、洪涝等主要极端事件对其的共同影响,可以看出,2021-2050年中国气候变化综合风险最高的区域分别为:华北平原中南部增暖增雨极端气候加剧与人口经济粮食高风险区[IIC5(abd)],华南西部增暖增雨热浪加剧、生态经济粮食人口高风险区[IVC5(cbda)],华南沿海增暖增雨干旱热浪加剧、生态粮食经济人口高风险区[IVE5(cdba)];中高风险的区域分别为:华东沿海增暖增雨洪涝加剧、人口经济粮食生态中高风险区[IIB4(abdc)],东南沿海增暖减雨洪涝加剧、粮食人口经济生态中高风险区[IIIB4(dabc)],长江中下游增暖减雨洪涝热浪加剧、人口经济粮食生态中高风险区[IIIE4(abdc)],滇西—滇中增暖增雨干旱加剧、粮食生态经济人口中高风险区[IVA4(dcba)]。这些认识可为国家因地制宜地应对未来气候变化风险提供了科学参考。
本文依据中国自然地理学在气候变化领域的研究成果,特别是近10余年来发表的文献,综述了过去气候变化和当代气候增暖的影响与适应2个方向研究的前沿进展,总结其在中国过去气候变化重建与时空特征分析,历史时期气候变化的影响,全球增暖背景下中国气候区划变动特征,全球增暖对中国自然生态系统、水资源、农业等方面影响的区域差异,气候变化的综合风险区划等问题研究所取得的主要科学认识。这些认识为中国编制三次气候变化国家评估报告(《气候变化国家评估报告》编写委员会, 2007; 《第二次气候变化国家评估报告》编写委员会, 2011; 《第三次气候变化国家评估报告》编写委员会, 2015)、应对未来气候变化提供了重要依据,其中部分结果还被IPCC评估报告(IPCC, 2001, 2007, 2013)引用,得到了国际同行的认可。
目前,国家自然科学基金委员会和中国科学院正在联合开展自然地理学的学科发展战略研究;系统梳理学科研究现状与前沿进展是其重要内容,也是进一步编制学科发展规划、深入开展相关问题研究的基础。由于自然地理学研究分支学科多,涉及领域广、研究方向多,特别是随着气候系统和地球系统科学的相继创立与发展,多学科间的相互交叉和渗透日益显著,使气候学研究内容得到迅速拓展;且随着全球增暖问题日益突出,使得气候变化不仅成为气候学研究的主要问题,也成为其他多个科学研究关注的“热点”。在系统梳理其前沿进展、分析发展趋势基础上,根据自然地理学研究的区域性、综合性强的特点,进一步发挥气候变化领域多学科交叉特征显著的优势,深入开展过去气候变化和当代全球气候变化影响问题研究,结合科学技术和经济社会的发展需求,培育新的学科增长点,既是推动气候学研究发展的机遇,也是气候学研究面临的新挑战。展望未来,我们认为,中国自然地理学中的气候变化研究,应在深入开展上述各个问题研究基础上,将过去和现代气候变化研究与未来应对研究融为一体,同时将研究视野拓展至“全球”,以研究气候系统变化的阈值(Thresholds)、反转点(Tipping Points)与多重均衡(Multiple Equilibria),气候变化和极端事件风险的区域差异及高风险区识别、温暖气候应对等新“热点”问题为纽带,开展更综合的交叉研究,与其他学科共同努力,将气候变化研究推向新高度,为推动“一路一带”共建、参与全球气候环境治理等作出新贡献。
The authors have declared that no competing interests exist.
| [1] |
1951-2010年中国主要气候区划界线的移动 [J].The shift on boundary of climate regionalization in China from 1951 to 2010 [J]. |
| [2] |
|
| [3] |
|
| [4] |
冰冻圈变化与全球变暖: 我国面临的影响与挑战 [J].https://doi.org/10.3969/j.issn.1009-2412.2009.03.002 URL [本文引用: 1] 摘要
本文从冰川的水文水资源效应、冻土的生态、气候和工程效应、积雪的水文及气候效应等方面论述了冰冻圈在我国社会经济发展中的影响与重要作用。在此基础上,着重根据近40年来我国冰冻圈变化的实际情况,论述了冰冻圈变化对水资源、生态、工程、灾害和气候所产生的一些影响。最后根据国内外冰冻圈研究发展趋势,总结了我国冰冻圈研究所面临的机遇、挑战与发展建议。
Cryosphere change and global warming: Impact and challenges in China [J].https://doi.org/10.3969/j.issn.1009-2412.2009.03.002 URL [本文引用: 1] 摘要
本文从冰川的水文水资源效应、冻土的生态、气候和工程效应、积雪的水文及气候效应等方面论述了冰冻圈在我国社会经济发展中的影响与重要作用。在此基础上,着重根据近40年来我国冰冻圈变化的实际情况,论述了冰冻圈变化对水资源、生态、工程、灾害和气候所产生的一些影响。最后根据国内外冰冻圈研究发展趋势,总结了我国冰冻圈研究所面临的机遇、挑战与发展建议。
|
| [5] |
中国历史时期气候变化对社会发展的影响 [J].https://doi.org/10.7605/gdlxb.2017.04.057 URL [本文引用: 1] 摘要
历史时期气候变化对社会发展的影响与人类适应问题,是当前全球变化领域的研究热点之一。近年来,在利用丰富的历史文献资料研究中国历史时期(特别是过去2000年时段)气候变化与人类社会相互作用的过程机理方面取得了一系列新成果。本文将其归纳为3个方面:理论上,构建了基于粮食安全的气候影响传递过程分析框架;方法上,实现了服务于气候变化影响研究的、基于语义差异的历史社会经济序列定量重建;科学认识上,总结出"冷抑暖扬"而又福祸相依的宏观韵律。在此基础上,对未来研究需要进一步深化的方向进行了展望。
Social impacts of climate change on the history of China [J].https://doi.org/10.7605/gdlxb.2017.04.057 URL [本文引用: 1] 摘要
历史时期气候变化对社会发展的影响与人类适应问题,是当前全球变化领域的研究热点之一。近年来,在利用丰富的历史文献资料研究中国历史时期(特别是过去2000年时段)气候变化与人类社会相互作用的过程机理方面取得了一系列新成果。本文将其归纳为3个方面:理论上,构建了基于粮食安全的气候影响传递过程分析框架;方法上,实现了服务于气候变化影响研究的、基于语义差异的历史社会经济序列定量重建;科学认识上,总结出"冷抑暖扬"而又福祸相依的宏观韵律。在此基础上,对未来研究需要进一步深化的方向进行了展望。
|
| [6] |
|
| [7] |
中国历史时期气候变化影响及其应对的启示 [J].https://doi.org/10.11867/j.issn.1001-8166.2014.01-0023 Magsci [本文引用: 2] 摘要
<p>气候变化的社会影响是当前全球变暖影响研究的一个重要领域。以古鉴今,历史上应对气候变化的经验和教训可以为现代人类应对以全球变暖为突出标志的气候变化挑战提供宝贵的借鉴。总结中国历史气候变化对社会影响研究领域的成果,归纳得到了历史时期气候变化对中国社会发展影响的若干认识及其对适应未来气候变化的启示。主要结论是:历史气候变化影响的总体特征是“冷抑暖扬”,但影响与响应存在区域差异;社会经济的衰落与百年尺度的气候由暖转冷呈现同期性,与暖期相伴的社会快速发展会增加社会对资源、环境需求的压力,导致社会脆弱性加大;历史上应对气候变化策略因时、因地、因主体而异;而以政府为主导的主动因地制宜适应是应对气候变化的有效策略。</p>
Learning from the historical impacts of climatic change in China [J].https://doi.org/10.11867/j.issn.1001-8166.2014.01-0023 Magsci [本文引用: 2] 摘要
<p>气候变化的社会影响是当前全球变暖影响研究的一个重要领域。以古鉴今,历史上应对气候变化的经验和教训可以为现代人类应对以全球变暖为突出标志的气候变化挑战提供宝贵的借鉴。总结中国历史气候变化对社会影响研究领域的成果,归纳得到了历史时期气候变化对中国社会发展影响的若干认识及其对适应未来气候变化的启示。主要结论是:历史气候变化影响的总体特征是“冷抑暖扬”,但影响与响应存在区域差异;社会经济的衰落与百年尺度的气候由暖转冷呈现同期性,与暖期相伴的社会快速发展会增加社会对资源、环境需求的压力,导致社会脆弱性加大;历史上应对气候变化策略因时、因地、因主体而异;而以政府为主导的主动因地制宜适应是应对气候变化的有效策略。</p>
|
| [8] |
2015. 过去2000年全球典型暖期的形成机制及其影响 [J].https://doi.org/10.3969/j.issn.1009-2412.2015.02.004 URL [本文引用: 1] 摘要
通过对中国不同地区气候序列重建与暖期气候特征、气候驱动因子变化分析与典型暖期成因机制模拟诊断、暖期气候对中国社会经济的影响与人类适应、北半球温度变化及典型暖期协同特征等问题的研究,发现:(1)20世纪气候增暖在过去2000年中并非空前,但20世纪气候增暖在北半球几乎同步,而中世纪增暖在空间上则存在幅度和位相差异;这主要是因为20世纪全球增暖主要受温室气体增加驱动的"大气稳定机制"、而中世纪增暖主要受太阳短波辐射变化驱动的"海洋恒温机制"所致.(2)与2008年初中国南方"雨雪冰冻"相似的极端寒冷事件可能对温度年代际变化有早期预警意义,当前的"增暖停滞"可能是自然变率导致的气候由暖转冷的一个早期信号.(3)中国历史上的社会经济波动与气候变化之间存在"冷抑暖扬"的对应特征;但与暖期相伴的社会经济发展与人口膨胀也增加了对资源与环境的压力,使得在出现温度下降、降水减少等重大气候转折时,容易导致人地关系失衡、甚至触发社会危机.这些结果增进了对年代至百年尺度气候变化特征与机制的理解,也对我国适应未来气候变化具有参考价值.
Forcing and impacts of warm periods in the past 2000 years [J].https://doi.org/10.3969/j.issn.1009-2412.2015.02.004 URL [本文引用: 1] 摘要
通过对中国不同地区气候序列重建与暖期气候特征、气候驱动因子变化分析与典型暖期成因机制模拟诊断、暖期气候对中国社会经济的影响与人类适应、北半球温度变化及典型暖期协同特征等问题的研究,发现:(1)20世纪气候增暖在过去2000年中并非空前,但20世纪气候增暖在北半球几乎同步,而中世纪增暖在空间上则存在幅度和位相差异;这主要是因为20世纪全球增暖主要受温室气体增加驱动的"大气稳定机制"、而中世纪增暖主要受太阳短波辐射变化驱动的"海洋恒温机制"所致.(2)与2008年初中国南方"雨雪冰冻"相似的极端寒冷事件可能对温度年代际变化有早期预警意义,当前的"增暖停滞"可能是自然变率导致的气候由暖转冷的一个早期信号.(3)中国历史上的社会经济波动与气候变化之间存在"冷抑暖扬"的对应特征;但与暖期相伴的社会经济发展与人口膨胀也增加了对资源与环境的压力,使得在出现温度下降、降水减少等重大气候转折时,容易导致人地关系失衡、甚至触发社会危机.这些结果增进了对年代至百年尺度气候变化特征与机制的理解,也对我国适应未来气候变化具有参考价值.
|
| [9] |
|
| [10] |
季节性变暖对中国农作物病虫害的影响 [J].https://doi.org/10.3864/j.issn.0578-1752.2012.11.005 URL Magsci [本文引用: 1] 摘要
基于已有研究成果,采用农作物病虫害发生危害时空变化对季节性变暖时空变化响应事实检测的方法,系统分析和汇总季节性变暖对农作物病虫害影响的已有观测事实及其变化规律性,提出其影响的最新认知,并对今后的发展方向进行展望。已有影响事实检测表明:暖冬可使病虫进入越冬阶段推迟,延长病菌冬前侵染、冬中繁殖时间,降低害虫越冬死亡率,增加冬后菌源和虫源基数;病虫害发生期、迁入期、危害期提前;越冬北界北移、海拔上限高度升高;持续暖冬可使冬后虫源基数显著增加。与常年相比,全国性暖冬年冬中病菌繁殖侵染率可比冬前增加50%以上、冬中害虫存活率可达常年的1—2倍,冬后菌源、虫源基数增加1倍以上;持续暖冬冬后虫源基数可达常年的5倍以上;病害始见期、虫害发生期提前5 d以上,最早可分别提前20、30 d以上;稻飞虱越冬北界北移2—4个纬度,小麦条锈病越冬海拔上限高度升高100—300 m。暖春有利于病虫害危害期提前、扩展速度加快、发生程度加重。炎夏可使一些病菌越夏的海拔下限高度增加、面积和菌量减少,一些害虫发育历期延长、死亡率增加。暖秋有利于害虫滞留危害,发生代数可比常年增加1个代次。季节性变暖对农作物病虫害影响的时空变化及其规律性、发生与灾变的影响预估、风险评估及适应对策将是未来需要重点解决的关键问题。
Impacts of seasonal climate warming on crop diseases and pests in China [J].https://doi.org/10.3864/j.issn.0578-1752.2012.11.005 URL Magsci [本文引用: 1] 摘要
基于已有研究成果,采用农作物病虫害发生危害时空变化对季节性变暖时空变化响应事实检测的方法,系统分析和汇总季节性变暖对农作物病虫害影响的已有观测事实及其变化规律性,提出其影响的最新认知,并对今后的发展方向进行展望。已有影响事实检测表明:暖冬可使病虫进入越冬阶段推迟,延长病菌冬前侵染、冬中繁殖时间,降低害虫越冬死亡率,增加冬后菌源和虫源基数;病虫害发生期、迁入期、危害期提前;越冬北界北移、海拔上限高度升高;持续暖冬可使冬后虫源基数显著增加。与常年相比,全国性暖冬年冬中病菌繁殖侵染率可比冬前增加50%以上、冬中害虫存活率可达常年的1—2倍,冬后菌源、虫源基数增加1倍以上;持续暖冬冬后虫源基数可达常年的5倍以上;病害始见期、虫害发生期提前5 d以上,最早可分别提前20、30 d以上;稻飞虱越冬北界北移2—4个纬度,小麦条锈病越冬海拔上限高度升高100—300 m。暖春有利于病虫害危害期提前、扩展速度加快、发生程度加重。炎夏可使一些病菌越夏的海拔下限高度增加、面积和菌量减少,一些害虫发育历期延长、死亡率增加。暖秋有利于害虫滞留危害,发生代数可比常年增加1个代次。季节性变暖对农作物病虫害影响的时空变化及其规律性、发生与灾变的影响预估、风险评估及适应对策将是未来需要重点解决的关键问题。
|
| [11] |
祁连山海北高寒湿地气候变化及植被演替分析 [J].https://doi.org/10.3969/j.issn.1000-0240.2003.03.001 URL Magsci [本文引用: 1] 摘要
分析了近40a海北高寒湿地区域气候变化特征,以及近期湿地退化和植被演替的情况.结果表明:祁连山海北地区自1957年以来年平均气温以0.157℃·10a<sup>-1</sup>的倾向率升高,年降水量约以1859mm·10a<sup>-1</sup>的倾向率递减,年平均地温比同期气温的增加更为迅速,表现出海北地区气候及土壤性状均向干暖化趋势发展,特别是土壤干暖化程度尤为明显.由于人类活动加剧影响,超载过牧,原生植被遭受破坏,草场退化严重,地表潜在蒸散力加大.深层的多年冻土退化,冻胀草丘坍塌,导致湿地植被发生变化,使沼泽化草甸向典型草甸演替.不同年度调查结果表明,高寒湿地植被在气候干暖化趋势的加剧影响下,植物群落组成发生变异,物种多样性、生态优势度均比湿地原生植被的物种有增多的趋势.原生适应寒冷、潮湿生境的藏嵩草为主的草甸植被类型逐渐退化,有些物种甚至消失,而被那些寒冷湿中生为主的典型草甸类型所替代.组成植物群落的湿中生种类减少,中生种类(如线叶嵩草)大量增加,群落盖度相对降低,群落生产量大幅度下降.
Analysis of vegetation succession and climate change in Haibei Alpine Marsh in the Qilian Mountains [J].https://doi.org/10.3969/j.issn.1000-0240.2003.03.001 URL Magsci [本文引用: 1] 摘要
分析了近40a海北高寒湿地区域气候变化特征,以及近期湿地退化和植被演替的情况.结果表明:祁连山海北地区自1957年以来年平均气温以0.157℃·10a<sup>-1</sup>的倾向率升高,年降水量约以1859mm·10a<sup>-1</sup>的倾向率递减,年平均地温比同期气温的增加更为迅速,表现出海北地区气候及土壤性状均向干暖化趋势发展,特别是土壤干暖化程度尤为明显.由于人类活动加剧影响,超载过牧,原生植被遭受破坏,草场退化严重,地表潜在蒸散力加大.深层的多年冻土退化,冻胀草丘坍塌,导致湿地植被发生变化,使沼泽化草甸向典型草甸演替.不同年度调查结果表明,高寒湿地植被在气候干暖化趋势的加剧影响下,植物群落组成发生变异,物种多样性、生态优势度均比湿地原生植被的物种有增多的趋势.原生适应寒冷、潮湿生境的藏嵩草为主的草甸植被类型逐渐退化,有些物种甚至消失,而被那些寒冷湿中生为主的典型草甸类型所替代.组成植物群落的湿中生种类减少,中生种类(如线叶嵩草)大量增加,群落盖度相对降低,群落生产量大幅度下降.
|
| [12] |
中国近50年降水量变化区划(1961-2010年) [J].
基于中国537个气象站点1961—2010年的年降水量数据,运用滑动概率分布模型、小波分析和Mann-Kendall检验法,结合中国地形特点,从降水量均值的变化、变率的变化、频率分布形式的变化、突变特征以及周期变化5个方面来分析中国降水量的变化特征和区域差异,构建具体的指标体系,对中国降水量变化进行区划。结果表明,中国降水量变化存在明显的区域差异,根据这些差异可以将中国划分为3个变率变化带、10个平均降水量变化区、35个周期变化亚区。
Regionalization of the annual precipitation change in the last 50 years in China (1961-2010) [J].
基于中国537个气象站点1961—2010年的年降水量数据,运用滑动概率分布模型、小波分析和Mann-Kendall检验法,结合中国地形特点,从降水量均值的变化、变率的变化、频率分布形式的变化、突变特征以及周期变化5个方面来分析中国降水量的变化特征和区域差异,构建具体的指标体系,对中国降水量变化进行区划。结果表明,中国降水量变化存在明显的区域差异,根据这些差异可以将中国划分为3个变率变化带、10个平均降水量变化区、35个周期变化亚区。
|
| [13] |
|
| [14] |
气候变化对中国农业生产的影响 [J].Impacts of climate change on agricultural production of China [J]. |
| [15] |
|
| [16] |
中国气候变化区划(1961-2010年) [J].Climate change regionalization in China (1961-2010) [J]. |
| [17] |
中国不同气候区河川径流对气候变化的敏感性 [J].
利用一个简单的月水量平衡模型,模拟了位于中国不同气候区的21个典型流域的径流量过程,采用假定的气候情景,分析了河川径流量对不同气候变化的敏感性。结果表明,所采用的月水量平衡模型能够较好地模拟不同气候区的月流量过程,21个典型流域的Nash-Sutcliffe模型效率系数大多超过65%,水量平衡误差也均控制在1%以内。黄河以北干旱半干旱地区的典型流域径流量对气温和降水变化的响应敏感,其次为华中、华南半湿润区和湿润区,西部高寒山区径流对气候变化的响应最弱。因此,中国适应气候变化的重点应集中在干旱半干旱地区。
2011. The sensitivity of runoff to climate change in different climatic regions in China [J].
利用一个简单的月水量平衡模型,模拟了位于中国不同气候区的21个典型流域的径流量过程,采用假定的气候情景,分析了河川径流量对不同气候变化的敏感性。结果表明,所采用的月水量平衡模型能够较好地模拟不同气候区的月流量过程,21个典型流域的Nash-Sutcliffe模型效率系数大多超过65%,水量平衡误差也均控制在1%以内。黄河以北干旱半干旱地区的典型流域径流量对气温和降水变化的响应敏感,其次为华中、华南半湿润区和湿润区,西部高寒山区径流对气候变化的响应最弱。因此,中国适应气候变化的重点应集中在干旱半干旱地区。
|
| [18] |
|
| [19] |
|
| [20] |
过去2000年全球典型暖期特征与机制的模拟研究 [J].https://doi.org/10.3969/j.issn.1001-7410.2014.06.02 URL Magsci [本文引用: 1] 摘要
<p>本文利用美国国家大气研究中心(NCAR)的通用地球系统模式(Co mmunity Earth System Model, 简称CESM)的低分辨率版本(CESM1.0.3, T31_g37)在国际国内率先进行了多组过去2000年瞬变积分模拟试验, 在与历史重建资料和观测资料进行对比验证的基础上, 对过去2000年中的典型暖期(中世纪暖期与现代暖期)的特征和成因机制进行了初步探讨, 结果表明: 中世纪暖期太阳辐射加强是导致其"暖化"的主要原因之一, 而温室气体浓度的激增是现代全球变暖的最主要原因; 在中世纪暖期, 自然因子(包括太阳辐射和火山活动)对降水量的影响之和比温室气体的影响高一个数量级; 而在现代暖期, 温室气体对降水量的影响比自然因子(包括太阳辐射和火山活动)对降水量的影响之和高一个数量级; 在不同外强迫条件下的海表温度变化在热带太平洋区域截然不同, 即自然因子影响下为类-拉尼娜态, 而温室气体影响下为类-厄尔尼诺态; 无论在中世纪暖期还是现代暖期, 相对于1000~1850年的平均情况, 沃克(Walker)环流均处于增强状态。</p>
Modeling study on the characteristics and mechanisms of global typical warm periods over the past 2000 years [J].https://doi.org/10.3969/j.issn.1001-7410.2014.06.02 URL Magsci [本文引用: 1] 摘要
<p>本文利用美国国家大气研究中心(NCAR)的通用地球系统模式(Co mmunity Earth System Model, 简称CESM)的低分辨率版本(CESM1.0.3, T31_g37)在国际国内率先进行了多组过去2000年瞬变积分模拟试验, 在与历史重建资料和观测资料进行对比验证的基础上, 对过去2000年中的典型暖期(中世纪暖期与现代暖期)的特征和成因机制进行了初步探讨, 结果表明: 中世纪暖期太阳辐射加强是导致其"暖化"的主要原因之一, 而温室气体浓度的激增是现代全球变暖的最主要原因; 在中世纪暖期, 自然因子(包括太阳辐射和火山活动)对降水量的影响之和比温室气体的影响高一个数量级; 而在现代暖期, 温室气体对降水量的影响比自然因子(包括太阳辐射和火山活动)对降水量的影响之和高一个数量级; 在不同外强迫条件下的海表温度变化在热带太平洋区域截然不同, 即自然因子影响下为类-拉尼娜态, 而温室气体影响下为类-厄尔尼诺态; 无论在中世纪暖期还是现代暖期, 相对于1000~1850年的平均情况, 沃克(Walker)环流均处于增强状态。</p>
|
| [21] |
中国气候变化影响与适应: 态势和展望 [J].
2015年出版的《第三次气候变化国家评估报告》总结了第二次评估报告发布以来中国学者对气候变化影响与适应的最新研究结果.科学界对中国气候变化影响与适应研究的主要认识进展有:不同领域(农业、水资源、生态系统、冰冻圈、海岸带等)和区域已经显现出来气候变化影响的事实,总体判断弊大于利,特别是未来进一步增温将主要造成负面影响.影响评估的特点包括,气候变化对重点领域影响评估更加全面,重点领域对气候变化响应过程研究深入,评估方法与数据更加规范,辨识气候变化对不同领域和区域影响的利弊.本文分析了气候变化影响与适应研究差距.未来的研究将集中在降低气候变化影响认识的不确定性、提高定量化风险评估水平、增强气候变化影响与风险的综合交叉、趋利避害适应原则、有序适应机制、定量适应措施.
Climate change impacts and adaptation in China: Current situation and future prospect [J].
2015年出版的《第三次气候变化国家评估报告》总结了第二次评估报告发布以来中国学者对气候变化影响与适应的最新研究结果.科学界对中国气候变化影响与适应研究的主要认识进展有:不同领域(农业、水资源、生态系统、冰冻圈、海岸带等)和区域已经显现出来气候变化影响的事实,总体判断弊大于利,特别是未来进一步增温将主要造成负面影响.影响评估的特点包括,气候变化对重点领域影响评估更加全面,重点领域对气候变化响应过程研究深入,评估方法与数据更加规范,辨识气候变化对不同领域和区域影响的利弊.本文分析了气候变化影响与适应研究差距.未来的研究将集中在降低气候变化影响认识的不确定性、提高定量化风险评估水平、增强气候变化影响与风险的综合交叉、趋利避害适应原则、有序适应机制、定量适应措施.
|
| [22] |
中国综合气候变化风险区划 [J].https://doi.org/10.11821/dlxb201701001 URL [本文引用: 3] 摘要
气候变化作用于自然环境与社会经济系统,产生一系列影响.随着未来社会经济发展,气候变化危险性与自然环境和社会经济承险体耦合形成有规律的风险时空格局.将此时空格局系统化表达即是综合气候变化风险区划,是适应气候变化的科学基础之一.本文基于RCP 8.5下的近中期(2021-2050年)气候情景,分析了中国未来气温和降水变化趋势与速率,评价了干旱、高温热浪以及洪涝等极端事件危险性,选取人口、经济、粮食生产和生态系统等承险体风险作为综合风险定量评估的指标.在系统性、主导因素以及空间连续性原则的指导下,提出中国综合气候变化风险区划三级区域系统方案,划分出8个气候变化敏感区、19个极端事件危险区和46个承险体综合风险区.结果发现:2021-2050年RCP 8.5情景下中国的气候变化高风险区主要包括:华北弱暖增雨敏感区,华北平原热浪危险区,人口经济粮食高风险区;华南—西南弱暖增雨敏感区,黔滇山地热浪危险区,生态经济粮食人口高风险区;华南沿海涝热危险区,生态粮食经济人口高风险区.中国综合气候变化风险区划涵盖了气候变化情景、极端事件发生、社会经济与生态系统的可能损失信息,可以为国家或地方应对气候变化及气候变化风险管理提供科技支撑.
Comprehensive climate change risk regionalization of China [J].https://doi.org/10.11821/dlxb201701001 URL [本文引用: 3] 摘要
气候变化作用于自然环境与社会经济系统,产生一系列影响.随着未来社会经济发展,气候变化危险性与自然环境和社会经济承险体耦合形成有规律的风险时空格局.将此时空格局系统化表达即是综合气候变化风险区划,是适应气候变化的科学基础之一.本文基于RCP 8.5下的近中期(2021-2050年)气候情景,分析了中国未来气温和降水变化趋势与速率,评价了干旱、高温热浪以及洪涝等极端事件危险性,选取人口、经济、粮食生产和生态系统等承险体风险作为综合风险定量评估的指标.在系统性、主导因素以及空间连续性原则的指导下,提出中国综合气候变化风险区划三级区域系统方案,划分出8个气候变化敏感区、19个极端事件危险区和46个承险体综合风险区.结果发现:2021-2050年RCP 8.5情景下中国的气候变化高风险区主要包括:华北弱暖增雨敏感区,华北平原热浪危险区,人口经济粮食高风险区;华南—西南弱暖增雨敏感区,黔滇山地热浪危险区,生态经济粮食人口高风险区;华南沿海涝热危险区,生态粮食经济人口高风险区.中国综合气候变化风险区划涵盖了气候变化情景、极端事件发生、社会经济与生态系统的可能损失信息,可以为国家或地方应对气候变化及气候变化风险管理提供科技支撑.
|
| [23] |
江河源区草地退化状况及成因 [J].https://doi.org/10.3321/j.issn:1673-5021.2003.01.014 URL [本文引用: 1] 摘要
近年来 ,江河源区存在草场严重退化、土地荒漠化过程加剧、水土流失加重以及湿地生态衰退等以草地生态系统为主的生态环境退化问题。分析研究结果表明 ,在青藏高原特殊的地理气候背景下 ,经过长期自然演化形成的江河源区脆弱的草地生态系统 ,对外界环境条件反应极其敏感 ,季节性过牧等人类活动是造成该区近期草地迅速退化的突破口和主导因素 ,从而促使气候、鼠害等自然因子作用加剧。江河源区的草地退化 ,是人为因素和自然因素共同作用下人为加速加剧的结果。
Preliminary discuss on grassland degradation in the source region of Yangtze and Yellow Rivers [J].https://doi.org/10.3321/j.issn:1673-5021.2003.01.014 URL [本文引用: 1] 摘要
近年来 ,江河源区存在草场严重退化、土地荒漠化过程加剧、水土流失加重以及湿地生态衰退等以草地生态系统为主的生态环境退化问题。分析研究结果表明 ,在青藏高原特殊的地理气候背景下 ,经过长期自然演化形成的江河源区脆弱的草地生态系统 ,对外界环境条件反应极其敏感 ,季节性过牧等人类活动是造成该区近期草地迅速退化的突破口和主导因素 ,从而促使气候、鼠害等自然因子作用加剧。江河源区的草地退化 ,是人为因素和自然因素共同作用下人为加速加剧的结果。
|
| [24] |
100多年来东亚地区主要河流径流变化 [J].
<FONT face=Verdana>应用东亚地区8条主要河流100多年来的径流观测资料,用线性趋势分析不同时段径流变化趋势.结果表明: 1870年来东亚南部 (主要发源于我国境内)的河流径流均表现出减少趋势;而最近1930年以来,东亚南部河流均为减少趋势,北部河流(西伯利亚3条大河)则表现为增加趋势,但年际变化存在着较大差异;1951年以来大部分河流径流变化趋势基本与1930年以来相同,但长江下游大通站由于中下游地区90年代降水增加表现为增加趋势. </FONT>
Discharge changes of the eight large rivers in east Asia during the last more than 100 years [J].
<FONT face=Verdana>应用东亚地区8条主要河流100多年来的径流观测资料,用线性趋势分析不同时段径流变化趋势.结果表明: 1870年来东亚南部 (主要发源于我国境内)的河流径流均表现出减少趋势;而最近1930年以来,东亚南部河流均为减少趋势,北部河流(西伯利亚3条大河)则表现为增加趋势,但年际变化存在着较大差异;1951年以来大部分河流径流变化趋势基本与1930年以来相同,但长江下游大通站由于中下游地区90年代降水增加表现为增加趋势. </FONT>
|
| [25] |
|
| [26] |
|
| [27] |
a. 中国1951-1980年及1981-2010年的气候区划 [J].https://doi.org/10.11821/yj2013060002 URL [本文引用: 1] 摘要
根据资料均一性、完整性和连续性,从1951-2010年中国756个站气象观测日值数据集中,遴选了654个站(1951-1980年)和658个站(1981-2010年)的资料,依据气候区划理论,遵循同一区划原则,采用同一区划方法和指标体系,分别对中国1951-1980年及1981-2010年2个时段的气候状况进行了区划。结果将中国分为12个温度带、24个干湿区、56个气候区;对比表明:虽然这2个时段所划分的气候区数量一致,但与1951-1980年相比,在56个气候区中,有30个区在1981-2010年间出现了水平位置移动或范围盈缩;其余26气候区虽然水平位置、范围未出现显著移动或盈缩,但多数区域的区划指标值也出现了变化,说明在过去60年中,中国气候格局已出现了一定程度的变化。
The climate regionalization in China for 1951-1980 and 1981-2010 [J].https://doi.org/10.11821/yj2013060002 URL [本文引用: 1] 摘要
根据资料均一性、完整性和连续性,从1951-2010年中国756个站气象观测日值数据集中,遴选了654个站(1951-1980年)和658个站(1981-2010年)的资料,依据气候区划理论,遵循同一区划原则,采用同一区划方法和指标体系,分别对中国1951-1980年及1981-2010年2个时段的气候状况进行了区划。结果将中国分为12个温度带、24个干湿区、56个气候区;对比表明:虽然这2个时段所划分的气候区数量一致,但与1951-1980年相比,在56个气候区中,有30个区在1981-2010年间出现了水平位置移动或范围盈缩;其余26气候区虽然水平位置、范围未出现显著移动或盈缩,但多数区域的区划指标值也出现了变化,说明在过去60年中,中国气候格局已出现了一定程度的变化。
|
| [28] |
b. 1981-2010年中国气候区划 [J].https://doi.org/10.1360/972012-1491 URL Magsci [本文引用: 1] 摘要
<p>根据我国658个站1981~2010年日气象观测数据, 以日平均气温稳定≥10℃的日数、年干燥度、7月平均气温为划分温度带、干湿区、气候区的主要指标, 以1月平均气温、年降水量为温度带、干湿区划分的辅助指标, 并参考日平均气温稳定≥10℃的积温及极端最低气温的多年平均值等指标, 对我国1981~2010年气候状况进行了区划, 将我国分为12个温度带、24个干湿区、56个气候区. 与1951~1980年相比, 受气候增暖影响, 1981~2010年间我国东部多个温度带界线出现了北移, 其中暖温带北界东段最大北移超过1个纬度, 北亚热带北界东段平均北移1个纬度, 中亚热带北界中段最大北移2个纬度, 南亚热带北界西段北移0.5~2.0个纬度; 西部因受地形影响, 温度带水平移动不显著, 但在青藏高原有亚寒带范围缩小、温带范围扩大趋势. 同时, 因华北、东北东南部、西北东部降水减少, 北方半干旱与半湿润分界线东移与南进, 其中36°~41°N间的移动幅度达0.5~2.5经度; 但西北的河西走廊、新疆及青藏高原的干旱区、半干旱区总体转湿.</p>
The climate regionalization in China for 1981-2010 [J].https://doi.org/10.1360/972012-1491 URL Magsci [本文引用: 1] 摘要
<p>根据我国658个站1981~2010年日气象观测数据, 以日平均气温稳定≥10℃的日数、年干燥度、7月平均气温为划分温度带、干湿区、气候区的主要指标, 以1月平均气温、年降水量为温度带、干湿区划分的辅助指标, 并参考日平均气温稳定≥10℃的积温及极端最低气温的多年平均值等指标, 对我国1981~2010年气候状况进行了区划, 将我国分为12个温度带、24个干湿区、56个气候区. 与1951~1980年相比, 受气候增暖影响, 1981~2010年间我国东部多个温度带界线出现了北移, 其中暖温带北界东段最大北移超过1个纬度, 北亚热带北界东段平均北移1个纬度, 中亚热带北界中段最大北移2个纬度, 南亚热带北界西段北移0.5~2.0个纬度; 西部因受地形影响, 温度带水平移动不显著, 但在青藏高原有亚寒带范围缩小、温带范围扩大趋势. 同时, 因华北、东北东南部、西北东部降水减少, 北方半干旱与半湿润分界线东移与南进, 其中36°~41°N间的移动幅度达0.5~2.5经度; 但西北的河西走廊、新疆及青藏高原的干旱区、半干旱区总体转湿.</p>
|
| [29] |
历史环境变化数据库的建设与应用 [J].https://doi.org/10.3321/j.issn:1000-0585.2002.02.002 URL [本文引用: 1] 摘要
阐述了历史环境变化数据库的资料来源及其计算机化的规范;介绍了以计算机、数据库等为技术手段的历史环境变化数据库的建设方案及数据库的主要功能;展望了历史环境变化数据库的应用前景.
A study on the establishment and application of environmental change database during historical times [J].https://doi.org/10.3321/j.issn:1000-0585.2002.02.002 URL [本文引用: 1] 摘要
阐述了历史环境变化数据库的资料来源及其计算机化的规范;介绍了以计算机、数据库等为技术手段的历史环境变化数据库的建设方案及数据库的主要功能;展望了历史环境变化数据库的应用前景.
|
| [30] |
中国过去2000年极端气候事件变化的若干特征 [J].https://doi.org/10.11820/dlkxjz.2014.01.001 Magsci [本文引用: 2] 摘要
历史时期极端气候事件变化是当前气候变化研究的热点领域。本文根据近20 年这一研究领域的主要文献,对中国过去2000 年极端气候事件变化特征进行了梳理和总结。已有认识表明:① 在1500-1900 年和220-580年等气候寒冷期,中国不但多次出现过较1950 年以后所出现的极端冷冬更为显著的寒冷事件,而且其间的相对温暖时段也出现过日最高气温超过20 世纪极端记录的炎夏。② 在中国东部季风区,在公元301-400、751-800、1051-1150、1501-1550 和1601-1650 年极端干旱多发;101-150、251-300、951-1000、1701-1750、1801-1850 和1901-1950 年极端大涝多发;1551-1600 年则是极端干旱与大涝并发最为频繁的时段。7-8 世纪、12-14 世纪和15 世纪后期-17 世纪中期多发极端连旱;10-11 世纪及17 世纪中期以后,多发极端连涝。华北、江淮和江南3 个地区的极端干旱和大涝事件多发时段存在差异;此外,历史极端连旱事件如“崇祯大旱”和“丁戊奇荒”等也得到辨识。③ 在西北干旱区,极端干旱主要集中发生在1471-1520 年、1581-1650 年、1711-1760 年、1811-1860 年和1921-1970 年等5个时段,其中18 世纪10 年代可能是过去千年极端干旱最严重的年代。④ 在西南地区,虽然21 世纪初旱灾频发,但与2006年川渝特大干旱相仿的事件在史上也曾多次发生过。
Changing characteristics of extreme climate events during past 2000 years in China [J].https://doi.org/10.11820/dlkxjz.2014.01.001 Magsci [本文引用: 2] 摘要
历史时期极端气候事件变化是当前气候变化研究的热点领域。本文根据近20 年这一研究领域的主要文献,对中国过去2000 年极端气候事件变化特征进行了梳理和总结。已有认识表明:① 在1500-1900 年和220-580年等气候寒冷期,中国不但多次出现过较1950 年以后所出现的极端冷冬更为显著的寒冷事件,而且其间的相对温暖时段也出现过日最高气温超过20 世纪极端记录的炎夏。② 在中国东部季风区,在公元301-400、751-800、1051-1150、1501-1550 和1601-1650 年极端干旱多发;101-150、251-300、951-1000、1701-1750、1801-1850 和1901-1950 年极端大涝多发;1551-1600 年则是极端干旱与大涝并发最为频繁的时段。7-8 世纪、12-14 世纪和15 世纪后期-17 世纪中期多发极端连旱;10-11 世纪及17 世纪中期以后,多发极端连涝。华北、江淮和江南3 个地区的极端干旱和大涝事件多发时段存在差异;此外,历史极端连旱事件如“崇祯大旱”和“丁戊奇荒”等也得到辨识。③ 在西北干旱区,极端干旱主要集中发生在1471-1520 年、1581-1650 年、1711-1760 年、1811-1860 年和1921-1970 年等5个时段,其中18 世纪10 年代可能是过去千年极端干旱最严重的年代。④ 在西南地区,虽然21 世纪初旱灾频发,但与2006年川渝特大干旱相仿的事件在史上也曾多次发生过。
|
| [31] |
|
| [32] |
|
| [33] |
Moisture changes over the last millennium in arid central Asia: A review, synthesis and comparison with monsoon region [J].https://doi.org/10.1016/j.quascirev.2010.01.005 URL [本文引用: 1] 摘要
There is a strong chance that 20th century warming will cause differences in precipitation distribution, hydrological cycle and effective moisture changes over the globe. Arid central Asia (ACA), a unique dry-land area whose atmospheric circulation is dominated today by the westerlies, is one of the specific regions that are likely to be strongly impacted by global warming. An understanding of past variations in effective moisture in such regions is an important prerequisite for the prediction of future hydrological change. Here we evaluate spatial and temporal patterns of effective moisture variations documented by different proxies from 17 records in ACA, and synthesize a decadal-resolution moisture curve for ACA over the past millennium, using 5 of the 17 records selected on the basis of reliable chronologies and robust proxies. The high- and low-resolution data all show that, over the past millennium, ACA has been characterized by a relatively dry Medieval Warm Period (MWP; the period from 1000 to 1350AD), a wet Little Ice Age (LIA; from 1500 to 1850AD) and increasing moisture during recent decades. As a whole, the LIA in the ACA was not only relatively humid but also had high precipitation. Over the past millennium, the multi-centennial moisture changes in ACA show a generally inverse relationship with the temperature changes in the Northern Hemisphere, China, and western central Asia. The effective moisture history in ACA also shows an out-of-phase relationship with that in monsoon Asia (especially during the LIA). We propose that the humid LIA in ACA, possibly extending to Mediterranean Sea and Western Europe, may have resulted from increased precipitation due to more frequent mid-latitude cyclone activities as a result of the strengthening and equator-ward shift of the westerly jet stream, and the predominantly negative North Atlantic Oscillation conditions, coupled with a decrease in evapotranspiration caused by the cooling at that time.
|
| [34] |
Reconstruction of the extratropical NH mean temperature over the last millennium with a method that preserves low-frequency variability [J].https://doi.org/10.1175/2011JCLI4145.1 URL [本文引用: 1] 摘要
Abstract A new multiproxy reconstruction of the Northern Hemisphere extratropical mean temperature over the last millennium is presented. The reconstruction is performed with a novel method designed to avoid the underestimation of low-frequency variability that has been a general problem for regression-based reconstruction methods. The disadvantage of this method is an exaggerated high-frequency variability. The reconstruction is based on a set of 40 proxies of annual to decadal resolution that have been shown to relate to the local temperature. The new reconstruction shows a very cold Little Ice Age centered around the 17th century with a cold extremum (for 50-yr smoothing) of about 1.1 K below the temperature of the calibration period, AD 1880-1960. This cooling is about twice as large as corresponding numbers reported by most other reconstructions. In the beginning of the millennium the new reconstruction shows small anomalies in agreement with previous studies. However, the new temperature reconstruction decreases faster than previous reconstructions in the first 600 years of the millennium and has a stronger variability. The salient features of the new reconstruction are shown to be robust to changes in the calibration period, the source of the local temperatures, the spatial averaging procedure, and the screening process applied to the proxies. An ensemble pseudoproxy approach is applied to estimate the confidence intervals of the 50-yr smoothed reconstruction showing that the period AD 1500-1850 is significantly colder than the calibration period.
|
| [35] |
A preliminary study on the climatic fluctuations during the last 5,000 years in China [J]. |
| [36] |
Asian monsoon failure and megadrought during the last millennium [J].https://doi.org/10.1126/science.1185188 URL PMID: 2041349851012 [本文引用: 1] 摘要
The Asian monsoon system affects more than half of humanity worldwide, yet the dynamical processes that govern its complex spatiotemporal variability are not sufficiently understood to model and predict its behavior, due in part to inadequate long-term climate observations. Here we present the Monsoon Asia Drought Atlas (MADA), a seasonally resolved gridded spatial reconstruction of Asian monsoon drought and pluviais over the past millennium, derived from a network of tree-ring chronologies. MADA provides the spatiotemporal details of known historic monsoon failures and reveals the occurrence, severity, and fingerprint of previously unknown monsoon megadroughts and their close linkages to large-scale patterns of tropical Indo-Pacific sea surface temperatures. MADA thus provides a long-term context for recent monsoon variability that is critically needed for climate modeling, prediction, and attribution.
|
| [37] |
The PAGES/CLIVAR intersection: Providing the paleoclimatic perspective needed to understand climate variability and predictability: Coordinated research objectives of the International Geosphere-Biosphere (IGBP) and World Climate Research (WCRP) Programmes [R]. |
| [38] |
Transmission of climate change impacts from temperature change to grain harvests, famines and peasant uprisings in the historical China [J].https://doi.org/10.1007/s11430-015-5075-9 URL [本文引用: 3] |
| [39] |
Temperature changes over the past 2000 yr in China and comparison with the Northern Hemisphere [J].https://doi.org/10.5194/cp-9-1153-2013 URL [本文引用: 1] 摘要
We use principal component regression and partial least squares regression to separately reconstruct a composite series of temperature variations in China, and associated uncertainties, at a decadal resolution over the past 2000 yr. The reconstruction is developed using proxy temperature data with relatively high confidence levels from five regions across China, and using a temperature series from observations by the Chinese Meteorological Administration, covering the period from 1871 to 2000. Relative to the 1851-1950 climatology, our two reconstructions show four warm intervals during AD 1 AD 200, AD 551 AD 760, AD 951 AD 1320, and after AD 1921, and four cold intervals during AD 201 AD 350, AD 441 AD 530, AD 781 AD 950, and AD 1321 AD 1920. The temperatures during AD 981 AD 1100 and AD 1201 AD 1270 are comparable to those of the Present Warm Period, but have an uncertainty of +0.28 C to 0.42 C at the 95 % confidence interval. Temperature variations over China are typically in phase with those of the Northern Hemisphere (NH) after 1000, a period which covers the Medieval Climate Anomaly, the Little Ice Age, and the Present Warm Period. In contrast, a warm period in China during AD 541 AD 740 is not obviously seen in the NH.
|
| [40] |
Detection of human influence on a new, validated 1500-year temperature reconstruction [J].https://doi.org/10.1175/JCLI4011.1 URL [本文引用: 1] |
| [41] |
|
| [42] |
|
| [43] |
|
| [44] |
|
| [45] |
High-resolution palaeoclimatology of the last millennium: A review of current status and future prospects [J].https://doi.org/10.1177/0959683608098952 URL [本文引用: 1] 摘要
This review of late-Holocene palaeoclimatology represents the results from a PAGES/CLIVAR Intersection Panel meeting that took place in June 2006. The review is in three parts: the principal high-resolution proxy disciplines (trees, corals, ice cores and documentary evidence), emphasizing current issues in their use for climate reconstruction; the various approaches that have been adopted to combine multiple climate proxy records to provide estimates of past annual-to-decadal timescale Northern Hemisphere surface temperatures and other climate variables, such as large-scale circulation indices; and the forcing histories used in climate model simulations of the past millennium. We discuss the need to develop a framework through which current and new approaches to interpreting these proxy data may be rigorously assessed using pseudo-proxies derived from climate model runs, where the 'answer' is known. The article concludes with a list of recommendations. First, more raw proxy data are required from the diverse disciplines and from more locations, as well as replication, for all proxy sources, of the basic raw measurements to improve absolute dating, and to better distinguish the proxy climate signal from noise. Second, more effort is required to improve the understanding of what individual proxies respond to, supported by more site measurements and process studies. These activities should also be mindful of the correlation structure of instrumental data, indicating which adjacent proxy records ought to be in agreement and which not. Third, large-scale climate reconstructions should be attempted using a wide variety of techniques, emphasizing those for which quantified errors can be estimated at specified timescales. Fourth, a greater use of climate model simulations is needed to guide the choice of reconstruction techniques (the pseudo-proxy concept) and possibly help determine where, given limited resources, future sampling should be concentrated.
|
| [46] |
Köppen climate types in observed and simulated climates [J].https://doi.org/10.1023/A:1022263908716 URL [本文引用: 1] 摘要
The K ppen climate classification was applied to the observed gridded climatological sets and the outputs of four general circulation models (GCMs) over the continents of the Earth. All data had been acquired via the Data Distribution Centre established by the Intergovernmental Panel on Climate Change. The ability of the GCMs to simulate the K ppen climate zones identified in the real data was explored and possible future (global warming) changes in the climate types' distribution for each GCM were assessed. Differences in the area distributions derived from the GCMs' recent climate simulations give evidence about uncertainties generally involved in climate models. As to the global warming simulations, all GCM projections of warming climate (horizon 2050) show that the zones representing tropical rain climates and dry climates become larger, and the zones identified with boreal forest and snow climates together with the polar climates are smaller.
|
| [47] |
Divergent global precipitation changes induced by natural versus anthropogenic forcing [J].https://doi.org/10.1038/nature11784 URL PMID: 23364744 [本文引用: 1] 摘要
As a result of global warming, precipitation is likely to increase in high latitudes and the tropics and to decrease in already dry subtropical regions(1). The absolute magnitude and regional details of such changes, however, remain intensely debated(2,3). As is well known from El Nino studies, sea-surface-temperature gradients across the tropical Pacific Ocean can strongly influence global rainfall(4,5). Palaeoproxy evidence indicates that the difference between the warm west Pacific and the colder east Pacific increased in past periods when the Earth warmed as a result of increased solar radiation(6-9). In contrast, in most model projections of future greenhouse warming this gradient weakens(2,10,11). It has not been clear how to reconcile these two findings. Here we show in climate model simulations that the tropical Pacific sea-surface-temperature gradient increases when the warming is due to increased solar radiation and decreases when it is due to increased greenhouse-gas forcing. For the same global surface temperature increase the latter pattern produces less rainfall, notably over tropical land, which explains why in the model the late twentieth century is warmer than in the Medieval Warm Period (around AD 1000-1250) but precipitation is less. This difference is consistent with the global tropospheric energy budget(12), which requires a balance between the latent heat released in precipitation and radiative cooling. The tropospheric cooling is less for increased greenhouse gases, which add radiative absorbers to the troposphere, than for increased solar heating, which is concentrated at the Earth's surface. Thus warming due to increased greenhouse gases produces a climate signature different from that of warming due to solar radiation changes.
|
| [48] |
The spatial distribution of forest carbon sinks and sources in China [J].https://doi.org/10.1007/s11434-012-4998-1 URL [本文引用: 1] |
| [49] |
Proxy-based reconstructions of hemispheric and global surface temperature variations over the past two millennia [J].https://doi.org/10.1073/pnas.0805721105 URL [本文引用: 1] |
| [50] |
Global signatures and dynamical origins of the little ice age and medieval climate anomaly [J].https://doi.org/10.1126/science.1177303 URL PMID: 19965474 [本文引用: 1] 摘要
Global temperatures are known to have varied over the past 1500 years, but the spatial patterns have remained poorly defined. We used a global climate proxy network to reconstruct surface temperature patterns over this interval. The Medieval period is found to display warmth that matches or exceeds that of the past decade in some regions, but which falls well below recent levels globally. This period is marked by a tendency for La Ni a-like conditions in the tropical Pacific. The coldest temperatures of the Little Ice Age are observed over the interval 1400 to 1700 C.E., with greatest cooling over the extratropical Northern Hemisphere continents. The patterns of temperature change imply dynamical responses of climate to natural radiative forcing changes involving El Ni o and the North Atlantic Oscillation-Arctic Oscillation.
|
| [51] |
Highly variable Northern Hemisphere temperatures reconstructed from low- and high-resolution proxy data [J].https://doi.org/10.1038/nature03265 URL PMID: 15703742 摘要
A number of reconstructions of millennial-scale climate variability have been carried out in order to understand patterns of natural climate variability, on decade to century timescales, and the role of anthropogenic forcing. These reconstructions have mainly used tree-ring data and other data sets of annual to decadal resolution. Lake and ocean sediments have a lower time resolution, but provide climate information at multicentennial timescales that may not be captured by tree-ring data. Here we reconstruct Northern Hemisphere temperatures for the past 2,000 years by combining low-resolution proxies with tree-ring data, using a wavelet transform technique to achieve timescale-dependent processing of the data. Our reconstruction shows larger multicentennial variability than most previous multi-proxy reconstructions, but agrees well with temperatures reconstructed from borehole measurements and with temperatures obtained with a general circulation model. According to our reconstruction, high temperatures--similar to those observed in the twentieth century before 1990--occurred around ad 1000 to 1100, and minimum temperatures that are about 0.7 K below the average of 1961-90 occurred around ad 1600. This large natural variability in the past suggests an important role of natural multicentennial variability that is likely to continue.
|
| [52] |
|
| [53] |
The spatial extent of 20th-century warmth in the context of the past 1200 years [J].https://doi.org/10.1126/science.1120514 URL PMID: 16469924 [本文引用: 1] 摘要
Abstract Periods of widespread warmth or cold are identified by positive or negative deviations that are synchronous across a number of temperature-sensitive proxy records drawn from the Northern Hemisphere. The most significant and longest duration feature during the last 1200 years is the geographical extent of warmth in the middle to late 20th century. Positive anomalies during 890 to 1170 and negative anomalies during 1580 to 1850 are consistent with the concepts of a Medieval Warm Period and a Little Ice Age, but comparison with instrumental temperatures shows the spatial extent of recent warmth to be of greater significance than that during the medieval period.
|
| [54] |
Science plan and implementation strategy. IGBP Report No.57 [R]. |
| [55] |
Continental-scale temperature variability during the past two millennia [J].https://doi.org/10.1038/ngeo1797 URL [本文引用: 1] 摘要
Figure 2 | Continental-scale temperature reconstructions. 30-year mean temperatures for the seven PAGES022k Network regions, standardized to have the same mean (0) and standard deviation (1) over the period of overlap among records (ad021190-1970). North America includes a shorter tree-ring-based and a longer pollen-based reconstruction. Dashed outlines enclose intervals of pronounced volcanic and solar negative forcing since ad02850 (see Methods). The lower panel shows the running count of number of individual proxy records by region. Data are listed in Supplementary Database02S2.
|
| [56] |
A global multiproxy database for temperature reconstructions of the Common Era [J].https://doi.org/10.1038/sdata.2017.88 URL PMID: 5505119 [本文引用: 1] 摘要
Reproducible climate reconstructions of the Common Era (1 CE to present) are key to placing industrial-era warming into the context of natural climatic variability. Here we present a community-sourced database of temperature-sensitive proxy records from the PAGES2k initiative. The database gathers 692 records from 648 locations, including all continental regions and major ocean basins. The records are from trees, ice, sediment, corals, speleothems, documentary evidence, and other archives. They range in length from 50 to 2000 years, with a median of 547 years, while temporal resolution ranges from biweekly to centennial. Nearly half of the proxy time series are significantly correlated with HadCRUT4.2 surface temperature over the period 1850 2014. Global temperature composites show a remarkable degree of coherence between high- and low-resolution archives, with broadly similar patterns across archive types, terrestrial versus marine locations, and screening criteria. The database is suited to investigations of global and regional temperature variability over the Common Era, and is shared in the Linked Paleo Data (LiPD) format, including serializations in Matlab, R and Python.
|
| [57] |
Impacts of tropospheric ozone and climate change on net primary productivity and net carbon exchange of China’s forest ecosystems [J].https://doi.org/10.1111/j.1466-8238.2010.00606.x URL [本文引用: 1] 摘要
ABSTRACT Aim68 We investigated how ozone pollution and climate change/variability have interactively affected net primary productivity (NPP) and net carbon exchange (NCE) across China's forest ecosystem in the past half century. Location68 Continental China. Methods68 Using the dynamic land ecosystem model (DLEM) in conjunction with 10-km-resolution gridded historical data sets (tropospheric O 3 concentrations, climate variability/change, and other environmental factors such as land-cover/land-use change (LCLUC), increasing CO 2 and nitrogen deposition), we conducted nine simulation experiments to: (1) investigate the temporo-spatial patterns of NPP and NCE in China's forest ecosystems from 1961–2005; and (2) quantify the effects of tropospheric O 3 pollution alone or in combination with climate variability and other environmental stresses on forests' NPP and NCE. Results68 China's forests acted as a carbon sink during 1961–2005 as a result of the combined effects of O 3 , climate, CO 2 , nitrogen deposition and LCLUC. However, simulated results indicated that elevated O 3 caused a 7.7% decrease in national carbon storage, with O 3 -induced reductions in NCE (Pg C year 611 ) ranging from 0.4–43.1% among different forest types. Sensitivity experiments showed that climate change was the dominant factor in controlling changes in temporo-spatial patterns of annual NPP. The combined negative effects of O 3 pollution and climate change on NPP and NCE could be largely offset by the positive fertilization effects of nitrogen deposition and CO 2 . Main conclusions68 In the future, tropospheric O 3 should be taken into account in order to fully understand the variations of carbon sequestration capacity of forests and assess the vulnerability of forest ecosystems to climate change and air pollution. Reducing air pollution in China is likely to increase the resilience of forests to climate change. This paper offers the first estimate of how prevention of air pollution can help to increase forest productivity and carbon sequestration in China's forested ecosystems.
|
| [58] |
Climatic implications of a 3585-year tree-ring width chronology from the northeastern Qinghai-Tibetan Plateau [J].https://doi.org/10.1016/j.quascirev.2010.05.005 URL [本文引用: 1] 摘要
In this study we develop a tree-ring width chronology of Qilian juniper ( Sabina przewalskii Kom.) in the northeastern Qaidam Basin (northeastern Qinghai-Tibetan Plateau), China, which extends from 1580 BC to AD 2005 lasting 3585 years. This is by far the longest ring-width chronology in China. It is composed of archaeological wood samples from 13 sites, samples of living trees growing at a site with relatively good moisture condition and other long living trees from multiple sites approximately 100m below the local upper treeline. Our results suggest that the archaeological wood and long living tree-ring width series belong to the same statistical population, which allows the construction of a single, regional composite chronology. We find that ring-width variations of the archaeological wood have statistical characteristics that are more similar to those trees from the lower part of the forest belt, where the moisture regime during the months at the onset of the growing season is the primary control on tree growth. Only after these analyses it becomes certain that the ring-width variations of the archaeological wood represent the variation of moisture conditions in the past. Therefore, the entire composite chronology is moisture-sensitive and suitable for reconstruction of the drought history and the related climate forcing over the past three millennia in the study region. The composite chronology shows considerable variations at inter-decadal to centennial timescales, with ten major multi-decadal low-growth periods corresponding to severe drought events in the past 2850 years, especially for two prominent events centered on AD 1480s and AD 1710s. On the other hand, significant high-growth periods were found centered on AD 590s and AD 1570s, and also in the past 30 years.
|
| [59] |
Hydrological cycles change in the Yellow River basin during the last half of the twentieth century [J].https://doi.org/10.1175/2007JCLI1854.1 URL [本文引用: 1] 摘要
A distributed biosphere hydrological (DBH) model system was used to explore the internal relations among the climate system, human society, and the hydrological system in the Yellow River basin, and to interpret possible mechanisms for observed changes in Yellow River streamflow from 1960 to 2000. Several scenarios were evaluated to elucidate the hydrological response to climate system, land cover, and irrigation. The results show that climate change is the dominant cause of annual streamflow changes in the upper and middle reaches, but human activities dominate annual streamflow changes in the lower reaches of the Yellow River basin. The annual river discharge at the mouth is affected by climate change and by human activities in nearly equal proportion. The linear component of climate change contributes to the observed annual streamflow decrease, but changes in the climate temporal pattern have a larger impact on annual river discharge than does the linear component of climate change. Low flow is more significantly affected by irrigation withdrawals than by climate change. Reservoirs induce more diversions for irrigation, while at the same time the results demonstrate that the reservoirs may help to maintain environmental flows and counter what otherwise would be more serious reductions in low flows.
|
| [60] |
Spatiotemporal changes of wheat phenology in China under the effects of temperature, day length and cultivar thermal characteristics [J].https://doi.org/10.1016/j.eja.2012.07.005 URL [本文引用: 1] 摘要
Investigating the spatiotemporal changes of crop phenology in field is important to understand the processes and mechanisms of crop response and adaption to ongoing climate change. Here, the wheat phenology at more than 100 national agro-meteorological experiment stations across China spanning the years 1981鈥2007 was examined. Spatiotemporal changes of wheat phenology and seasonal temperature, as well as the correlations between them were presented. During the investigation period, heading dates advanced significantly at 43 stations from the 108 investigated stations; maturity dates advanced significantly at 41 stations from the 109 investigated stations. Lengths of growing period (from sowing to maturity) and vegetative growing period (from sowing to heading) were significantly reduced at about 30% of the investigated stations, especially for spring wheat in northwestern China, despite thermal accumulation during the periods increased. In contrast, although significantly and negatively related to mean temperature, lengths of reproductive growing period (from heading to maturity) increased at 60% of the investigated stations, owing to increase in crop cultivars thermal requirements or/and decrease in mean temperature. The results showed that besides the complex influences of agronomic factors, climate change contributed substantially to the shift of wheat phenology. Mean day length during vegetative growing period had a decreasing trend at most of the investigated stations owing to delay of sowing date or/and advancement of heading date, which counterbalanced the roles of temperature in controlling the duration of vegetative growing period. In-depth analyses showed that thermal requirements from sowing to almost each development stage increased, however the thermal requirements to complete each single development stage changed differently, which tended to increase yield and adapt to ongoing climate change. Our findings have important implications for improving climate change impact studies, for breeding scientists to breed higher yielding cultivars, and for agricultural production to cope with ongoing climate change.
|
| [61] |
Macro-economic cycles related to climate change in dynastic China [J].https://doi.org/10.1016/j.yqres.2014.11.001 URL [本文引用: 2] 摘要
Investigations of the relationships between climate and human history often place more emphasis on the science of climate change than on understanding human socio-economic processes, and therefore suffer from superficial results and an unbalanced perspective. This is partly due to the lack of high-resolution data concerning long-term socio-economic processes. Here, we base our study of climate and society on a series of 2130-yr-long economic proxy data from China with decadal resolution. The economy was associated significantly with temperature and precipitation at the two predominant bands of 100 and 32002yr. The phase transition of economic states was influenced positively by long-term temperature change combined with triggering effects of short-term changes in precipitation. However, climatic impact on economy should not be recognized as simple causality but some driving–response relation coupled with meditation by human agency at multiple scales. A model of ‘adaptive cycles’ implies, in relative to the developing phases, climate–economy relationship during the declining phases was more easily moderated by slower processes like rigidity and faster processes like unrest. From a more-macro perspective, climatic driving for the macro-economic cycles was moderated by larger and slower processes like social memory, spatial shifting of key economic areas, and social–technical advance.
|
| [62] |
Climate change and fiscal balance in China over the past two millennia [J].https://doi.org/10.1177/0959683614551224 URL [本文引用: 1] 摘要
ABSTRACT The relation between climate change and historical rhythms has long been discussed; however, this type of study still faces the lack of high-resolution data of long-term socio-economic processes. In this study, we collected 1101 items of direct and proffered evidence from 24 Chinese fiscal and economic history books written by leading contemporary scholars. By analysing the semantics of words, we reconstructed a 2130-year-long fiscal sequence with decadal resolution to express the phase transition of fiscal soundness for approximately 21 dynasties in China. Our reconstruction shows four relatively sufficient stages and three relatively deficient stages, with several secondary stages lasting 60 or 160 years on average within each large stage, from 220 bc to ad 1910. Then, the fiscal association with climate change was analysed. The results show that the fiscal crisis was more likely to occur in cold-dry climatic scenarios. Both temperature and precipitation displayed more significant effects on the fiscal fluctuation within the long term, particularly for temperature. In short, fiscal decline had a 10-year lag in response to decreasing precipitation, whereas influence of decreasing temperature on the fiscal balance might be through amplifying already deteriorating fiscal conditions. Regional differences existed in the influence of precipitation on the fiscal balance. The precipitation in the Northern China Plain and in the Jiang-Huai area had more significant effects on the fluctuation of the dynastic fiscal balance than on that in the Jiang-Nan area. In particular, the dynastic finance was more sensitive to the change in the precipitation in the Northern China Plain because of its special geographical, economic and social backgrounds.
|
| [63] |
Impact of future climate change on terrestrial ecosystems in China [J].https://doi.org/10.1002/joc.1938 URL [本文引用: 1] 摘要
Abstract Top of page Abstract References The impact of future climate change on terrestrial ecosystem was projected by the atmospheric-vegetation interaction model (AVIM2) over China at four warmer levels of 1, 2, 3 and 4 °C. Future climate data were projected by regional climate model from the Hadley Centre under Special Report on Emissions Scenarios (SRES) B2 scenario. The results show that, as projected temperature increases, the average net primary productivity (NPP) is likely to decrease in China as a whole. The Tibetan Plateau is the only ecoregion with increasing NPP as the climate becomes warmer. The terrestrial ecosystem NPP in China would be impacted as: 1 °C warmer, favourable or adverse impact on ecosystem would be equivalent with regional variation; 2 °C warmer, slight adverse impact would be significant; 3 °C warmer, moderate adverse impact would take priority and 4 °C warmer, moderate adverse impact regions would increase significantly. But overall, only a small part of the ecosystems are expected to be over moderately impacted. Areas impacted over moderately are likely to be enlarged in the same distributing pattern as temperature increases. The northwest arid region is expected to be the most vulnerable ecoregion. Copyright 08 2009 Royal Meteorological Society
|
| [64] |
Famine, migration and war: Comparison of climate change impacts and social responses in North China between the late Ming and late Qing dynasties [J].https://doi.org/10.1177/0959683615572851 URL [本文引用: 1] 摘要
The human-climate-ecosystem interactions in the past were valuable for today's human beings who face the challenge of global change. The multi-proxy reconstruction of climate change impacts and social responses and the comparative study between typical periods form an effective tool for elucidating the mechanisms of the interactions. In this paper, with a reconstruction of the proxy series of famine, migration and wars, the most typical social consequences related to climate change and disasters (flood/drought) in North China in 1470-1911 were quantitatively described, and two typical periods of human-climate interaction with similar climate change backgrounds (cold periods of the Little Ice Age'), which were the late Ming dynasty (1560-1644) and late Qing dynasty (1780-1911), were selected and compared. It is determined that the climate deterioration (rapid cooling and increasing extreme disasters) in the late 16th and 18th centuries both resulted in severe social consequences characterized by more famine and popular unrest. The differences were that the climatic impacts in the late Ming were much more serious, and interregional migration, which was an effective responsive measure in the late Qing, was not important in the late Ming; they were primarily influenced by three factors based on the analytical framework of the impacts of historical climate change and social responses: (1) climate deterioration in the late Ming was more severe (more rapid cooling and more extreme disasters), (2) social system were more sensitive to climate change in the late Ming because of its mode of agricultural production (especially cropping system and crop species), and (3) the capacity of social response to climate disaster, especially disaster relief and refugee settlement, was considerably greater in the late Qing.
|
| [65] |
A 3500-year tree-ring record of annual precipitation on the northeastern Tibetan Plateau [J].https://doi.org/10.1073/pnas.1319238111 URL PMID: 24516152 [本文引用: 1] 摘要
An annually resolved and absolutely dated ring-width chronology spanning 4,500 y has been constructed using subfossil, archaeological, and living-tree juniper samples from the northeastern Tibetan Plateau. The chronology represents changing mean annual precipitation and is most reliable after 1500 B.C. Reconstructed precipitation for this period displays a trend toward more moist conditions: the last 10-, 25-, and 50-y periods all appear to be the wettest in at least three and a half millennia. Notable historical dry periods occurred in the 4th century BCE and in the second half of the 15th century CE. The driest individual year reconstructed (since 1500 B.C.) is 1048 B.C., whereas the wettest is 2010. Precipitation variability in this region appears not to be associated with inferred changes in Asian monsoon intensity during recent millennia. The chronology displays a statistical association with the multidecadal and longer-term variability of reconstructed mean Northern Hemisphere temperatures over the last two millennia. This suggests that any further large-scale warming might be associated with even greater moisture supply in this region.
|
| [66] |
Climate change impact on China food security in 2050 [J].https://doi.org/10.1007/s13593-012-0102-0 URL [本文引用: 1] 摘要
Climate change is now affecting global agriculture and food production worldwide. Nonetheless the direct link between climate change and food security at the national scale is poorly understood. Here we simulated the effect of climate change on food security in China using the CERES crop models and the IPCC SRES A2 and B2 scenarios including CO2 fertilization effect. Models took into account population size, urbanization rate, cropland area, cropping intensity and technology development. Our results predict that food crop yield will increase +3–1102% under A2 scenario and +402% under B2 scenario during 2030–2050, despite disparities among individual crops. As a consequence China will be able to achieve a production of 572 and 615 MT in 2030, then 635 and 646 MT in 2050 under A2 and B2 scenarios, respectively. In 2030 the food security index (FSI) will drop from +2402% in 2009 to 614.502% and +10.202% under A2 and B2 scenarios, respectively. In 2050, however, the FSI is predicted to increase to +7.102% and +20.002% under A2 and B2 scenarios, respectively, but this increase will be achieved only with the projected decrease of Chinese population. We conclude that 1) the proposed food security index is a simple yet powerful tool for food security analysis; (2) yield growth rate is a much better indicator of food security than yield per se; and (3) climate change only has a moderate positive effect on food security as compared to other factors such as cropland area, population growth, socio-economic pathway and technology development. Relevant policy options and research topics are suggested accordingly.
|
| [67] |
Migration and reclamation in Northeast China in response to climatic disasters in North China over the past 300 years [J].https://doi.org/10.1007/s10113-011-0245-6 URL [本文引用: 1] 摘要
Climatic disaster-induced migration and its effects on land exploitation of new settlements is a crucial topic that needs to be researched to better understand the impact of climate change and human adaptation. This paper focuses on the process and mechanism of migrant–reclamation in Northeast China in response to climatic disasters over the past 30002years. The research used comparative analysis of key interlinked factors in this response involving drought/flood events, population, cropland area, farmer revolts, administrations establishment, and land reclamation policies. It draws the following conclusions: (1) seven peaks of migrants–reclamation in Northeast China were evident, most likely when frequent climatic disasters happened in North China, such as the drought–flood in 1851–1859, drought in 1875–1877, and drought 1927–1929; (2) six instances of policy transformation adopted to cope with extreme climatic events, including distinctive examples like changing to a firm policy prohibiting migration in 1740 and a subsequent lifting of that prohibition in 1860; and (3) the fast expansion of the northern agricultural boundary since the middle of the nineteenth century in this area benefited from a climate change trend from a cold period into a warm period. Altogether, over the past 30002years, extreme climatic disasters in North China have deepened the contradiction between the limited land resources and the rapidly increasing population and have resulted in migration and reclamation in Northeast China. Climate, policy, and reclamation constructed an organic chain of response that dominated the land use/cover change process of Northeast China.
|
| [68] |
Relationships between temperature change and grain harvest fluctuations in China from 210 BC to 1910 AD [J].https://doi.org/10.1016/j.quaint.2014.09.037 URL [本文引用: 1] 摘要
The impact of climate change on agricultural production is integral to understanding the impacts of historical climate change on society and the economy, which could provide historical references for dealing with current and future global climate change. Continuous proxy series of human activity that extend to more than 1000 years in the past are few, especially for high-resolution series. There was a lack of quantitative records of grain harvest in Chinese history except during the Qing Dynasty. Thus, it is difficult to reconstruct long-term and high-resolution agricultural production series. In this paper, the method developed by Su etal. (2014) is used to reconstruct the grain grade sequence with a 10-year resolution from 210BC to 1910AD in China, and the changes between temperature and grain yield grades are compared. A positive correlation between the winter half-year temperature departure and the grain yield from 210BC to 1910AD in China was found. The change of grain yield grades could be divided into five stages. The bumper harvest stages corresponded to the warm periods, and poor harvest stages corresponded to the cold periods. In both warm and cold periods, the grain yield grades assumed a trend of convergence with the temperature increase. The sensitivity of grain yield to temperature change became weakened over time from 210BC to 1910AD, perhaps due to the strengthened adaptive capacity of agriculture to temperature change, with the extension of farming to southern China, progress of farming technology, and introduction of high-yielding crop varieties. Remote linkages between the agricultural change in China and the human civilization in Europe were found, implying the impacts of temperature change are globally synchronous.
|
| [69] |
Climate change and war frequency in eastern China over the last millennium [J].https://doi.org/10.1007/s10745-007-9115-8 URL [本文引用: 1] 摘要
We explore the association between climate change and warfare in eastern China over the past millennium from a macro-historic perspective. High-resolution palaeo-temperature reconstructions and the complete record of warfare incidence in eastern China were compared. Results show that warfare frequency in eastern China (its southern portion in particular) significantly correlated with the Northern Hemisphere temperature oscillations. Almost all peaks of warfare frequency and dynastic changes occurred in cooling phases. We suggest that in historic China, the reduction of thermal energy during cooling phases significantly shrank agricultural production. Such ecological stress interacted with population pressure and China unique historic and geographic setting to bring about the high frequencies of warfare over the last millennium. We recommend scholars take climate change into account as they consider the anthropology of warfare in the historic past.
|
| [70] |
|
| [71] |
A test of climate, sun, and culture relationships from an 1810-year Chinese cave record [J].https://doi.org/10.1126/science.1163965 URL PMID: 18988851 [本文引用: 1] 摘要
Abstract A record from Wanxiang Cave, China, characterizes Asian Monsoon (AM) history over the past 1810 years. The summer monsoon correlates with solar variability, Northern Hemisphere and Chinese temperature, Alpine glacial retreat, and Chinese cultural changes. It was generally strong during Europe's Medieval Warm Period and weak during Europe's Little Ice Age, as well as during the final decades of the Tang, Yuan, and Ming Dynasties, all times that were characterized by popular unrest. It was strong during the first several decades of the Northern Song Dynasty, a period of increased rice cultivation and dramatic population increase. The sign of the correlation between the AM and temperature switches around 1960, suggesting that anthropogenic forcing superseded natural forcing as the major driver of AM changes in the late 20th century.
|
| [72] |
Observed, reconstructed, and simulated decadal variability of summer precipitation over Eastern China [J].https://doi.org/10.1007/s13351-017-6115-5 URL [本文引用: 1] |
| [73] |
How climate change impacted the collapse of the Ming dynasty [J].https://doi.org/10.1007/s10584-014-1244-7 URL [本文引用: 1] 摘要
Based on the reconstructed temperatures, precipitation changes, and occurrences of extreme climate events, together with historical records on fiscal deterioration, food crises, and the frequencies of popular unrest, rebellions and wars, we identified three principal ways in which climate change contributed to the collapse in the Ming dynasty. Firstly, cooling, aridification, and desertification during a cold period destroyed the military farm system, which was the main supply system for the provisioning of government troops on the northern frontiers; these impacts increased the military expenditure from 64 % of total government expenditure in 1548-1569 to 76 % in 1570-1589 and thus aggravated the national fiscal crisis that occurred during the late Ming dynasty. Secondly, climate deterioration (e.g., cooling, aridification, and an increase in the frequencies of frost- and drought-related disasters, etc.) led to a 20-50 % reduction in the per capita production of raw grain in most areas of China, which resulted in widespread food crises and exacerbated the vulnerability of social structures during the last several decades of the Ming dynasty. Thirdly, the severe droughts occurring in 1627-1643 were a key trigger to the peasantry uprising. These droughts also played a significant role to promote the peasantry uprising, especially reviving the peasantry troops by recruitment of famine victims when they nearly perished in 1633 and 1638, and severely disrupting the food supply for the government troops, resulting in the final defeat of the government troops by the peasantry troops. This study contributes to an understanding of the climate-related mechanisms behind the collapse of the Ming dynasty, and provides a historical case study that enhances our understanding of the nature of interactions between climate change and social vulnerability.
|

/
| 〈 |
|
〉 |