×
模态框(Modal)标题
在这里添加一些文本
Close
Close
Submit
Cancel
Confirm
×
模态框(Modal)标题
×
Journal
Article
Figure
Search
EN
中文
Home
About Journal
About Journal
Indexed in
Awards
Editorial Board
Guide for Authors
Browse
Current Issue
Online First
Archive
Highlights
Topic
Archive by Subject
Most Viewed
Most Download
Most Cited
E-mail Alert
RSS
Subscribe
Publication Ethics
Contact us
EN
中文
Figure/Table detail
Luminescence dating of glaciofluvial deposits using single-grain K-feldspar in the Urumqi River headwaters of the Tianshan Mountains
LI Hongyu, YAO Pan, OU Xianjiao, XU Yantian, YANG Kunmei, LIU Jingfeng
PROGRESS IN GEOGRAPHY
, 2025, 44(
10
): 2203-2214. DOI:
10.18306/dlkxjz.2025.10.015
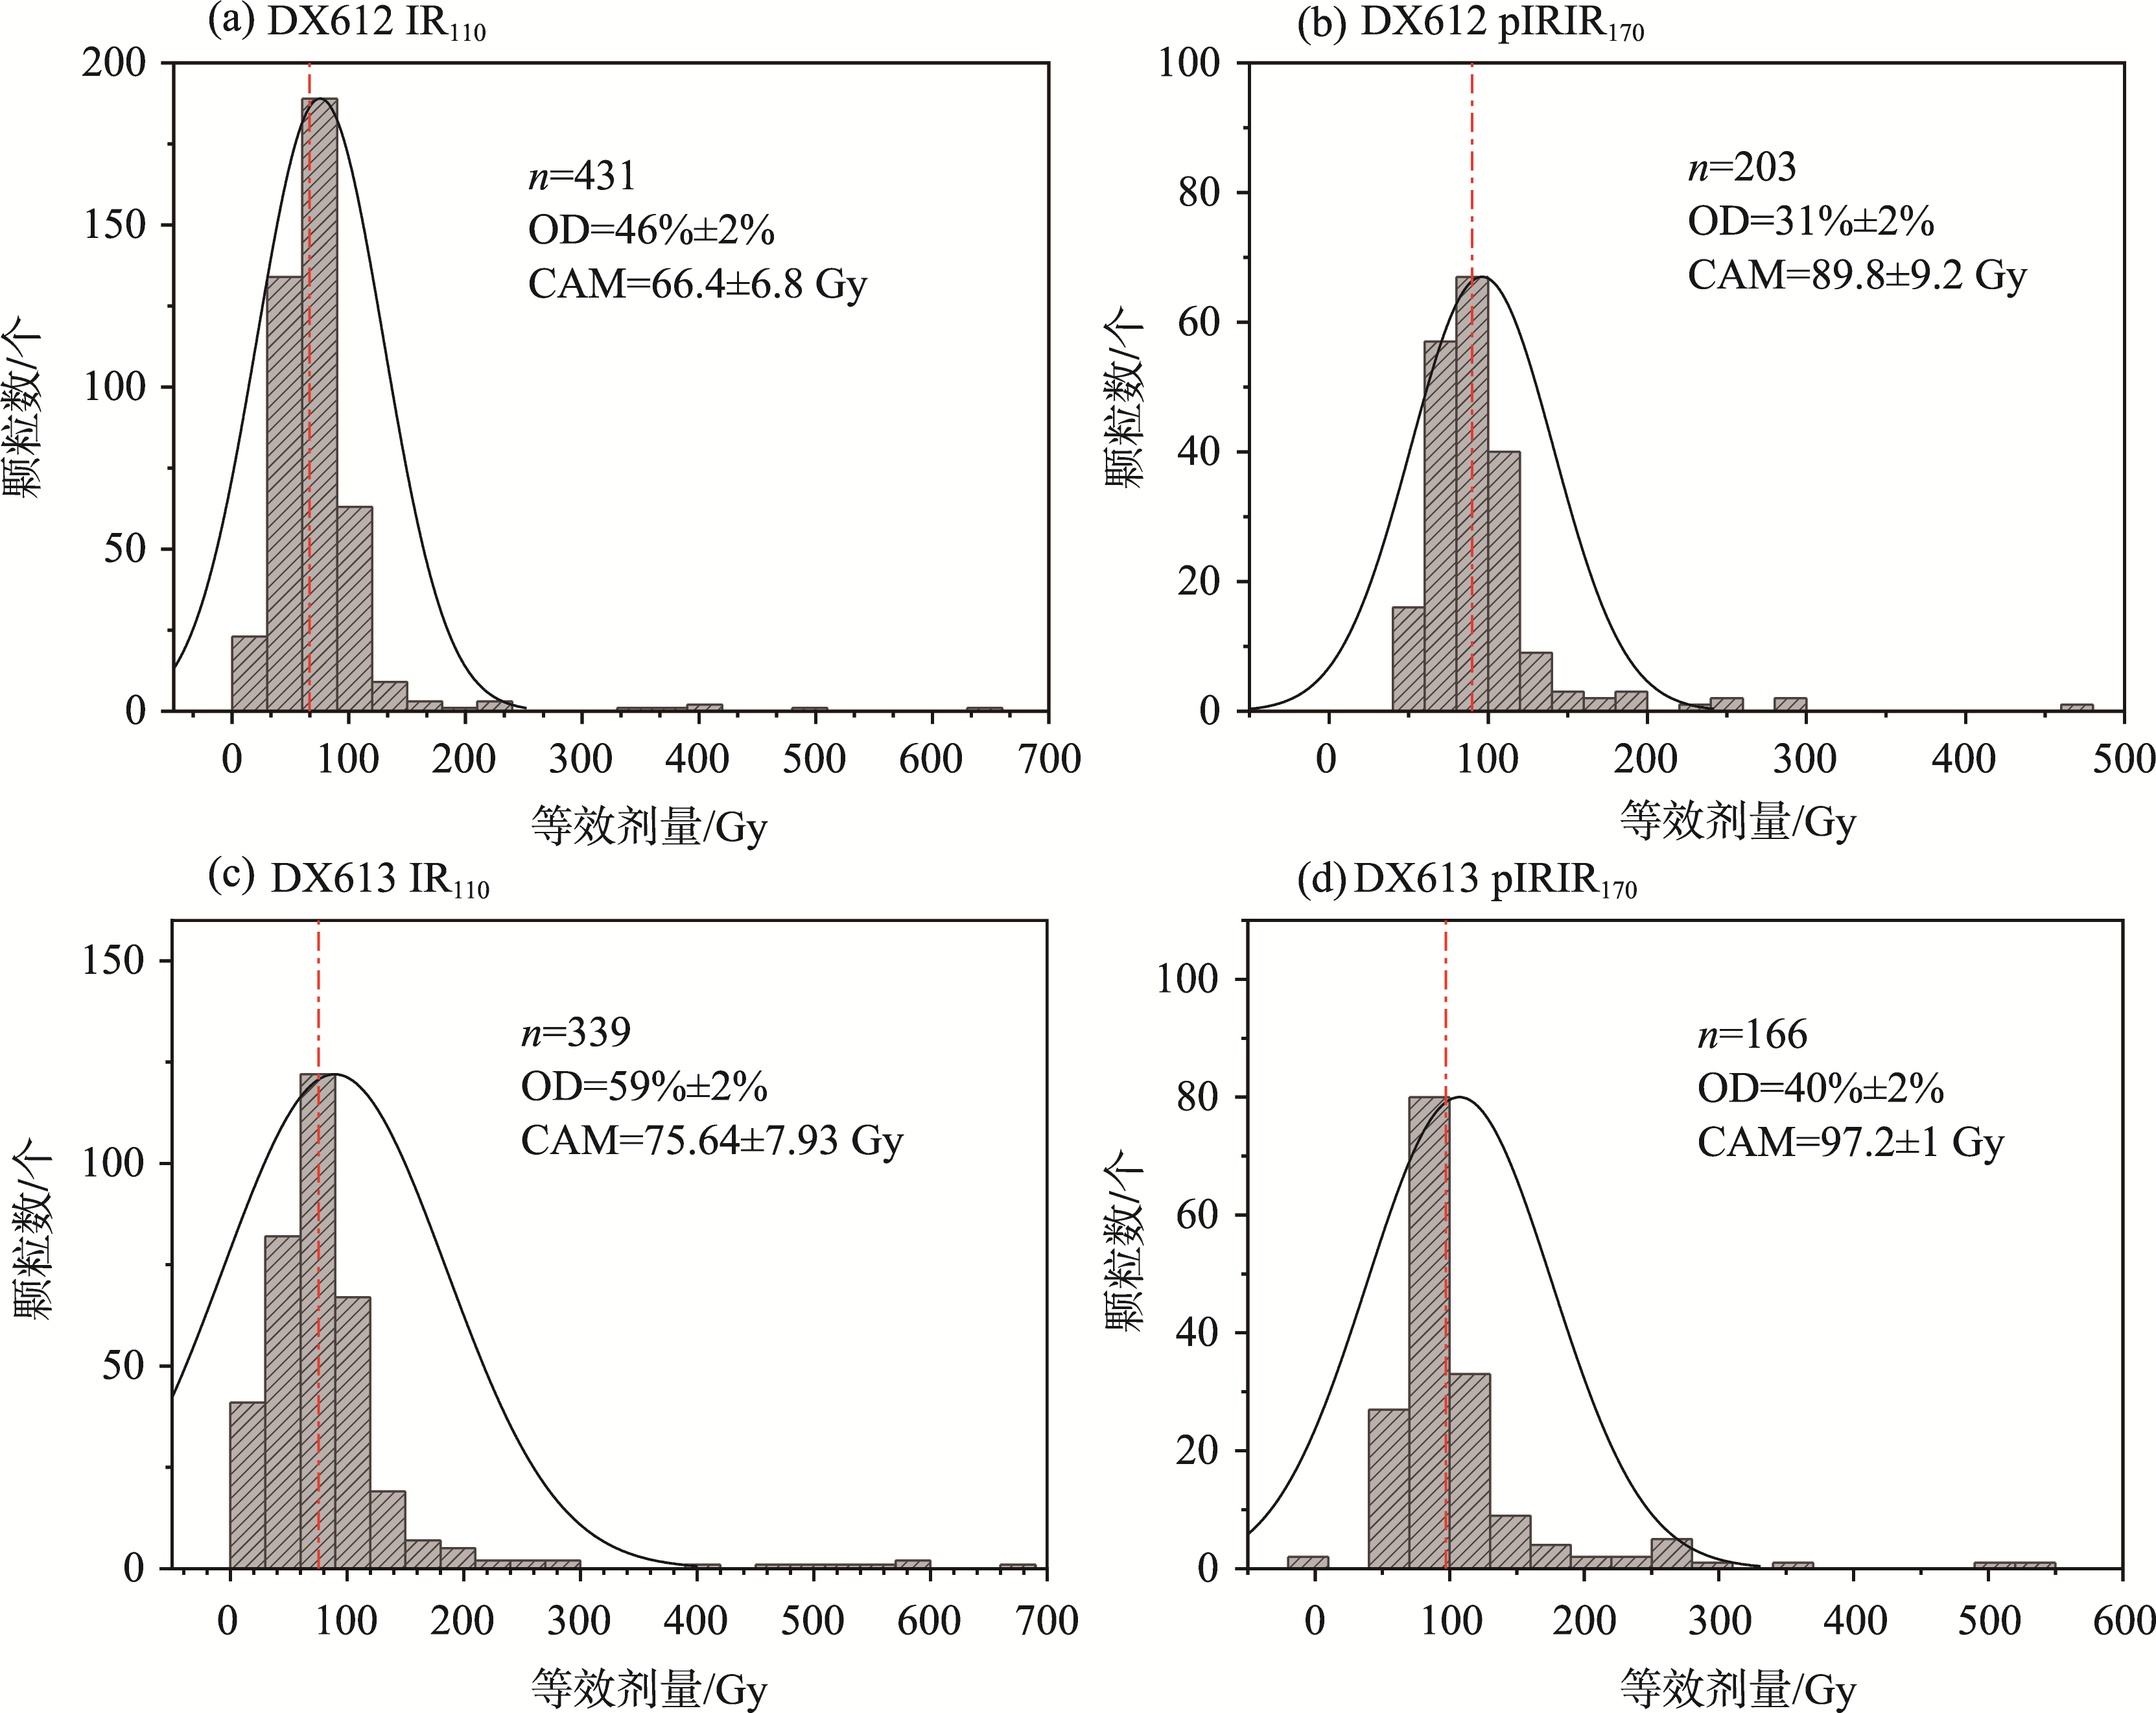
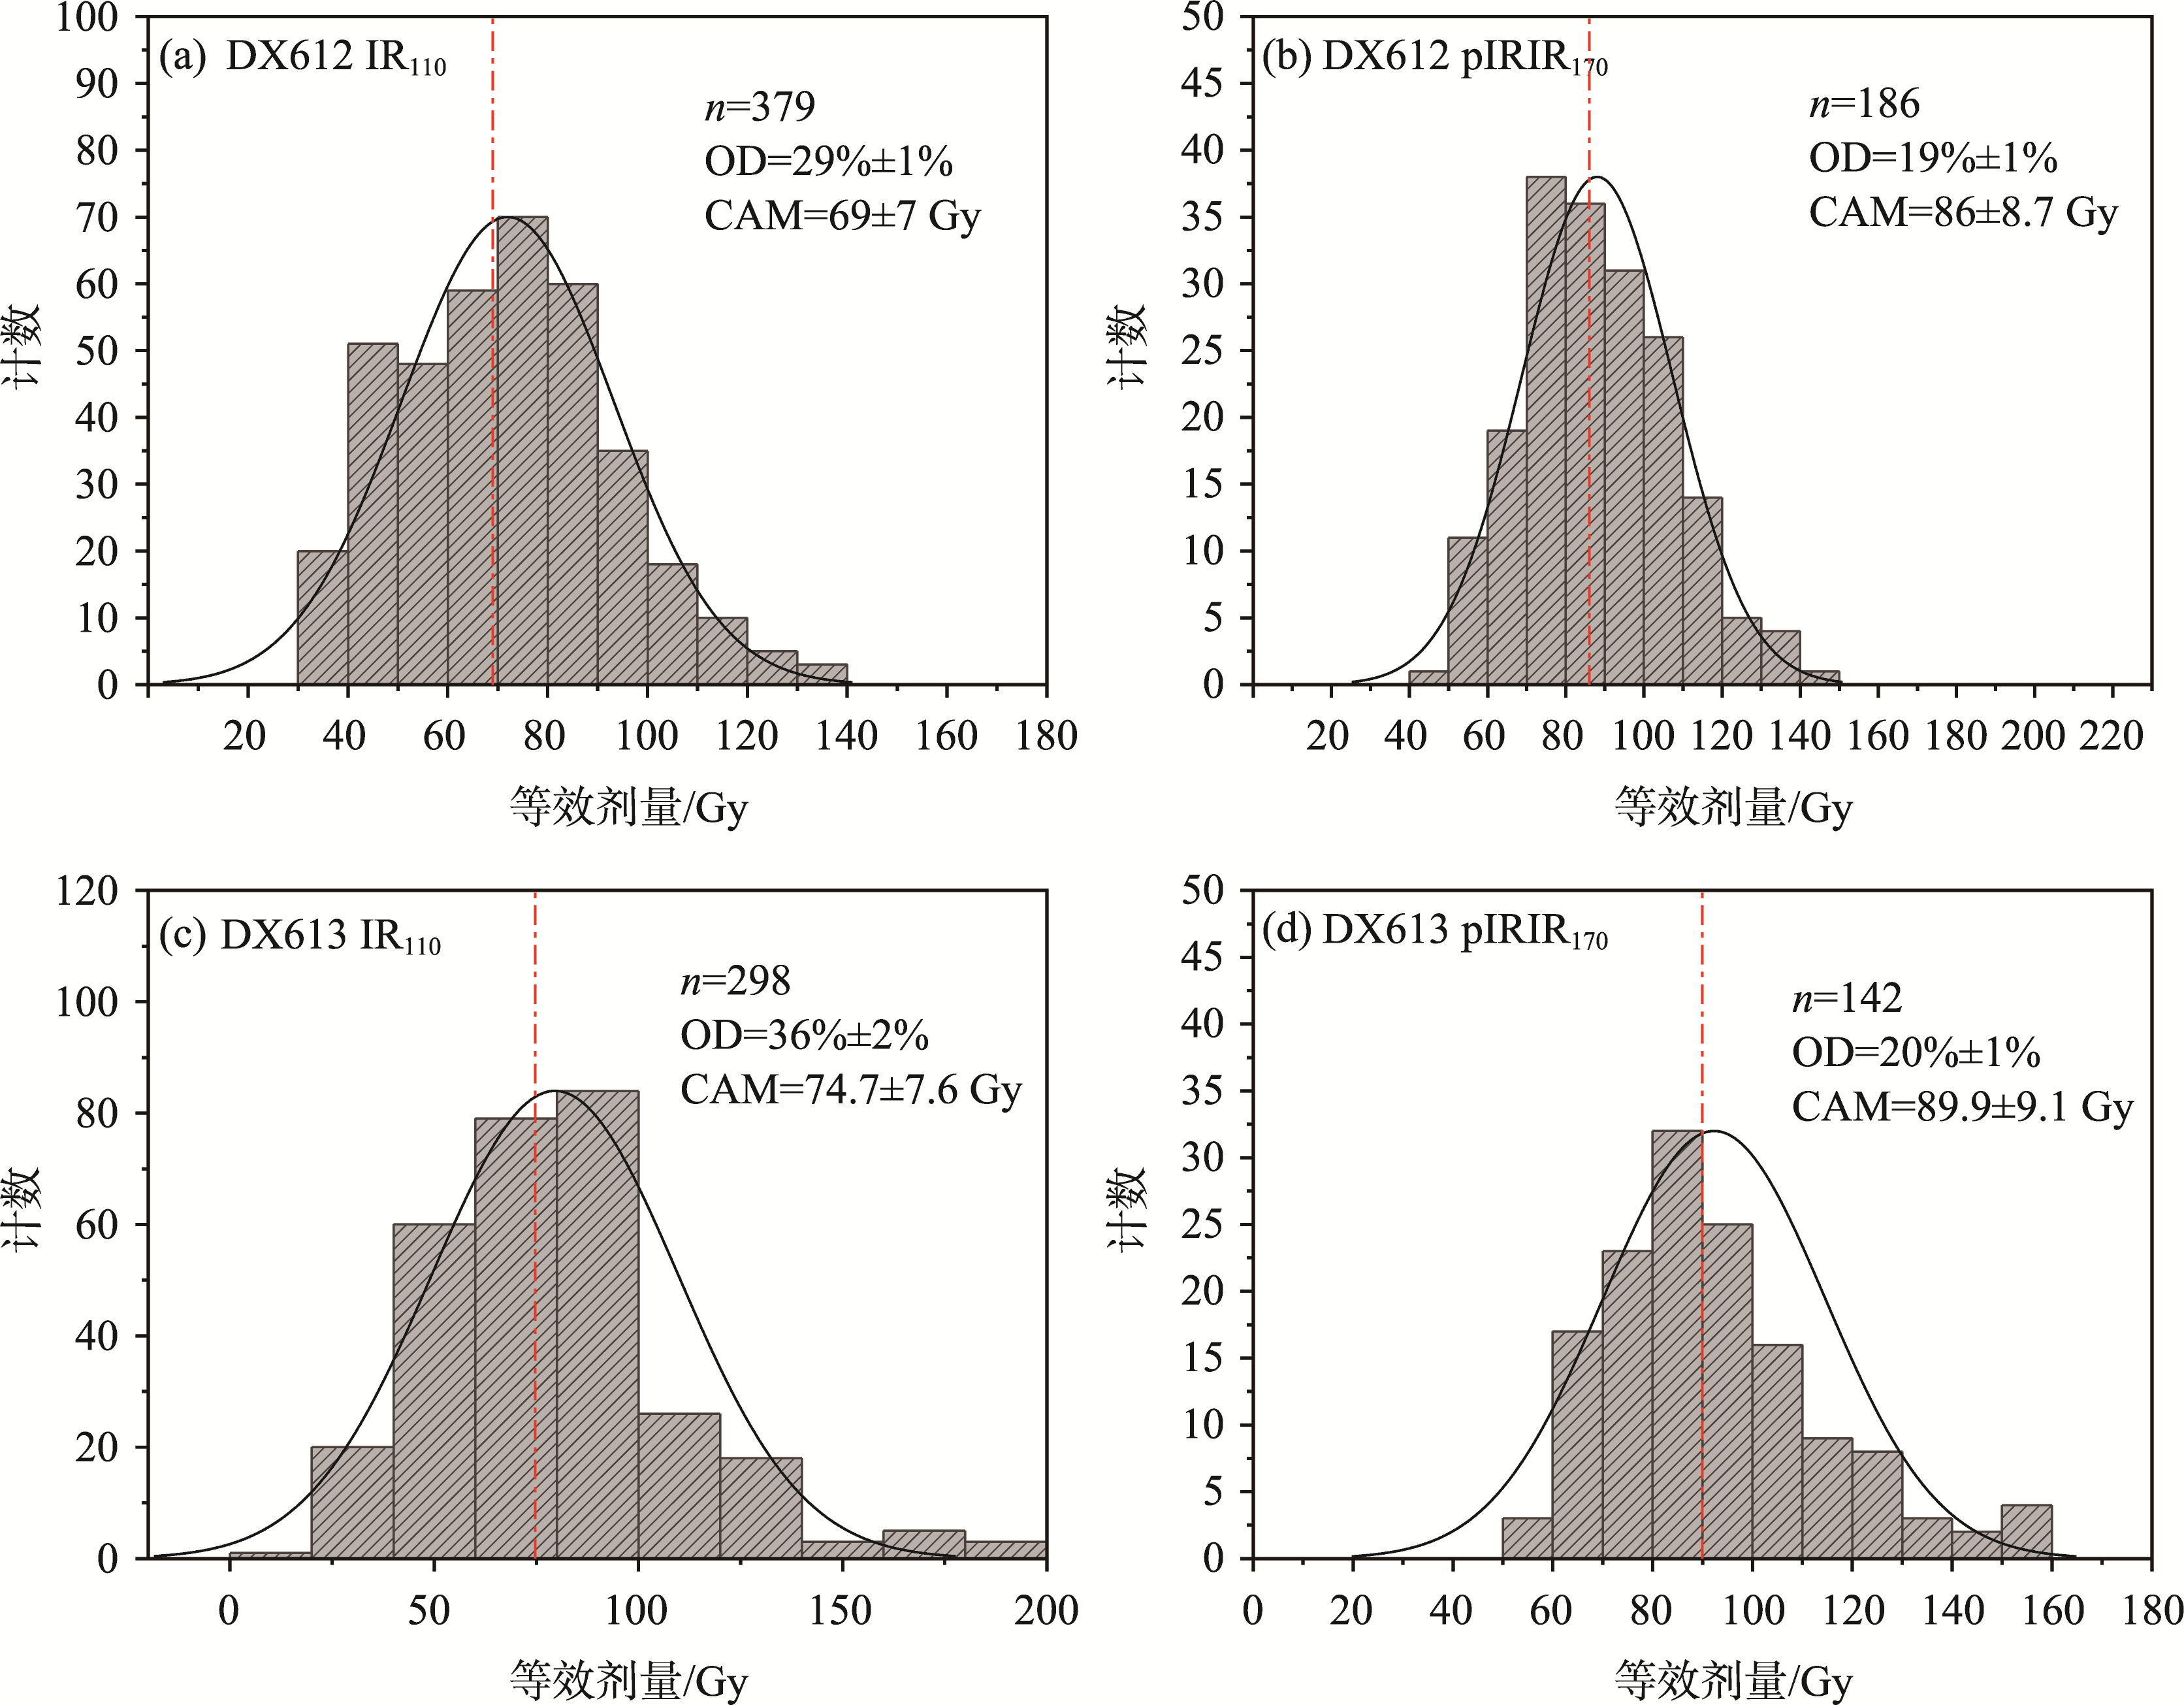
Fig.5
Frequency distribution of equivalent dose (D
e
) values
Other figure/table from this article
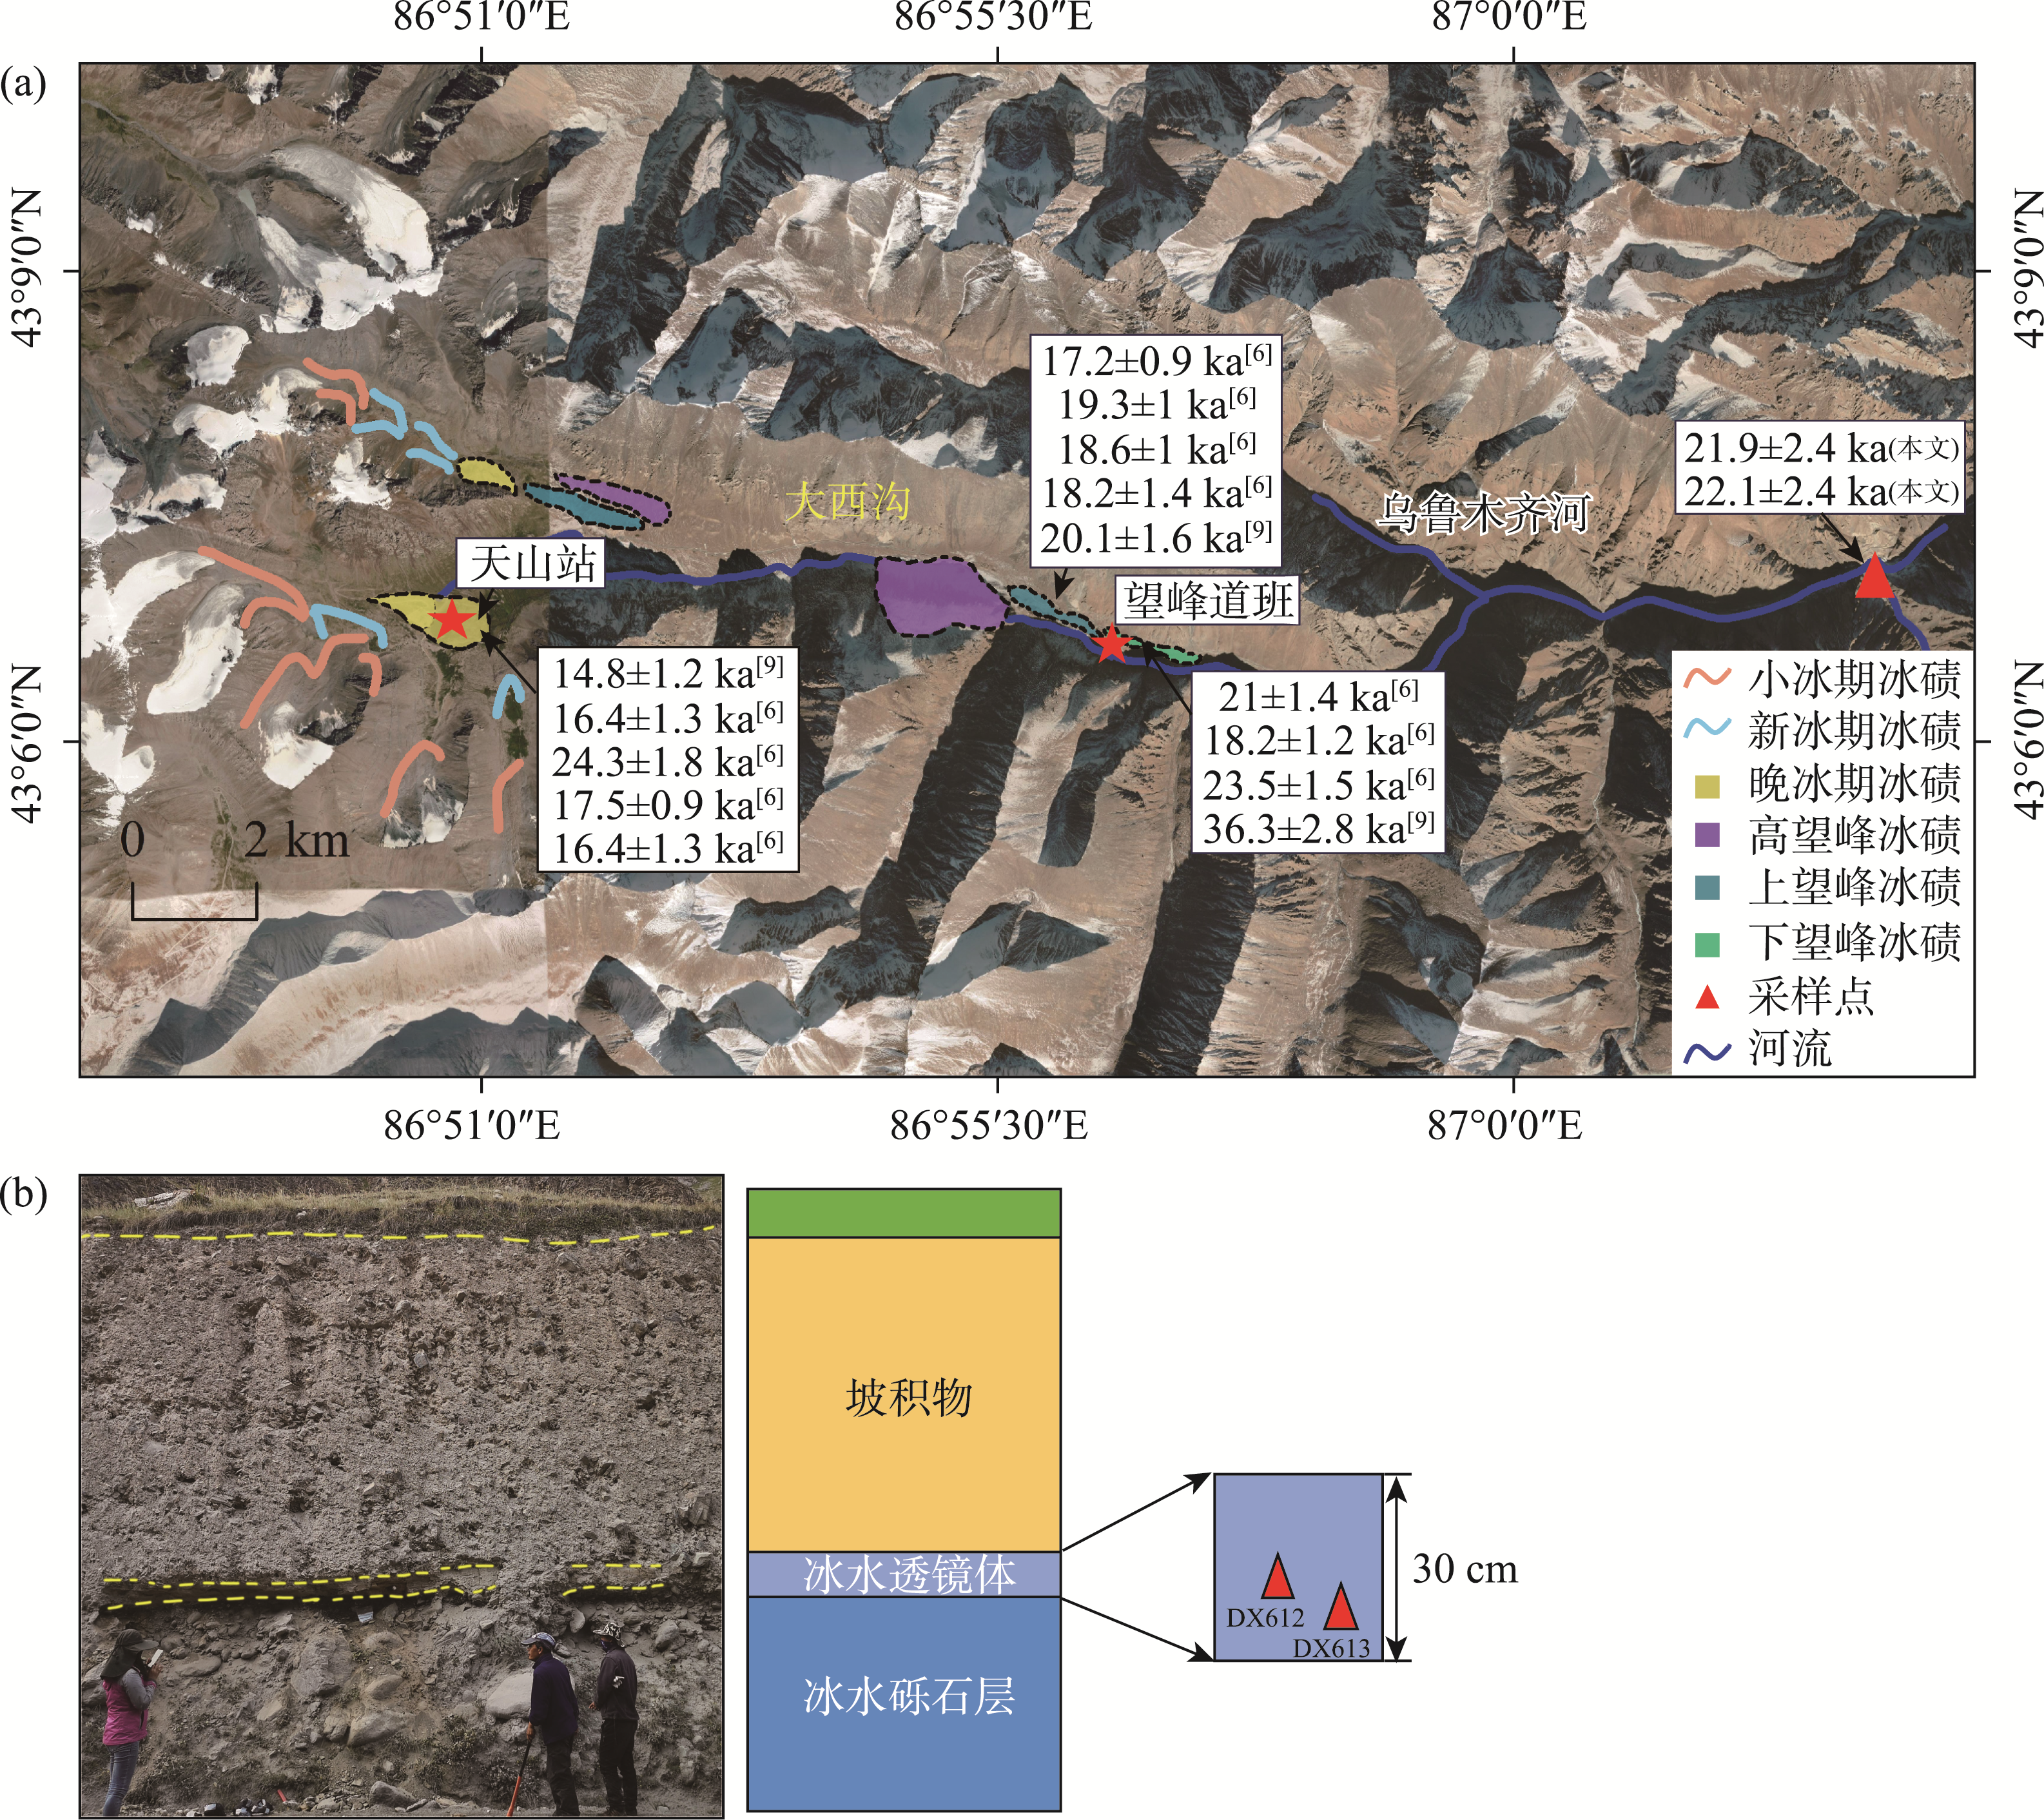
Fig.1
Location of the Daxi Valley (a) and DX612 and DX613 profiles (b)
Tab.1
Testing procedure
Fig.2
Quartz sum from individual single grain discs (synthetic small aliquots)
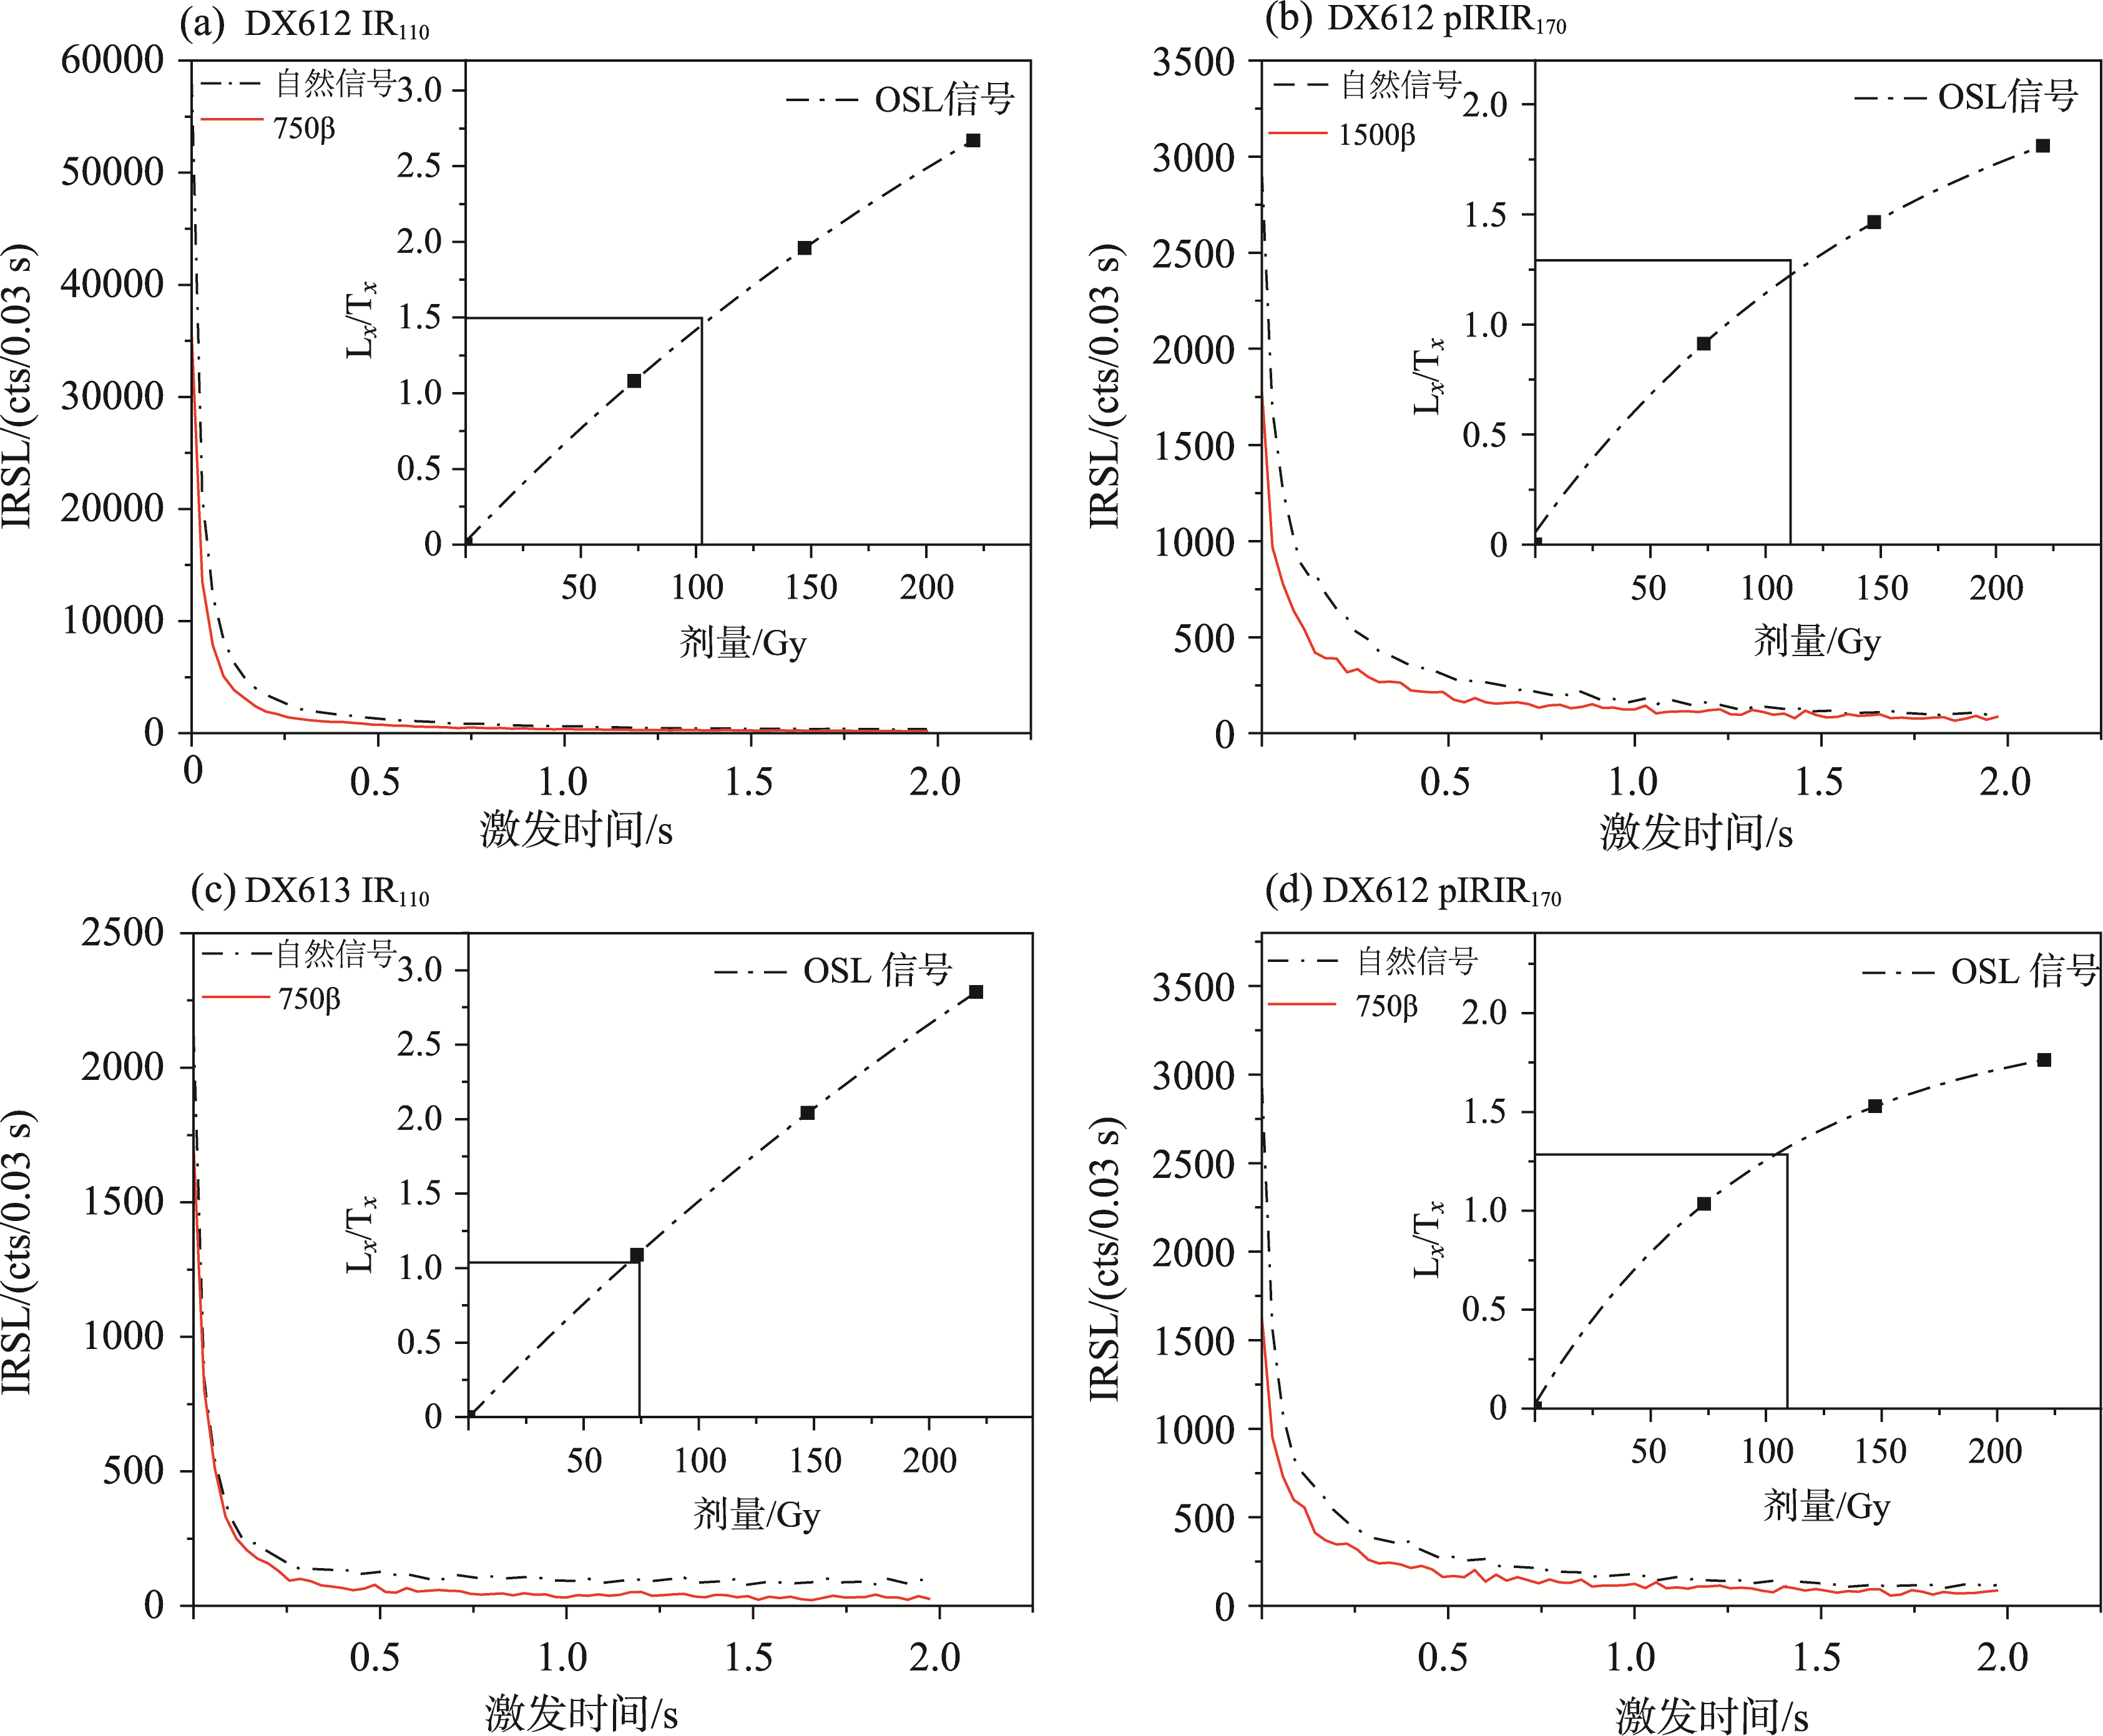
Fig.3
Decay curve and dose-response curve of representative grains from samples DX612 and DX613
Tab.2
Sample information
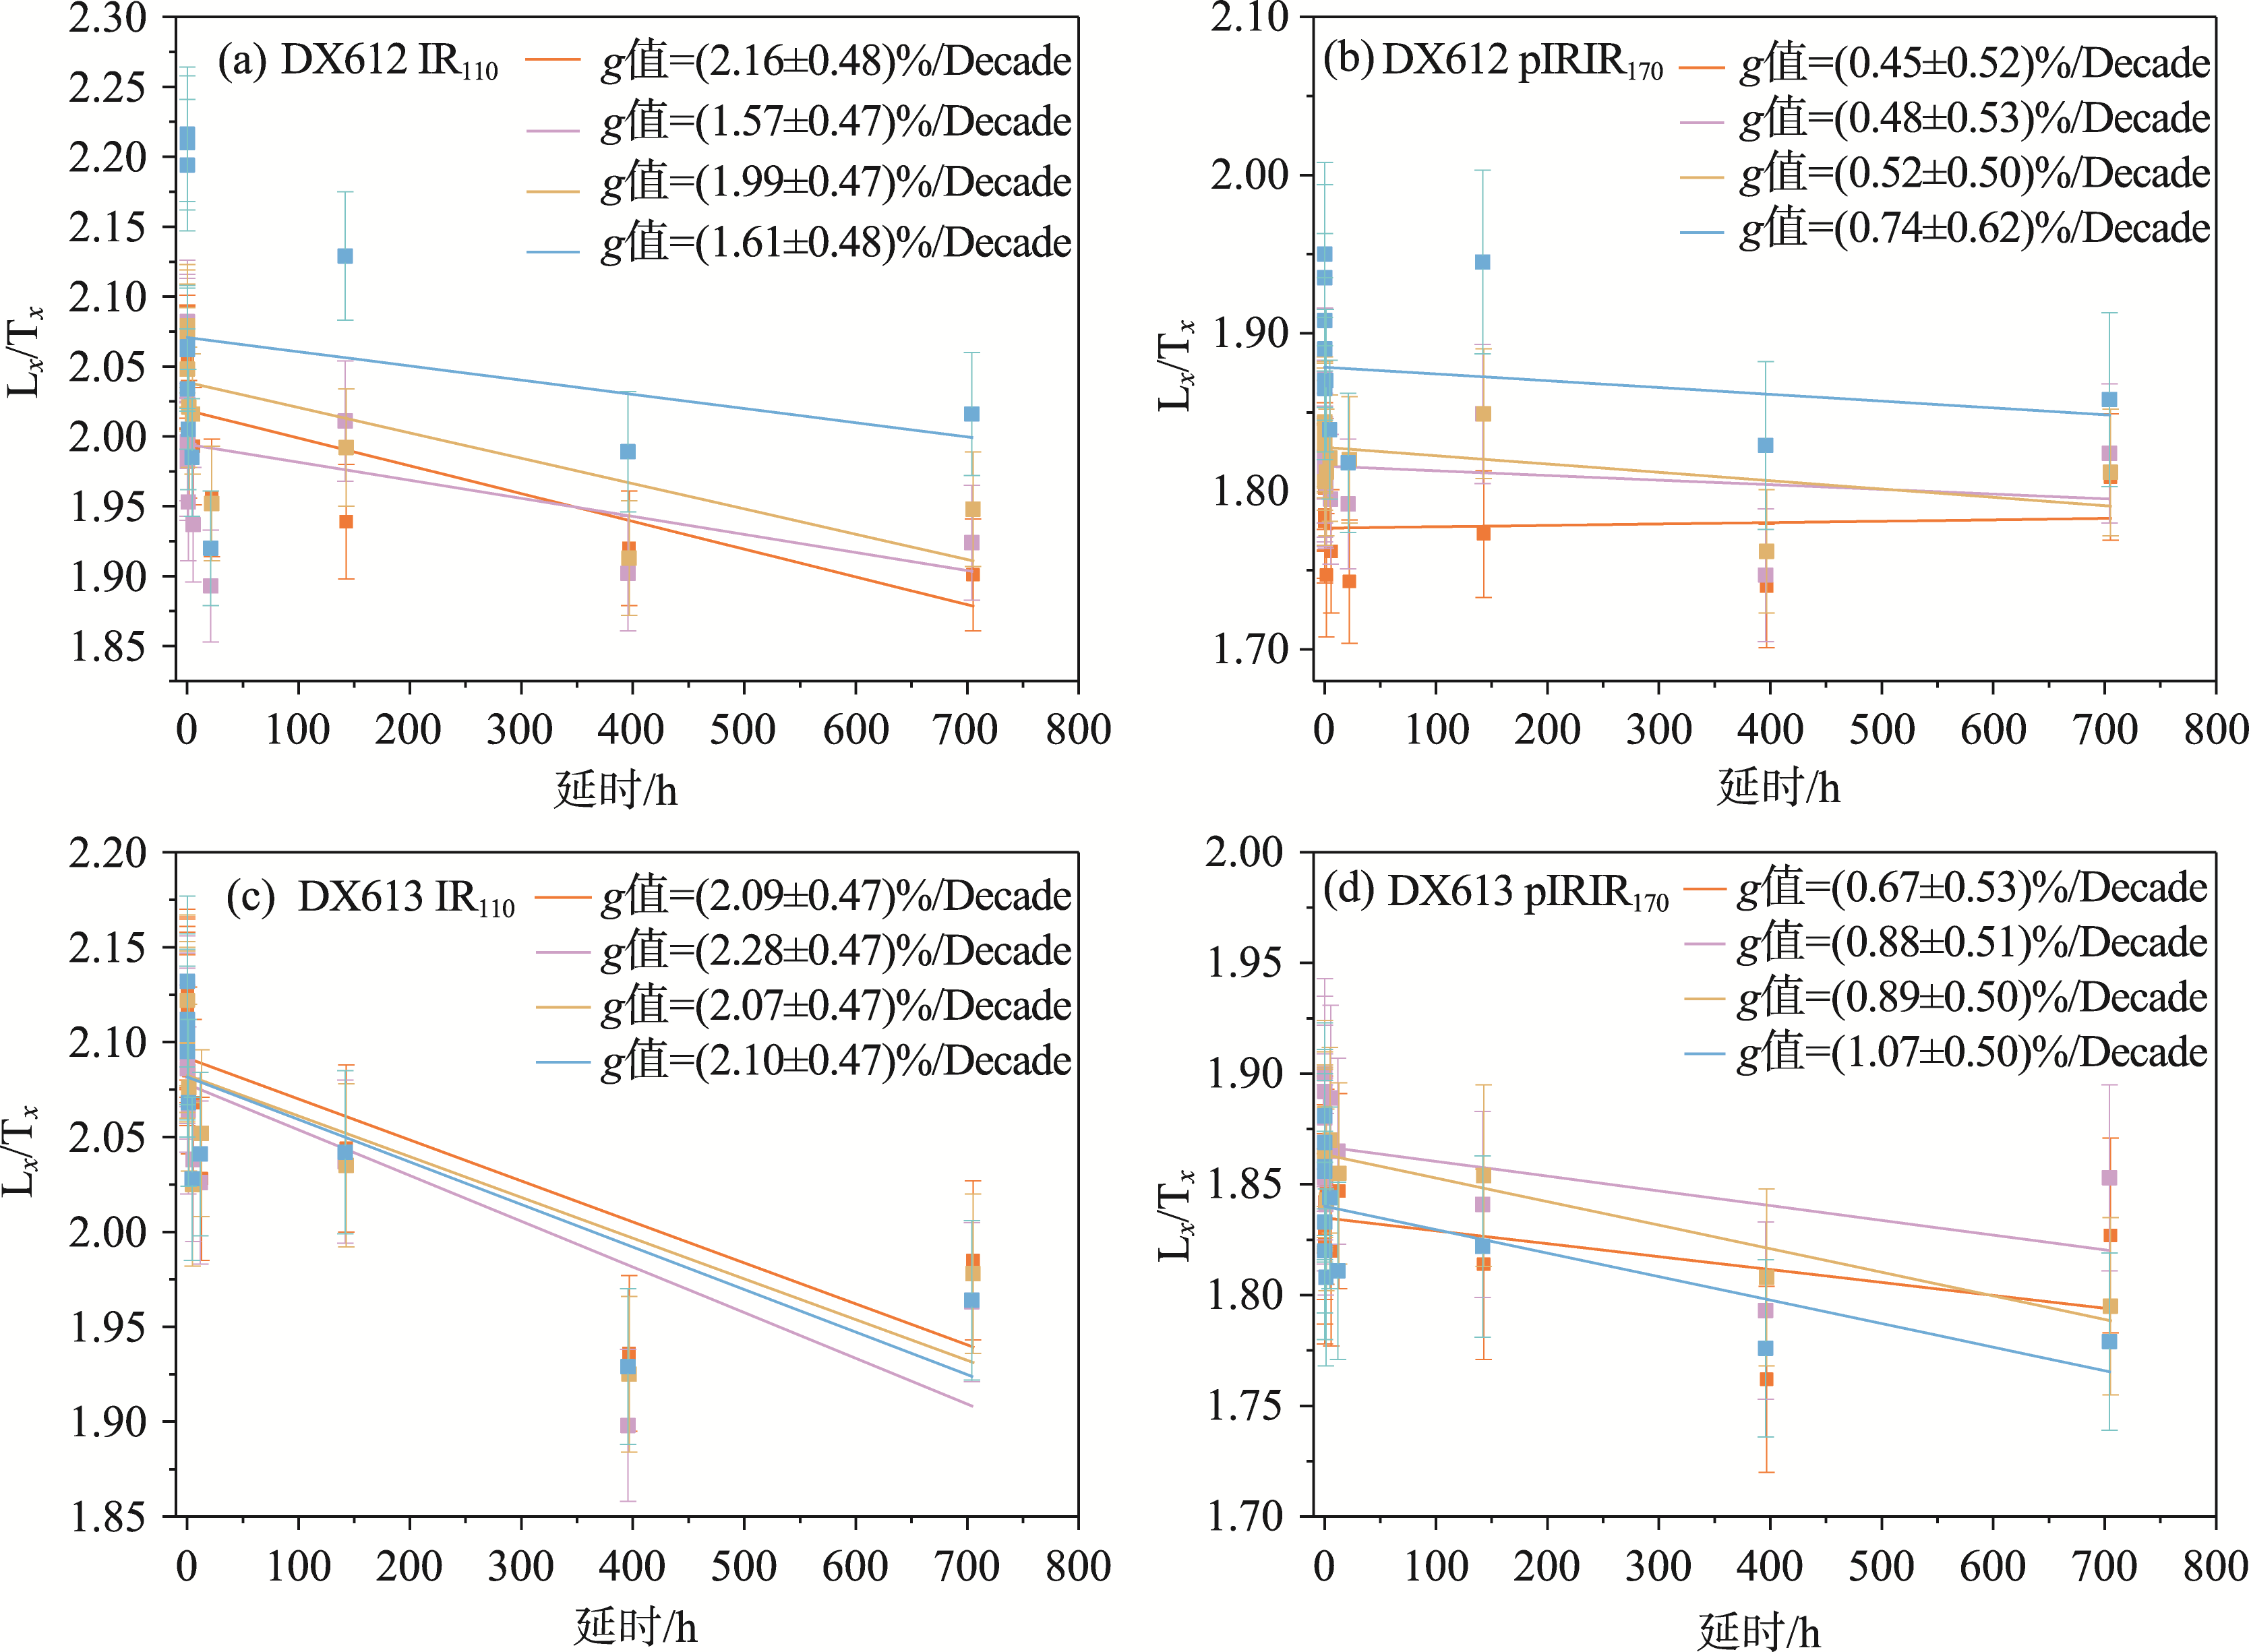
Fig.4
Anomalous fading of K-feldspar
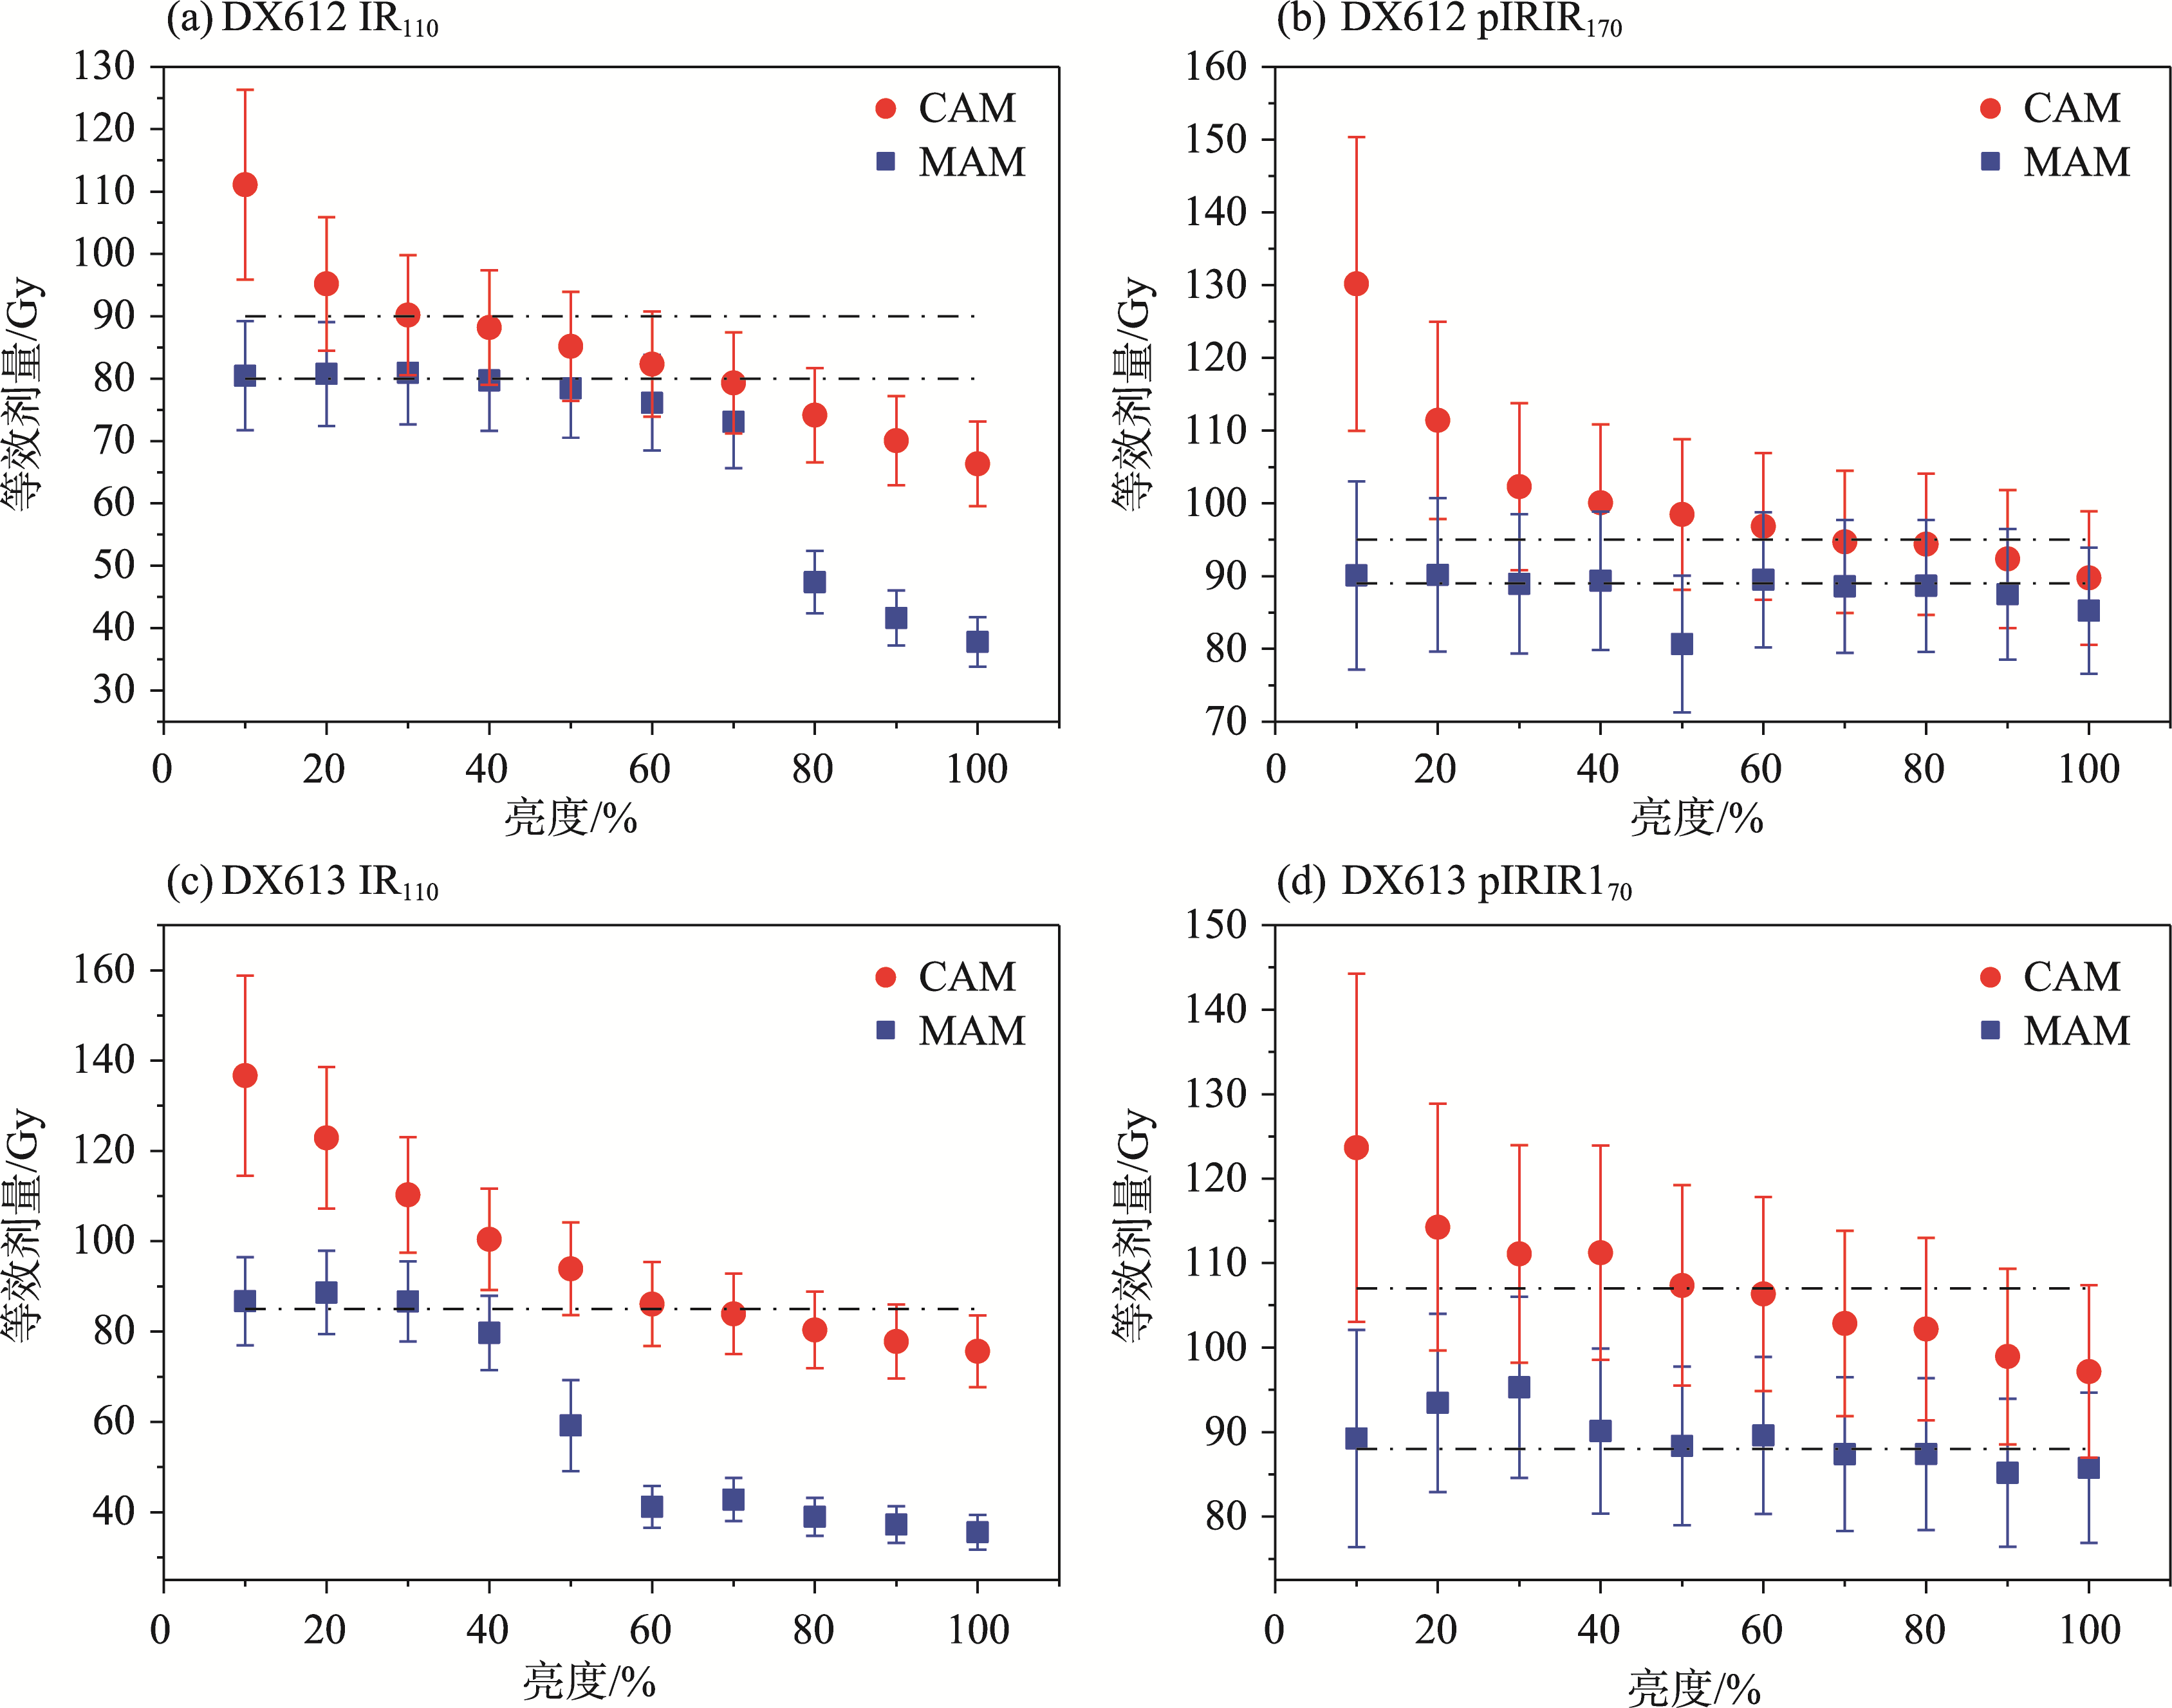
Fig.6
D
e
as a function of signal brightness for samples DX612 and DX613
Tab.3
Summary of sample luminescence dating results
Fig.7
Frequency distribution of D
e
for DX612 and DX613 after nMAD screening