
Effects of extreme runoff on total phosphorus transport in the Yangtze River Basin: A case study for low-medium order streams
Received date: 2025-02-11
Revised date: 2025-04-11
Online published: 2025-06-25
Supported by
National Key Research and Development Program of China, No. 2023YFF0806000.
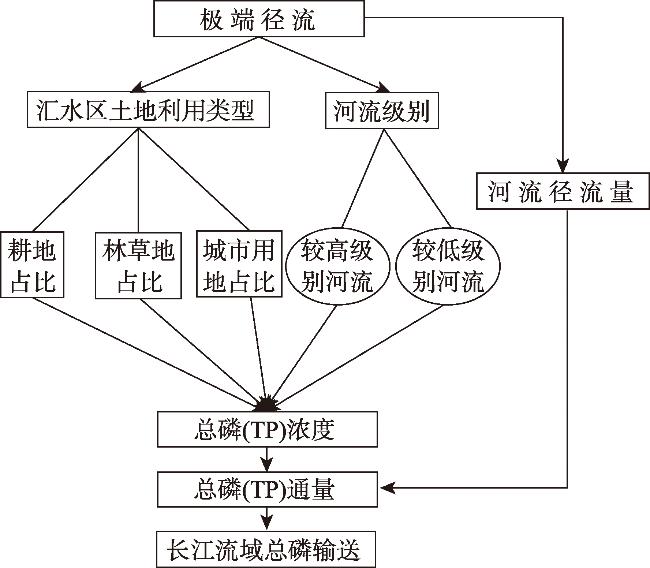
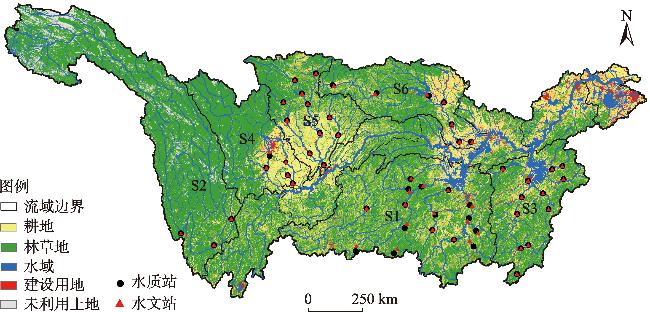
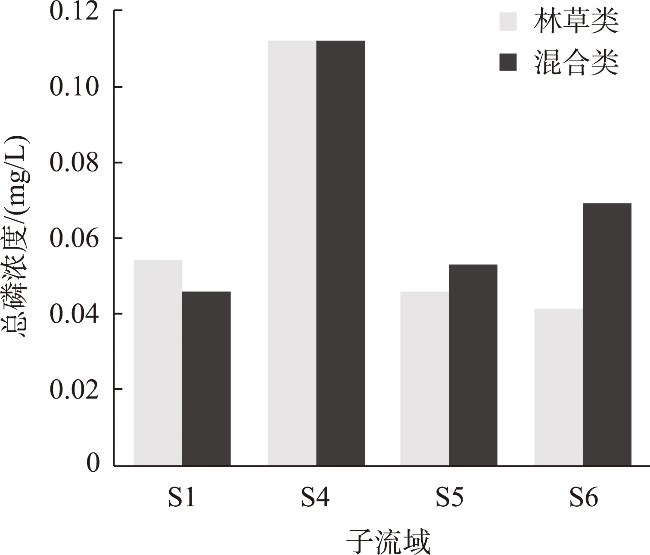
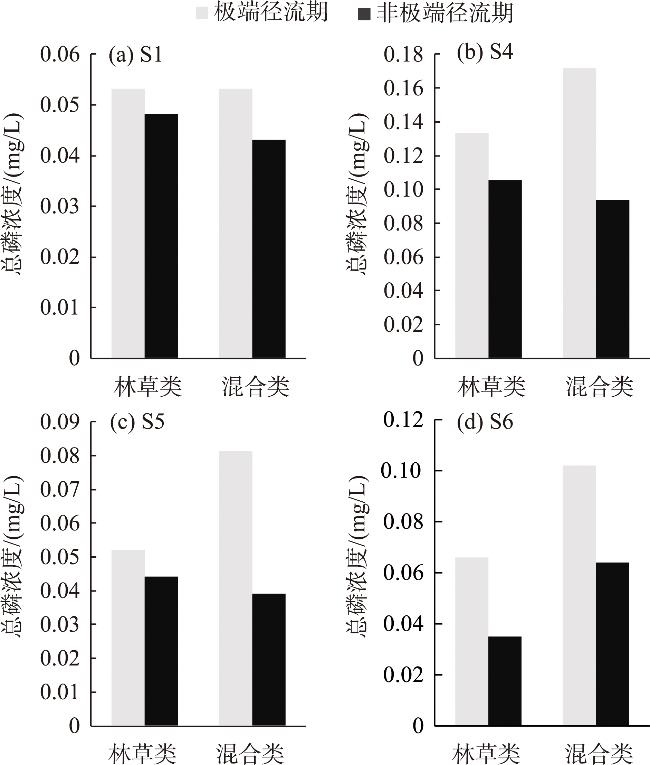
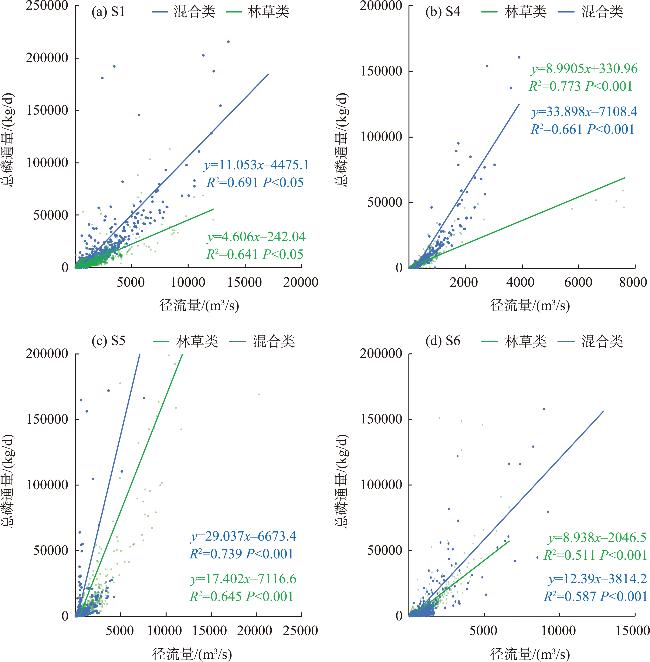
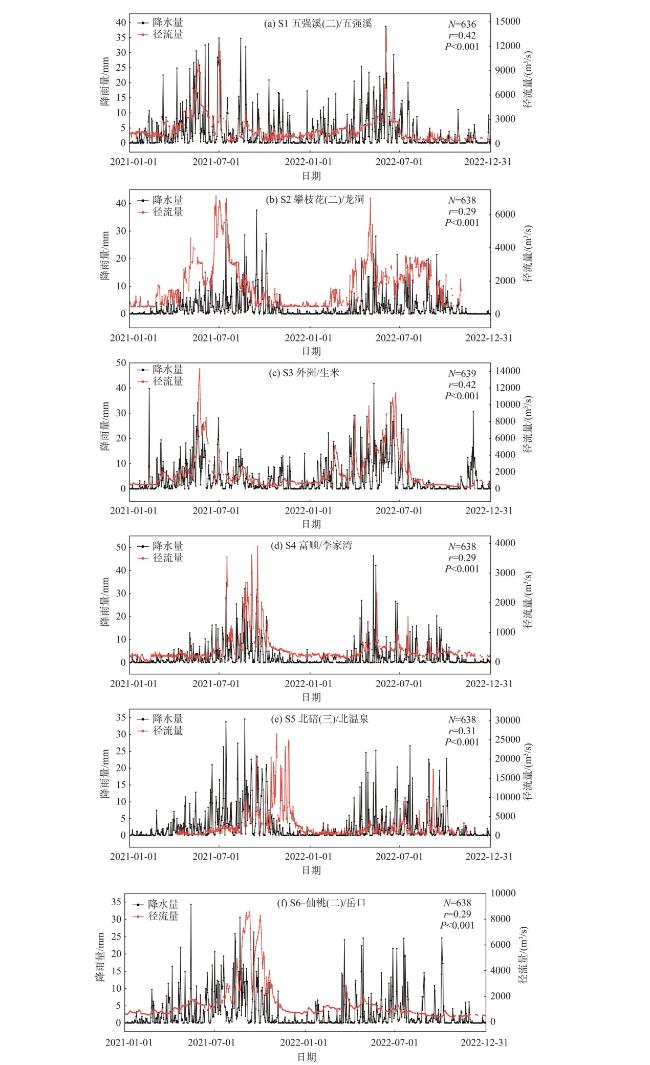
Precipitation-runoff changes have an important impact on river material (such as phosphorus) transport. With the increasing extreme runoff events in rivers under climate change, there is a lack of systematic research on their impact on total phosphorus (TP) concentration and flux in large-scale river networks. Based on the daily TP observation data of 54 stations in the second-fifth order rivers of the Yangtze River system, this study examined the effects of runoff changes in the eight subbasins of the Yangtze River on river TP concentration and flux changes from January 1, 2021 to December 31, 2022, and analyzed the differences in the effects of extreme runoff on river phosphorus transport under different land use types. The results show that the daily TP concentrations during extreme runoff events in most of the rivers have increased (extreme runoff period > non-extreme runoff period), and the TP flux transported by rivers during extreme runoff events contributed greatly to the annual flux. The contributions of extreme runoff to annual TP flux in low-order rivers of the second-third orders were 66.34%-83.83%, and the contributions in the 4th-5th order rivers were 50.73%-73.19%. Statistical analysis showed that the effects of extreme runoff on river phosphorus transport under different land use types were quite different, and the performance was mixed type > forest and grass type. This study clarified the impact of extreme runoff on water quality changes and material transport in large-scale river networks. The results provide a scientific reference for how river water quality changes in response to climate change and water quality control in large-scale river networks.
Key words: phosphorus; extreme runoff; concentration; flux; Yangtze River Basin
YAN Jun , WANG Fang , YU Qibiao , SHAO Yulai . Effects of extreme runoff on total phosphorus transport in the Yangtze River Basin: A case study for low-medium order streams[J]. PROGRESS IN GEOGRAPHY, 2025 , 44(6) : 1287 -1301 . DOI: 10.18306/dlkxjz.2025.06.014
表1 长江流域水质监测站及对应的水文站和子流域土地利用类型Tab.1 Water quality monitoring stations in the Yangtze River Basin and corresponding hydrological stations and land use types in the subbasins |
| 子流域 | ID | 河流 | 水质/水文站 | 河流 级别 | 耕地 占比/% | 林草地 占比/% | 城市用地 占比/% | 土地利用 类型 |
|---|---|---|---|---|---|---|---|---|
| 乌江、洞庭湖 流域 | S1 | 印江河 | 印江/西岩寺 | 2 | 19.65 | 79.42 | 0.46 | 林草类 |
| 汨罗江 | 伍市/南渡 | 2 | 18.86 | 78.63 | 1.29 | 林草类 | ||
| 永乐江 | 安仁/永乐江 | 2 | 22.11 | 74.79 | 1.34 | 林草类 | ||
| 澧水 | 张家界/永定澄潭 | 3 | 23.25 | 75.43 | 0.73 | 林草类 | ||
| 渠水 | 通道/地阳坪 | 3 | 11.44 | 88.44 | 0.42 | 林草类 | ||
| 耒水 | 耒阳/大河滩 | 4 | 17.50 | 77.07 | 2.97 | 林草类 | ||
| 资水 | 冷水江(二)/球溪 | 4 | 33.23 | 63.11 | 2.47 | 混合类 | ||
| 邵阳/桂花渡水厂 | 4 | 30.22 | 66.95 | 1.76 | 混合类 | |||
| 桃江(二)/桃谷山 | 4 | 28.10 | 68.40 | 2.00 | 混合类 | |||
| 清水江 | 施洞/平敏大桥 | 4 | 33.50 | 63.72 | 2.34 | 混合类 | ||
| 湘江 | 衡山(二)/熬洲 | 5 | 27.23 | 68.73 | 2.57 | 混合类 | ||
| 株洲/霞湾 | 5 | 27.26 | 68.49 | 2.74 | 混合类 | |||
| 沅水 | 安江/萝卜湾 | 5 | 20.63 | 77.52 | 1.05 | 林草类 | ||
| 浦市(二)/浦市上游 | 5 | 20.85 | 77.13 | 1.12 | 林草类 | |||
| 五强溪(二)/五强溪 | 5 | 20.27 | 77.75 | 1.09 | 林草类 | |||
| 剑江 | 下司(二)/兴仁桥 | 5 | 33.66 | 64.34 | 2.28 | 混合类 | ||
| 金沙江上游、 雅砻江流域 | S2 | 安宁河 | 德昌/阿七大桥 | 2 | 24.15 | 72.65 | 1.58 | 林草类 |
| 金沙江 | 石鼓/新华 | 5 | 2.36 | 80.42 | 0.15 | 林草类 | ||
| 攀枝花(二)/龙洞 | 5 | 3.38 | 98.41 | 0.16 | 林草类 | |||
| 鄱阳湖流域 | S3 | 盱江 | 南丰/超坊 | 2 | 20.07 | 78.29 | 0.94 | 林草类 |
| 太平江 | 杜头/龙南自来水厂 | 2 | 13.33 | 83.48 | 2.08 | 林草类 | ||
| 信江 | 弋阳/弋阳 | 3 | 22.82 | 73.48 | 2.99 | 林草类 | ||
| 桃江 | 居龙滩/桃江江口 | 3 | 17.06 | 80.54 | 1.88 | 林草类 | ||
| 抚河 | 廖家湾/钟岭水厂 | 3 | 23.01 | 73.29 | 1.48 | 林草类 | ||
| 乐安河 | 虎山/野鸡山村 | 3 | 12.00 | 86.67 | 1.63 | 林草类 | ||
| 香屯/戴村 | 3 | 15.67 | 81.19 | 2.07 | 林草类 | |||
| 修河 | 高沙/三都 | 4 | 15.33 | 82.78 | 0.88 | 林草类 | ||
| 梅川江 | 汾坑/梅江江口 | 4 | 19.32 | 78.26 | 1.45 | 林草类 | ||
| 赣江 | 吉安/金滩 | 5 | 22.84 | 72.91 | 2.75 | 林草类 | ||
| 外洲/生米 | 5 | 24.30 | 70.71 | 3.20 | 林草类 | |||
| 樟树/大洋洲 | 5 | 22.84 | 72.91 | 2.75 | 林草类 | |||
| 泯沱江流域 | S4 | 威远河 | 自贡/廖家堰 | 3 | 77.76 | 16.06 | 5.49 | 混合类 |
| 岷江 | 青神/悦来渡口 | 4 | 18.75 | 74.43 | 5.56 | 林草类 | ||
| 彭山(四)/岳店子下 | 4 | 14.20 | 79.22 | 5.44 | 林草类 | |||
| 沱江 | 登瀛岩/幸福村 | 4 | 71.10 | 18.82 | 7.93 | 混合类 | ||
| 富顺/李家湾 | 4 | 77.55 | 14.52 | 6.02 | 混合类 | |||
| 嘉陵江流域 | S5 | 涪江 | 江油/福田坝 | 3 | 10.62 | 88.42 | 0.22 | 林草类 |
| 平武/平武 | 3 | 4.26 | 95.10 | 0.05 | 林草类 | |||
| 巴河 | 巴中/手傍岩 | 3 | 35.00 | 64.16 | 0.68 | 混合类 | ||
| 渠江 | 三汇/大蹬沟 | 4 | 46.75 | 51.51 | 0.89 | 混合类 | ||
| 白龙江 | 三磊坝(三)/苴国村 | 4 | 12.46 | 85.53 | 0.50 | 林草类 | ||
| 武都/固水子村 | 4 | 11.33 | 85.82 | 0.54 | 林草类 | |||
| 碧口/姚渡 | 4 | 11.02 | 86.96 | 0.49 | 林草类 | |||
| 嘉陵江 | 北碚(三)/北温泉 | 5 | 43.02 | 54.26 | 1.38 | 混合类 | ||
| 金溪/金溪电站 | 5 | 27.18 | 70.48 | 0.98 | 林草类 | |||
| 略阳/白水江 | 5 | 25.89 | 72.17 | 1.49 | 林草类 | |||
| 涪江 | 小河坝(三)/玉溪 | 5 | 49.08 | 46.54 | 3.00 | 混合类 | ||
| 汉江流域 | S6 | 东荆河 | 潜江/潜江大桥 | 2 | 61.25 | 21.98 | 13.36 | 混合类 |
| 唐白河 | 董坡/张湾 | 3 | 65.13 | 23.89 | 9.19 | 混合类 | ||
| 汉江 | 汉中/梁西渡 | 4 | 19.11 | 79.72 | 0.92 | 林草类 | ||
| 安康/老君关 | 5 | 26.16 | 72.33 | 0.86 | 林草类 | |||
| 皇庄/皇庄 | 5 | 31.14 | 64.49 | 2.66 | 混合类 | |||
| 黄家港/沈湾 | 5 | 21.77 | 76.19 | 0.92 | 林草类 | |||
| 仙桃(二)/岳口 | 5 | 34.90 | 58.31 | 3.64 | 混合类 |
表2 长江流域各子流域各级别河流非极端径流期、极端径流期TP浓度均值变化Tab.2 Variation of average total phosphorus concentration in non-extreme runoff period and extreme runoff period of rivers at all levels in each subbasin of the Yangtze River Basin |
| 子流域 | 河流级别 | 河流TP浓度均值/(mg/L) | 河流TP浓度 变化/(mg/L) | |
|---|---|---|---|---|
| 非极端径流期 | 极端径流期 | |||
| S1 | 2 | 0.071 | 0.083 | 0.012 |
| 3 | 0.023 | 0.056 | 0.033 | |
| 4 | 0.051 | 0.051 | 0 | |
| 5 | 0.037 | 0.052 | 0.015 | |
| S2 | 2 | 0.057 | 0.036 | -0.021 |
| 5 | 0.013 | 0.025 | 0.012 | |
| S3 | 2 | 0.043 | 0.066 | 0.023 |
| 3 | 0.058 | 0.071 | 0.013 | |
| 4 | 0.047 | 0.058 | 0.011 | |
| 5 | 0.039 | 0.057 | 0.018 | |
| S4 | 3 | 0.101 | 0.122 | 0.021 |
| 4 | 0.099 | 0.166 | 0.067 | |
| S5 | 3 | 0.021 | 0.032 | 0.011 |
| 4 | 0.048 | 0.067 | 0.019 | |
| 5 | 0.033 | 0.050 | 0.017 | |
| S6 | 2 | 0.041 | 0.075 | 0.034 |
| 3 | 0.136 | 0.221 | 0.085 | |
| 4 | 0.038 | 0.094 | 0.056 | |
| 5 | 0.041 | 0.061 | 0.020 | |
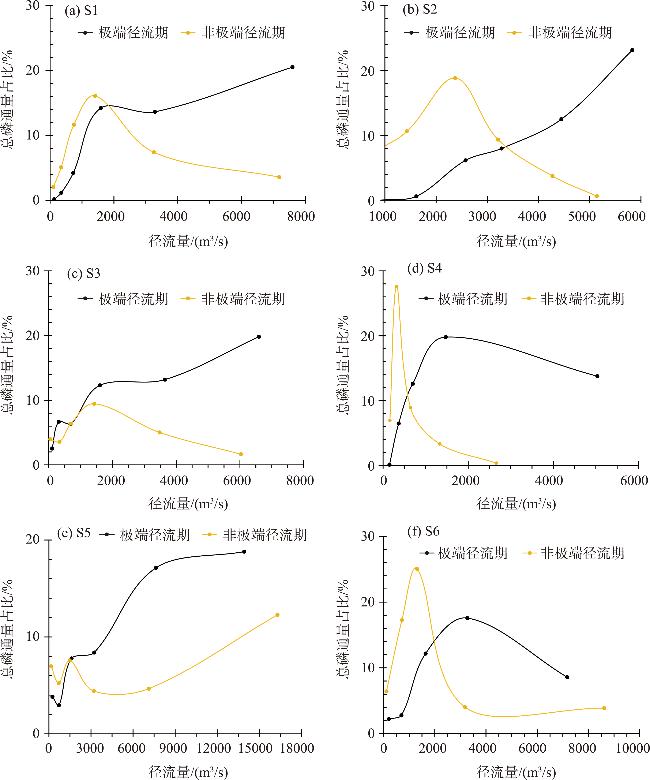
图4 长江各子流域极端径流期和非极端径流期总磷通量占比注:横坐标为非极端径流期、极端径流期径流区间内所有数据点径流量的均值,纵坐标为径流区间内所有数据点总磷占比之和,线为平滑线。 Fig.4 Proportion of total phosphorus flux in extreme runoff period and non-extreme runoff period in each subbasin of the Yangtze River Basin |
表3 长江流域各子流域河流非极端径流期、极端径流期径流量均值及TP通量占比Tab.3 The mean runoff and total phosphorus flux ratio of non-extreme runoff period and extreme runoff period in each subbasin of the Yangtze River Basin |
| 子流域 | 径流区间/(m3/s) | 非极端径流期 | 极端径流期 | |||||
|---|---|---|---|---|---|---|---|---|
| 径流量均值/(m3/s) | 数据点个数/个 | TP通量占比/% | 径流量均值/(m3/s) | 数据点个数/个 | TP通量占比/% | |||
| S1 | [0, 200] | 104.06 | 1722 | 2.08 | 133.29 | 142 | 0.19 | |
| (200, 500] | 346.97 | 1183 | 5.10 | 353.86 | 279 | 1.20 | ||
| (500, 1000] | 746.78 | 1263 | 11.66 | 727.28 | 403 | 4.25 | ||
| (1000, 2500] | 1412.88 | 705 | 16.09 | 1584.95 | 537 | 14.20 | ||
| (2500, 5000] | 3252.49 | 109 | 7.42 | 3285.41 | 193 | 13.63 | ||
| > 5000 | 7180.19 | 21 | 3.59 | 7592.87 | 70 | 20.50 | ||
| S2 | [0, 1000] | 569.10 | 437 | 6.39 | 928.00 | 1 | 0.02 | |
| (1000, 2000] | 1427.23 | 159 | 10.63 | 1613.57 | 14 | 0.60 | ||
| (2000, 3000] | 2372.16 | 97 | 18.84 | 2574.58 | 48 | 6.15 | ||
| (3000, 4000] | 3208.57 | 35 | 9.36 | 3278.21 | 39 | 7.98 | ||
| (4000, 5000] | 4272.86 | 7 | 3.72 | 4447.22 | 18 | 12.50 | ||
| > 5000 | 5140.00 | 1 | 0.63 | 5832.92 | 24 | 23.15 | ||
| S3 | [0, 200] | 49.21 | 2465 | 3.96 | 106.07 | 783 | 2.53 | |
| (200, 500] | 337.94 | 532 | 3.57 | 315.04 | 594 | 6.68 | ||
| (500, 1000] | 698.13 | 416 | 6.39 | 696.17 | 223 | 6.37 | ||
| (1000, 2500] | 1430.29 | 283 | 9.45 | 1606.67 | 221 | 12.30 | ||
| (2500, 5000] | 3480.56 | 43 | 5.02 | 3647.03 | 107 | 13.19 | ||
| (5000, 10000] | 6031.88 | 8 | 1.65 | 6596.06 | 62 | 19.82 | ||
| > 10000 | — | — | — | 11517.82 | 11 | 9.05 | ||
| S4 | [0, 200] | 159.94 | 517 | 6.96 | 150.63 | 8 | 0.13 | |
| (200, 500] | 317.81 | 981 | 27.58 | 366.71 | 156 | 6.48 | ||
| (500, 1000] | 644.27 | 132 | 8.94 | 697.25 | 125 | 12.62 | ||
| (1000, 2500] | 1331.05 | 19 | 3.34 | 1471.67 | 60 | 19.80 | ||
| > 2500 | 2660.00 | 1 | 0.38 | 5035.75 | 13 | 13.78 | ||
| S5 | [0, 500] | 164.97 | 2719 | 6.97 | 251.95 | 711 | 3.83 | |
| (500, 1000] | 694.38 | 285 | 5.23 | 713.52 | 189 | 2.95 | ||
| (1000, 2500] | 1483.96 | 200 | 7.57 | 1612.16 | 162 | 7.78 | ||
| (2500, 5000] | 3200.81 | 37 | 4.42 | 3229.43 | 53 | 8.39 | ||
| (5000, 10000] | 7115.00 | 8 | 4.66 | 7623.75 | 24 | 17.12 | ||
| > 10000 | 16300.00 | 4 | 12.28 | 13925.00 | 12 | 18.80 | ||
| S6 | [0, 500] | 113.89 | 1571 | 6.44 | 208.56 | 232 | 2.22 | |
| (500, 1000] | 716.13 | 880 | 17.27 | 697.67 | 101 | 2.79 | ||
| (1000, 2500] | 1307.15 | 548 | 25.05 | 1640.36 | 108 | 12.17 | ||
| (2500, 5000] | 3183.85 | 13 | 4.02 | 3272.91 | 55 | 17.57 | ||
| > 5000 | 8617.50 | 4 | 3.88 | 7173.33 | 12 | 8.58 | ||
表4 长江流域各子流域各级别河流非极端径流期、极端径流期TP浓度、通量及其占比Tab.4 Concentration, flux, and proportion of total phosphorus (TP) in non-extreme runoff period and extreme runoff period of rivers at all levels in each subbasin of the Yangtze River Basin |
| 流域 | 河流级别 | 极端径流期 | 非极端径流期 | |||||
|---|---|---|---|---|---|---|---|---|
| TP浓度/(mg/L) | TP通量/(t/a) | TP通量占比/% | TP浓度/(mg/L) | TP通量/(t/a) | TP通量占比/% | |||
| S1 | 2 | 0.093 | 1088.76 | 81.69 | 0.075 | 244.06 | 18.31 | |
| 3 | 0.056 | 102.56 | 73.35 | 0.023 | 37.26 | 26.65 | ||
| 4 | 0.050 | 969.13 | 66.43 | 0.040 | 489.77 | 33.57 | ||
| 5 | 0.052 | 10758.75 | 59.38 | 0.037 | 7360.73 | 40.62 | ||
| S2 | 2 | 0.036 | 100.77 | 81.57 | 0.058 | 22.77 | 18.43 | |
| 5 | 0.025 | 1403.60 | 42.58 | 0.013 | 1892.65 | 57.42 | ||
| S3 | 2 | 0.066 | 184.06 | 80.07 | 0.043 | 45.82 | 19.93 | |
| 3 | 0.071 | 2703.91 | 76.81 | 0.058 | 816.28 | 23.19 | ||
| 4 | 0.058 | 623.05 | 76.99 | 0.047 | 186.21 | 23.01 | ||
| 5 | 0.057 | 8604.71 | 68.09 | 0.039 | 4032.54 | 31.91 | ||
| S4 | 3 | 0.122 | 90.76 | 84.58 | 0.101 | 16.54 | 15.42 | |
| 4 | 0.166 | 5160.47 | 52.80 | 0.100 | 4613.19 | 47.20 | ||
| S5 | 3 | 0.032 | 362.75 | 75.12 | 0.021 | 120.16 | 24.88 | |
| 4 | 0.068 | 6345.90 | 77.68 | 0.048 | 1822.99 | 22.32 | ||
| 5 | 0.050 | 4953.59 | 44.83 | 0.033 | 6095.98 | 55.17 | ||
| S6 | 2 | 0.075 | 734.47 | 92.00 | 0.041 | 63.89 | 8.00 | |
| 3 | 0.221 | 233.64 | 21.84 | 0.136 | 836.16 | 78.16 | ||
| 4 | 0.094 | 788.20 | 92.05 | 0.038 | 68.10 | 7.95 | ||
| 5 | 0.061 | 3890.46 | 38.76 | 0.041 | 6146.34 | 61.24 | ||
| [1] |
中华人民共和国生态环境部. 2020中国生态环境状况公报[EB/OL]. 2021-05-24 [2024-10-19]. https://www.mee.gov.cn/hjzl/sthjzk/zghjzkgb/202105/P020210526572756184785.pdf.
[Ministry of Ecology and Environment of the People's Republic of China. 2020 China ecological environment bulletin. 2021-05-24 [2024-10-19]. https://www.mee.gov.cn/hjzl/sthjzk/zghjzkgb/202105/P020210526572756184785.pdf.]
|
| [2] |
中华人民共和国生态环境部. 2019中国生态环境状况公报[EB/OL]. 2020-05-18 [2024-10-19]. https://www.mee.gov.cn/hjzl/sthjzk/zghjzkgb/202006/P020200602509464172096.pdf.
[Ministry of Ecology and Environment of the People's Republic of China. 2019 China Ecological Environment Bulletin. 2020-05-18 [2024-10-19]. https://www.mee.gov.cn/hjzl/sthjzk/zghjzkgb/202006/P020200602509464172096.pdf.]
|
| [3] |
IPCC. Climate change 2021: The physical science basis: Working Group I contribution to the sixth assessment report of the Intergovernmental Panel on Climate Change[M]. Cambridge, UK: Cambridge University Press, 2023.
|
| [4] |
|
| [5] |
|
| [6] |
李发荣, 邱学礼, 周璟, 等. 滇池东南岸农业和富磷区入湖河流地表径流及污染特征[J]. 中国环境监测, 2014, 30(6): 93-101.
[
|
| [7] |
刘忠翰, 贺彬, 王宜明, 等. 滇池不同流域类型降雨径流对河流氮磷入湖总量的影响[J]. 地理研究, 2004, 23(5): 593-604.
[
|
| [8] |
高超, 李阳, 于海明, 等. 典型自然降雨条件下太湖地区水稻田氮磷输出特点[J]. 生态环境学报, 2015, 24(5): 845-852.
[
|
| [9] |
牛玉国, 张金鹏. 对黄河流域生态保护和高质量发展国家战略的几点思考[J]. 人民黄河, 2020, 42(11): 1-4, 10.
[
|
| [10] |
|
| [11] |
|
| [12] |
|
| [13] |
|
| [14] |
|
| [15] |
|
| [16] |
|
| [17] |
|
| [18] |
许继军, 杨大文, 雷志栋, 等. 长江流域降水量和径流量长期变化趋势检验[J]. 人民长江, 2006(9): 63-67.
[
|
| [19] |
张睿, 曾春芬, 龙秋波, 等. 1960—2022年洞庭湖流域多尺度径流量演变特征分析[J]. 水资源与水工程学报, 2024, 35(4): 38-46.
[
|
| [20] |
|
| [21] |
|
| [22] |
周艳青, 冯嘉申, 段亭亭, 等. 板桥河小流域降雨事件中地表水磷浓度的变化特征[J]. 环境科学学报, 2022, 42(11): 131-138.
[
|
| [23] |
连心桥, 朱广伟, 杨文斌, 等. 强降雨对平原河网区入湖河道氮、磷影响[J]. 环境科学, 2020, 41(11): 4970-4980.
[
|
| [24] |
|
| [25] |
|
| [26] |
晏维金, 李青倩, 王芳, 等. 长江流域磷及“三磷”入河通量及其对干流关键断面磷通量的贡献: 模型与情景分析[J]. 环境科学学报, 2022, 42(11): 149-159.
[
|
| [27] |
赵君, 王鹏, 余小芳. 温度和降水对赣江流域土地利用方式与河流氮磷营养盐相关性的影响[J]. 江西师范大学学报(自然科学版), 2018, 42(6): 655-660.
[
|
| [28] |
|
| [29] |
王翊晨, 姚治君, 刘兆飞, 等. 太湖流域宜溧河与西苕溪水质对比分析[J]. 地理科学进展, 2011, 30(7): 853-860.
[
|
| [30] |
程千云. 降雨条件下阜阳市河流非点源污染输出特征[J]. 水科学与工程技术, 2020(4): 5-8.
[
|
| [31] |
王亚博, 李慧莉, 张洪刚, 等. 极端降水过程对岩口水库入库溪流污染负荷的影响及其对策[J]. 环境工程学报, 2022, 16(6): 2061-2072.
[
|
| [32] |
郑佳琦. 长江黄河流域氮磷通量时空变化规律及关键驱动因素研究[D]. 北京: 中国环境科学研究院, 2022.
[
|
/
| 〈 |
|
〉 |