
Spatial influence of police inspection activities on theft crimes: A case study in Haining City, Zhejiang
Received date: 2024-03-15
Revised date: 2024-04-29
Online published: 2024-11-26
Supported by
National Natural Science Foundation of China(42171236)
National Natural Science Foundation of China(41901160)
Fundamental Research Funds for People's Public Security University of China(2024JKF04)
Fundamental Research Funds for People's Public Security University of China(2023JKF01ZK12)
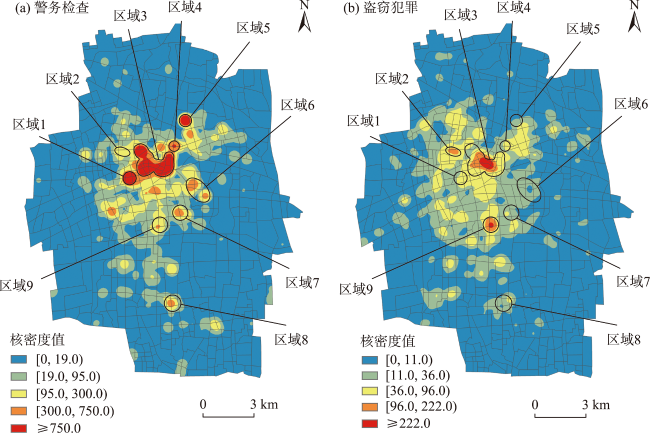
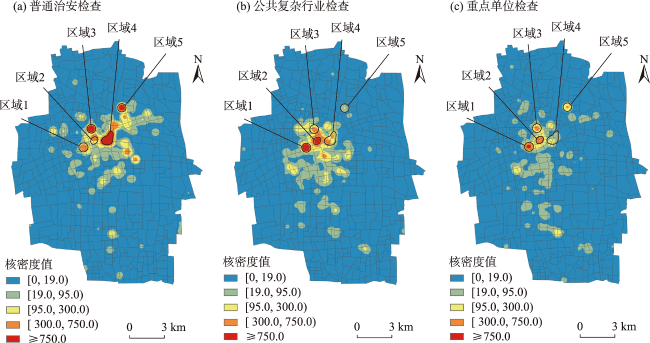
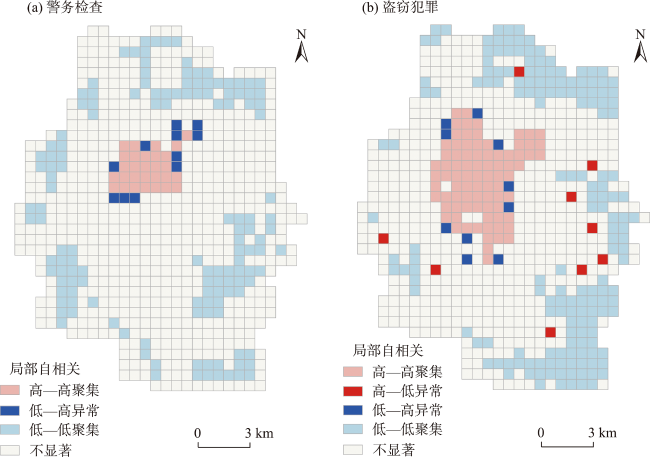
As the main actor in crime prevention and control, the activities of the police department have an important impact on the spatial trend of criminal activities. This study focused on the police inspection activity data and theft crime data from May to December 2019 in Haining City of Zhangjiang Province. Grids were employed as the spatial units of analysis, and the study used kernel density estimation and spatial autocorrelation analysis to examine the spatial distribution characteristics of police inspections and theft crimes. Additionally, a spatial regression model was constructed to analyze the impact of different types of police inspections, including routine security checks, inspections of public complex industries, and inspections of key units, on theft crimes. The findings are as follows: 1) Both police inspections and theft crimes exhibited spatial clustering characteristics, with some overlap in hotspot areas. While the spatial distributions of routine security checks, inspections of public complex industries, and inspections of key units were generally similar, there existed certain differences. 2) Inspections of public complex industries and key units were significantly negatively correlated with theft crimes, whereas routine security checks showed a significant positive correlation with theft crimes. 3) Routine security checks in adjacent areas were significantly positively correlated with theft crimes in the local area, suggesting a potential phenomenon of crime site displacement. These results suggest that inspections of public complex industries and key units played a significant inhibitory role in theft crimes, while routine security checks may lead to crime site displacement. The conclusions of this study provide significant reference value for clarifying the relationship between police activities and crime, as well as for assessing the effectiveness of police activities in crime prevention and control.
ZHAO Zengze , LIU Daqian , ZHENG Ziwan , CHEN Peng , WANG Cheng . Spatial influence of police inspection activities on theft crimes: A case study in Haining City, Zhejiang[J]. PROGRESS IN GEOGRAPHY, 2024 , 43(11) : 2298 -2311 . DOI: 10.18306/dlkxjz.2024.11.015
表1 警务检查分类Tab.1 Classification of police inspections |
| 一级分类 | 二级分类 | 检查定义 |
|---|---|---|
| 普通治安检查 | 社区治安检查 产业园区治安检查 物流仓库治安检查 其他普通治安检查 | 普通治安检查是治安管理主体为了掌握治安管理相对人遵守治安管理法律规范的情况,防范、发现违法犯罪嫌疑和安全隐患,依法对场所、人员、物品、证件等进行了解、观察、审查、核实所采取的措施 |
| 公共复杂行业检查 | 网吧检查 旅馆检查 商场检查 酒吧KTV检查 其他公共复杂行业检查 | 公共复杂行业检查是指公安机关对公共复杂场所进行的安全检查。公共复杂场所是指公众从事文娱、体育、交易等活动,人财物高度集中、流动频繁、情况复杂、易被不法分子利用进行各类违法犯罪活动的公共场所。公共复杂场所直接影响社会治安秩序和公共安全,由公安机关依法实施特别管理 |
| 重点单位检查 | 教育单位检查 医疗单位检查 涉危单位检查 其他重点单位检查 | 重点单位检查是指公安机关对治安保卫重点单位进行的安全检查。治安保卫重点单位是指关系全国或者所在地区国计民生、国家安全和公共安全的单位。治安保卫重点单位由县级以上地方各级人民政府公安机关按照规定范围提出,报本级人民政府确定 |
表2 POI分类示例Tab.2 Classification of points of interest |
| 类型 | POI示例 |
|---|---|
| 政府机构 | 各级政府、事业单位、行政单位等 |
| 公共交通 | 火车站、汽车站、公交车站、地铁站等 |
| 酒店住宿 | 星级酒店、经济型连锁酒店、旅馆招待所等 |
| 购物商超 | 购物中心、百货商场、超市、批发市场等 |
| 生活服务 | 仓库物流、加油站、通信营业厅等 |
| 小区住宅 | 别墅区、住宅社区等 |
| 医疗服务 | 综合医院、专科医院、诊所、药店等 |
| 学校文教 | 高等院校、中学、小学、幼儿园等 |
| 银行金融 | 银行、ATM机、信用社等 |
| 公司企业 | 公司、产业园区、商务写字楼等 |
表3 盗窃犯罪及其影响因素变量的描述性统计Tab.3 Descriptive statistics of theft crime and its influencing factors |
| 变量类型 | 变量 | 均值 | 标准差 | 最小值 | 最大值 |
|---|---|---|---|---|---|
| 被解释变量 | 盗窃犯罪/起 | 3.77 | 8.29 | 0 | 119 |
| 警务检查变量 | 普通治安检查/起 | 7.16 | 37.07 | 0 | 499 |
| 公共复杂行业检查/起 | 5.09 | 23.92 | 0 | 377 | |
| 重点单位检查/起 | 3.13 | 13.53 | 0 | 181 | |
| 社会环境变量 | 常住人口/人 | 323.10 | 620.20 | 0 | 5269 |
| 青少年人口比重/% | 6.28 | 3.98 | 0 | 24.95 | |
| 建成环境变量 | 道路网络密度/(km/km2) | 13.15 | 10.13 | 0 | 47.94 |
| 生活服务/个 | 4.09 | 12.79 | 0 | 145 | |
| 政府机构/个 | 1.10 | 3.75 | 0 | 51 | |
| 医疗服务/个 | 0.88 | 3.21 | 0 | 39 | |
| 酒店住宿/个 | 0.27 | 1.55 | 0 | 30 | |
| 小区住宅/个 | 0.84 | 1.91 | 0 | 16 | |
| 学校文教/个 | 1.02 | 3.42 | 0 | 50 | |
| 公共交通/个 | 0.60 | 1.01 | 0 | 8 | |
| 购物商超/个 | 12.02 | 39.11 | 0 | 416 | |
| 公司企业/个 | 5.51 | 12.74 | 0 | 127 | |
| 银行金融/个 | 0.48 | 2.25 | 0 | 41 |
表4 盗窃犯罪影响因素空间杜宾误差模型(SDEM)系数及其显著性Tab.4 SDEM coefficients of the influencing factors of theft crime and their significance |
| 变量 | 模型一 | 模型二 | 模型三 | 模型四 | 模型五 |
|---|---|---|---|---|---|
| 普通治安检查 | 0.047* | 0.006 | |||
| (0.028) | (0.025) | ||||
| 公共复杂行业检查 | -0.009 | -0.073** | |||
| (0.053) | (0.031) | ||||
| 重点单位检查 | -0.090* | -0.072*** | |||
| (0.050) | (0.027) | ||||
| 常住人口数量 | -0.076* | -0.079* | -0.077* | -0.065 | -0.078* |
| (0.045) | (0.045) | (0.045) | (0.045) | (0.045) | |
| 青少年人口比例 | 0.051** | 0.049** | 0.051** | 0.047** | 0.048** |
| (0.022) | (0.022) | (0.022) | (0.022) | (0.022) | |
| 道路网络密度 | 0.020 | 0.019 | 0.020 | 0.021 | 0.020 |
| (0.022) | (0.022) | (0.022) | (0.022) | (0.022) | |
| 生活服务 | 0.611*** | 0.642*** | 0.609*** | 0.647*** | 0.644*** |
| (0.055) | (0.057) | (0.056) | (0.057) | (0.057) | |
| 政府机构 | -0.133*** | -0.120*** | -0.134*** | -0.120*** | -0.120*** |
| (0.027) | (0.028) | (0.027) | (0.028) | (0.028) | |
| 医疗服务 | -0.210*** | -0.223*** | -0.212*** | -0.207*** | -0.209*** |
| (0.049) | (0.049) | (0.049) | (0.049) | (0.049) | |
| 酒店住宿 | 0.159*** | 0.164*** | 0.160*** | 0.165*** | 0.158*** |
| (0.033) | (0.033) | (0.033) | (0.033) | (0.033) | |
| 小区住宅 | 0.059* | 0.051 | 0.060 | 0.054 | 0.051 |
| (0.033) | (0.033) | (0.033) | (0.033) | (0.033) | |
| 学校文教 | 0.083** | 0.084** | 0.085** | 0.068* | 0.075** |
| (0.037) | (0.039) | (0.038) | (0.038) | (0.037) | |
| 公共交通 | 0.025 | 0.035 | 0.024 | 0.032 | 0.035 |
| (0.029) | (0.029) | (0.029) | (0.029) | (0.029) | |
| 购物商超 | 0.095*** | 0.089*** | 0.095*** | 0.093*** | 0.093*** |
| (0.032) | (0.032) | (0.032) | (0.032) | (0.032) | |
| 公司企业 | -0.001 | -0.014 | -0.010 | -0.011 | -0.010 |
| (0.0262) | (0.026) | (0.026) | (0.026) | (0.026) | |
| 银行金融 | 0.179*** | 0.188*** | 0.180*** | 0.184*** | 0.183*** |
| (0.025) | (0.025) | (0.025) | (0.025) | (0.025) | |
| 常数项 | -0.008 | -0.008 | -0.008 | -0.008 | -0.009 |
| (0.026) | (0.026) | (0.026) | (0.025) | (0.026) | |
| W_普通治安检查 | 0.052*** | 0.046*** | 0.052*** | 0.051*** | 0.049*** |
| (0.008) | (0.008) | (0.008) | (0.008) | (0.008) | |
| W_公共复杂行业检查 | 0.004 | 0.006 | 0.004 | 0.004 | 0.010 |
| (0.016) | (0.017) | (0.016) | (0.016) | (0.016) | |
| W_重点单位检查 | -0.023 | -0.016 | -0.022 | -0.021 | -0.023 |
| (0.017) | (0.018) | (0.017) | (0.017) | (0.017) | |
| W_误差项 | 0.032*** | 0.032*** | 0.032*** | 0.030*** | 0.032*** |
| (0.010) | (0.010) | (0.010) | (0.010) | (0.010) | |
| AIC | 1069.901 | 1065.971 | 1071.833 | 1066.431 | 1064.900 |
| Log likelihood | -515.951 | -510.985 | -515.917 | -513.216 | -512.450 |
| R2 | 0.732 | 0.735 | 0.732 | 0.734 | 0.734 |
| N | 687 | 687 | 687 | 687 | 687 |
注:*、**、***分别表示P<0.1、P<0.05、P<0.01;括号内为标准误差。 |
| [1] |
|
| [2] |
柳林, 吴雨菡, 宋广文, 等. 犯罪防控警务策略及其时空效益评估研究进展[J]. 地球信息科学学报, 2021, 23(1): 29-42.
[
|
| [3] |
|
| [4] |
|
| [5] |
|
| [6] |
|
| [7] |
|
| [8] |
|
| [9] |
|
| [10] |
|
| [11] |
|
| [12] |
|
| [13] |
|
| [14] |
|
| [15] |
柳林, 吴林琳, 宋广文, 等. 基于时空行为视角的犯罪地理创新研究框架[J]. 地理研究, 2022, 41(6): 1748-1764.
[
|
| [16] |
杨学锋. 热点警务的犯罪学理论基础及实践评估[J]. 中国人民公安大学学报 (社会科学版), 2018, 34(3): 33-39.
[
|
| [17] |
郑滋椀, 林喆, 姜超, 等. 浙江海宁市强奸与猥亵两类性犯罪的时空分异及其影响因素对比[J]. 地理科学, 2023, 43(12): 2208-2216.
[
|
| [18] |
徐冲, 柳林, 周素红, 等. 微观空间因素对街头抢劫影响的空间异质性: 以DP半岛为例[J]. 地理研究, 2017, 36(12): 2492-2504.
[
|
| [19] |
柳林, 孙秋远, 肖露子, 等. 涉毒人员日常活动对盗窃警情空间格局影响的时间差异[J]. 地球信息科学学报, 2021, 23(12): 2187-2200.
[
|
| [20] |
石飞. 城市道路等级级配及布局方法研究[D]. 南京: 东南大学, 2006.
[
|
| [21] |
张新宇, 陈鹏. 新冠疫情防控措施对入室盗窃犯罪热点的影响: 基于北京市主城区的案例研究[J]. 地理科学进展, 2023, 42(2): 328-340.
[
|
| [22] |
郑滋椀, 姜超, 汪婕, 等. 常态化防疫背景下城市盗窃犯罪的时空演变及其机理研究: 以浙江海宁市为例[J]. 地理科学进展, 2023, 42(2): 341-352.
[
|
| [23] |
|
| [24] |
|
| [25] |
|
| [26] |
|
| [27] |
|
| [28] |
刘大千, 王丹, 许骏, 等. 长白山地区乡村聚落空间格局及影响因素[J]. 水土保持研究, 2024, 31(3): 383-390, 400.
[
|
| [29] |
陶长琪, 杨海文. 空间计量模型选择及其模拟分析[J]. 统计研究, 2014, 31(8): 88-96.
[
|
| [30] |
姜磊. 空间回归模型选择的反思[J]. 统计与信息论坛, 2016, 31(10): 10-16.
[
|
| [31] |
张延吉, 庄宇丹, 邓伟涛, 等. 盗窃犯罪易发地的构成、影响及其区域异质性: 基于地理探测器方法[J]. 地理研究, 2022, 41(11): 2884-2896.
[
|
| [32] |
龙冬平, 柳林, 冯嘉欣, 等. 社区环境对入室盗窃和室外盗窃影响的对比分析: 以ZG市ZH半岛为例[J]. 地理学报, 2017, 72(2): 341-355.
[
|
| [33] |
张春霞, 周素红, 柳林, 等. 建成环境对星级酒店内被盗的影响: 以ZG市中心城区为例[J]. 地理科学进展, 2020, 39(5): 829-840.
[
|
| [34] |
柳林, 陈德宝, 徐冲, 等. 入室盗窃临近重复案件与孤立案件分布的影响因素对比研究[J]. 地理科学, 2021, 41(9): 1625-1633.
[
|
| [35] |
宋广文, 肖露子, 周素红, 等. 居民日常活动对扒窃警情时空格局的影响[J]. 地理学报, 2017, 72(2): 356-367.
[
|
| [36] |
|
| [37] |
|
| [38] |
|
| [39] |
|
| [40] |
|
| [41] |
|
| [42] |
|
| [43] |
|
| [44] |
|
/
| 〈 |
|
〉 |