
A CHELSA-based analysis of climate change characteristics and trends in South and Southeast Asia (SSEA) during 1980-2018
Received date: 2022-10-28
Revised date: 2023-05-08
Online published: 2023-07-25
Supported by
National Natural Science Foundation of China(41971242)
Youth Innovation Promotion Association of Chinese Academy of Sciences(CAS2020055)
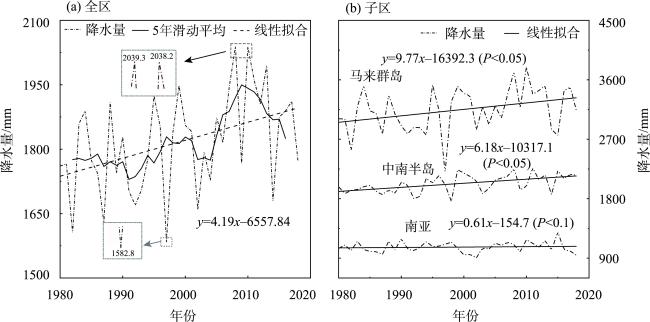
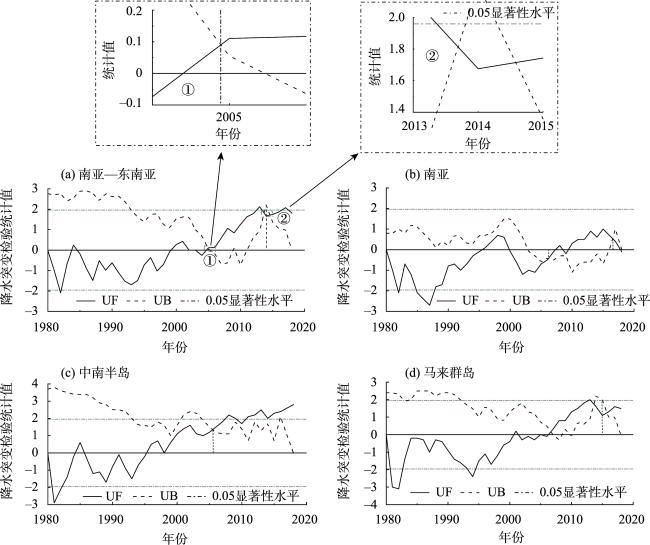
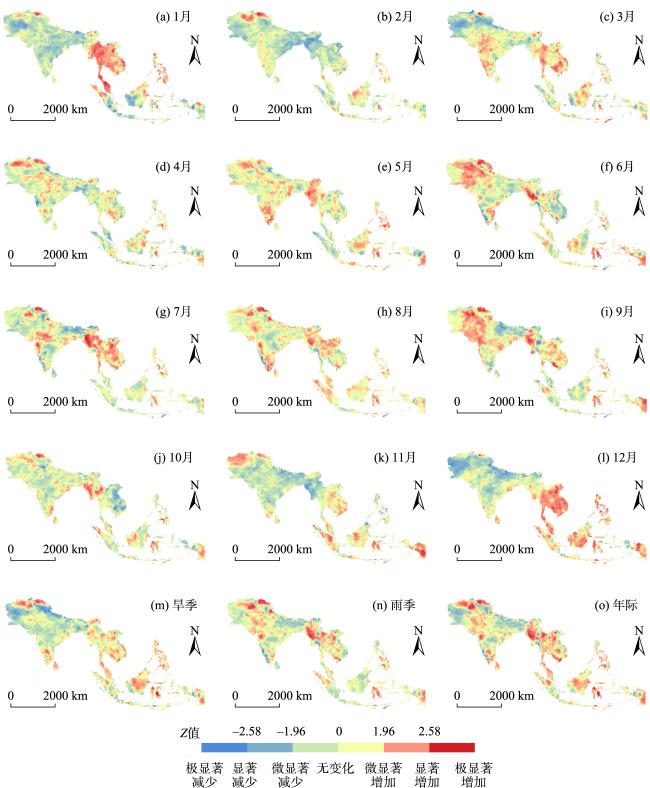
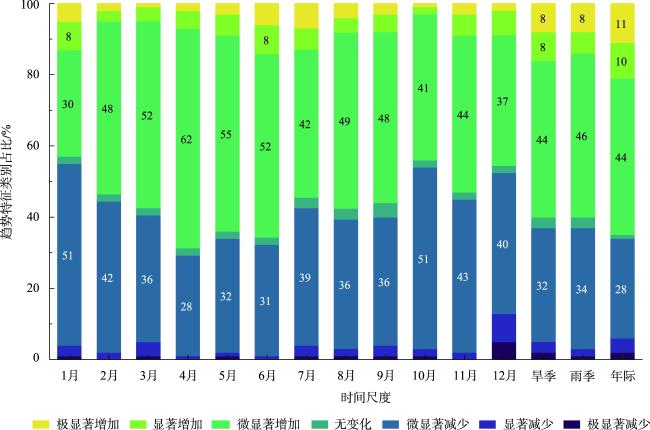
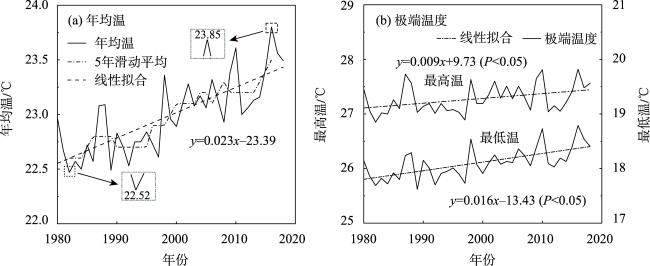
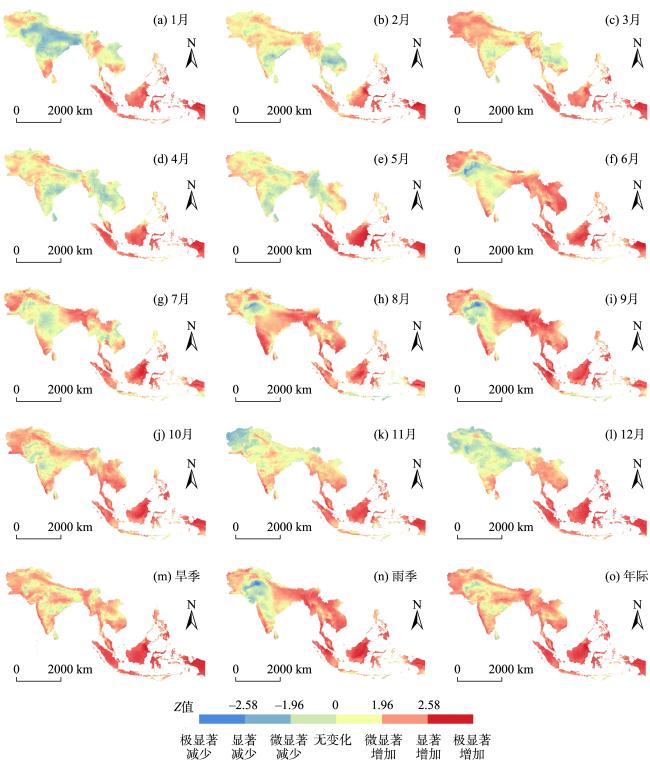
The combinations of regional climate factors and climate risk types caused by temperature rise in the backdrop of global warming are complex and diverse. South and Southeast Asia (SSEA) have attracted great attention due to their tropical monsoon climate and related unique characteristics. Exploring the patterns of change in temperature and precipitation in SSEA is of great significance for evaluating their effects on regional human activities and disaster risk such as the occurrence and development of active fires. Based on the 1980-2018 global climate element dataset (Climatologies at High Resolution for the Earth Land Surface Areas (CHELSA) V2.1, 30″×30″), and using statistical methods such as linear fitting and Mann-Kendall test, the spatiotemporal characteristics and evolution trends of temperature and precipitation in SSEA were examined from the aspects of overall trend of change and regional difference characteristics. The main conclusions are that: First, precipitation in SSEA has increased significantly in the past nearly four decades. A mutation of the trend of precipitation was detected in 2005. Second, nearly 2/3 of the SSEA region experienced an increasing trend of precipitation. Although rainfall change intensities in South Asia and Southeast Asia were similar in the rainy season, the amplitude in Southeast Asia was greater in the dry season. Third, SSEA has shown a significant warming trend in the last 40 years, and difference in monthly temperature rise was slight. Fourth, the regions with an increasing trend in temperature accounted for nearly 99.13% of SSEA, and the temperature change in Southeast Asia was more significant than that in South Asia during the rainy season. However, temperature rise in South Asia was more significant in the dry season, while it was the opposite in Southeast Asia. Finally, SSEA showed a notable trend of warming-wetting climate since the 1980s, which was featured by greater significance and intensity of temperature and precipitation changes in Southeast Asia.
JIN Xianghao , LI Peng , LI Xia , ZHANG Guozhuang . A CHELSA-based analysis of climate change characteristics and trends in South and Southeast Asia (SSEA) during 1980-2018[J]. PROGRESS IN GEOGRAPHY, 2023 , 42(7) : 1365 -1379 . DOI: 10.18306/dlkxjz.2023.07.011
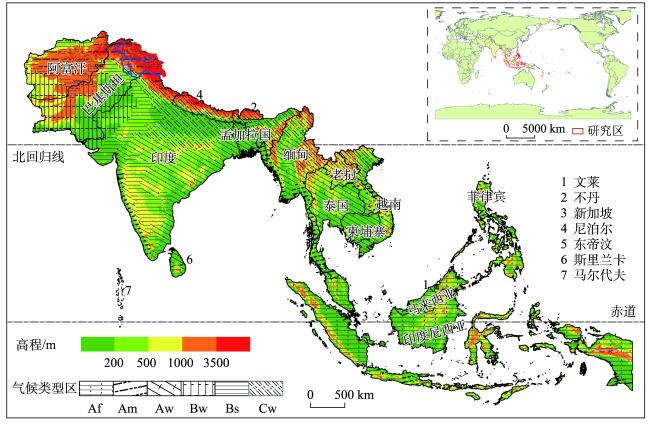
图1 南亚—东南亚地理位置与主要地形、气候分布注:本图中的世界地图基于自然资源部标准地图服务网站下载的审图号为GS(2016)1666号的标准地图制作,底图无修改。Af:热带雨林气候;Am:热带季风气候;Aw:热带疏林气候;Bs:草原气候;Bw:沙漠气候;Cw:冬干温暖气候。 Fig.1 Topography and climate zones of South and Southeast Asia (SSEA, 19 countries) |
表1 南亚、中南半岛与马来群岛主要特征Tab.1 Main characteristics of South Asia, Mainland Southeast Asia and Malay Archipelago |
| 要素 | 要素分级/分类 | 占比/% | |||
|---|---|---|---|---|---|
| 南亚 | 中南半岛 | 马来群岛 | 总计 | ||
| 高程 | Ⅰ级(≤200 m) | 17.97 | 8.76 | 14.45 | 100 |
| Ⅱ级(>200~500 m) | 14.34 | 4.44 | 4.67 | ||
| Ⅲ级(>500~1000 m) | 9.97 | 4.21 | 3.49 | ||
| Ⅳ级(>1000~3500 m) | 9.58 | 2.53 | 2.22 | ||
| Ⅴ级(>3500 m) | 3.30 | 0.03 | 0.04 | ||
| 面积 | — | 52.77 | 20.11 | 27.12 | 100 |
| 人口 | — | 73.41 | 9.68 | 16.91 | 100 |
| 气候类型 | Af(热带雨林气候) | 0.20 | 0.21 | 20.82 | 100 |
| Am(热带季风气候) | 2.05 | 3.50 | 2.24 | ||
| Aw(热带疏林气候) | 11.94 | 10.16 | 1.33 | ||
| Bs(草原气候) | 11.69 | 0.29 | 0 | ||
| Bw(沙漠气候) | 12.13 | 0 | 0 | ||
| Cw(冬干温暖气候) | 9.27 | 5.90 | 1.67 | ||
| 其他 | 5.49 | 0.05 | 1.06 | ||
表2 基于海洋Niño指数的近40年拉尼娜、厄尔尼诺年份划分Tab.2 Occurrence years of La Niña and El Niño in the last 40 years based on ocean Niño index |
| 类别 | 出现时段 |
|---|---|
| 拉尼娜年 | 1983—1984、1984—1985、1988—1989、1995—1996、1998—2001、2005—2006、2007—2008、2008—2009、 2010—2012、2016、2017—2018年 |
| 厄尔尼诺年 | 1982—1983、1986—1988、1991—1992、1994—1995、1997—1998、2002—2003、2004—2005、2006—2007、 2009—2010、2014—2016年 |
表3 Mann-Kendall 检验趋势特征类别划分Tab.3 Classification of trend characteristics based on the Mann-Kendall test |
| Z值 | 趋势特征 | Z值 | 趋势特征 |
|---|---|---|---|
| 0< Z ≤ 1.96 | 微显著增加 | -1.96 ≤ Z < 0 | 微显著减少 |
| 1.96< Z ≤ 2.58 | 显著增加 | -2.58 ≤ Z <-1.96 | 显著减少 |
| 2.58 < Z | 极显著增加 | Z < -2.58 | 极显著减少 |
注:Z = 0时,无明显变化趋势。 |
表4 南亚—东南亚月际温度与降水量变化及其对多年气候变化贡献率Tab.4 Monthly contribution rates to annual change in temperature and precipitation in South and Southeast Asia |
| 月份 | 温度 | 降水量 | |||||
|---|---|---|---|---|---|---|---|
| 温度变化/(℃/a) | 贡献率/% | 显著性水平 | 降水量变化/(mm/a) | 贡献率/% | 显著性水平 | ||
| 1 | 0.016 | 5.80 | 0.05 | 0.15 | 3.58 | 0.10 | |
| 2 | 0.028 | 10.15 | 0.05 | 0.41 | 9.78 | 0.05 | |
| 3 | 0.029 | 10.51 | 0.05 | 0.15 | 3.58 | 0.10 | |
| 4 | 0.022 | 7.97 | 0.05 | 0.39 | 9.31 | 0.05 | |
| 5 | 0.022 | 7.97 | 0.05 | 0.49 | 11.70 | 0.10 | |
| 6 | 0.019 | 6.88 | 0.05 | 0.72 | 17.18 | 0.10 | |
| 7 | 0.020 | 7.25 | 0.05 | 0.53 | 12.65 | 0.10 | |
| 8 | 0.019 | 6.88 | 0.05 | 0.22 | 5.25 | 0.10 | |
| 9 | 0.022 | 7.97 | 0.05 | 0.23 | 5.49 | 0.10 | |
| 10 | 0.029 | 10.51 | 0.05 | 0.06 | 1.43 | 0.10 | |
| 11 | 0.026 | 9.42 | 0.05 | 0.47 | 11.22 | 0.05 | |
| 12 | 0.024 | 8.69 | 0.05 | 0.37 | 8.83 | 0.05 | |
| [1] |
|
| [2] |
王晓欣, 姜大膀, 郎咸梅. CMIP5多模式预估的1.5 ℃升温背景下中国气温和降水变化[J]. 大气科学, 2019, 43(5): 1158-1170.
[
|
| [3] |
胡婷, 孙颖, 张学斌. 全球1.5和2 ℃温升时的气温和降水变化预估[J]. 科学通报, 2017, 62(26): 3098-3111.
[
|
| [4] |
周波涛, 徐影, 韩振宇, 等. “一带一路”区域未来气候变化预估[J]. 大气科学学报, 2020, 43(1): 255-264.
[
|
| [5] |
|
| [6] |
周天军, 陈梓明, 陈晓龙, 等. IPCC AR6 报告解读: 未来的全球气候: 基于情景的预估和近期信息[J]. 气候变化研究进展, 2021, 17(6): 652-663.
[
|
| [7] |
|
| [8] |
|
| [9] |
|
| [10] |
杨阳, 戴新刚, 汪萍. 未来30年亚洲降水情景预估及偏差订正[J]. 大气科学, 2022, 46(1): 40-54.
[
|
| [11] |
|
| [12] |
|
| [13] |
|
| [14] |
|
| [15] |
|
| [16] |
|
| [17] |
|
| [18] |
李鹏, 李文君, 封志明, 等. 基于FIRMS MODIS与VIIRS的东南亚活跃火频次时空动态分析[J]. 资源科学, 2019, 41(8): 1526-1540.
[
|
| [19] |
刘颖, 李鹏, 肖池伟, 等. 中南半岛旱季VIIRS活跃火的空间特征与国别差异[J]. 地理科学进展, 2021, 40(8): 1406-1418.
[
|
| [20] |
|
| [21] |
|
| [22] |
|
| [23] |
|
| [24] |
邹嘉龄, 刘卫东. 2001—2013 年中国与“一带一路”沿线国家贸易网络分析[J]. 地理科学, 2016, 36(11): 1629-1636.
[
|
| [25] |
刘佳, 梁一行, 李鹏, 等. 2001—2018年印度尼西亚MODIS活跃火的发生特征与响应[J]. 地理学报, 2020, 75(9): 1907-1920.
[
|
| [26] |
刘怡媛, 李鹏, 肖池伟, 等. 老挝VIIRS活跃火的主要自然地理要素特征[J]. 地理研究, 2020, 39(3): 749-760.
[
|
| [27] |
|
| [28] |
|
| [29] |
|
| [30] |
|
| [31] |
许武成, 王文, 马劲松, 等. 1951—2007年的ENSO事件及其特征值[J]. 自然灾害学报, 2009, 18(4): 18-24.
[
|
| [32] |
|
| [33] |
|
| [34] |
王会军, 任宏利, 陈活泼, 等. 中国气候预测研究与业务发展的回顾[J]. 气象学报, 2020, 78(3): 317-331.
[
|
| [35] |
|
| [36] |
闫军辉, 刘浩龙, 葛全胜, 等. 1906—2015年武汉市温度变化序列重建与初步分析[J]. 地理科学进展, 2017, 36(9): 1176-1183.
[
|
| [37] |
姚亭亭, 刘苏峡. 京津冀水资源利用多效率指标的变化特征比较[J]. 地理科学进展, 2021, 40(7): 1195-1207.
[
|
| [38] |
褚健婷, 夏军, 许崇育, 等. 海河流域气象和水文降水资料对比分析及时空变异[J]. 地理学报, 2009, 64(9): 1083-1092.
[
|
| [39] |
佘敦先, 夏军, 张永勇, 等. 近50年来淮河流域极端降水的时空变化及统计特征[J]. 地理学报, 2011, 66(9): 1200-1210.
[
|
| [40] |
宁忠瑞, 张建云, 王国庆. 1948—2016年全球主要气象要素演变特征[J]. 中国环境科学, 2021, 41(9): 4085-4095.
[
|
| [41] |
郭丽娜, 施能, 朱兴明, 等. 东南亚地区年际降水变化及其与ENSO的关系[J]. 南京气象学院学报, 2006, 29(1): 88-93.
[
|
| [42] |
李铭宇, 韩婷婷, 郝鑫. 欧亚大陆极端降水事件的区域变化特征[J]. 大气科学学报, 2020, 43(4): 687-698.
[
|
| [43] |
|
| [44] |
|
| [45] |
|
| [46] |
|
| [47] |
|
| [48] |
|
| [49] |
陈晓龙, 王平. 1979—2017年北极陆地气候变化趋势[J]. 资源科学, 2021, 43(6): 1260-1274.
[
|
| [50] |
李茂华, 都金康, 李皖彤, 等. 1982—2015年全球植被变化及其与温度和降水的关系[J]. 地理科学, 2020, 40(5): 823-832.
[
|
| [51] |
|
/
| 〈 |
|
〉 |

