
Compound flood risk of rainfall and storm surges during typhoon events
Received date: 2022-12-19
Revised date: 2023-02-20
Online published: 2023-06-26
Supported by
National Key Research and Development Program of China(2021YFC3001000)
The Fundamental Research Funds for the Central Universities(B2102022026)
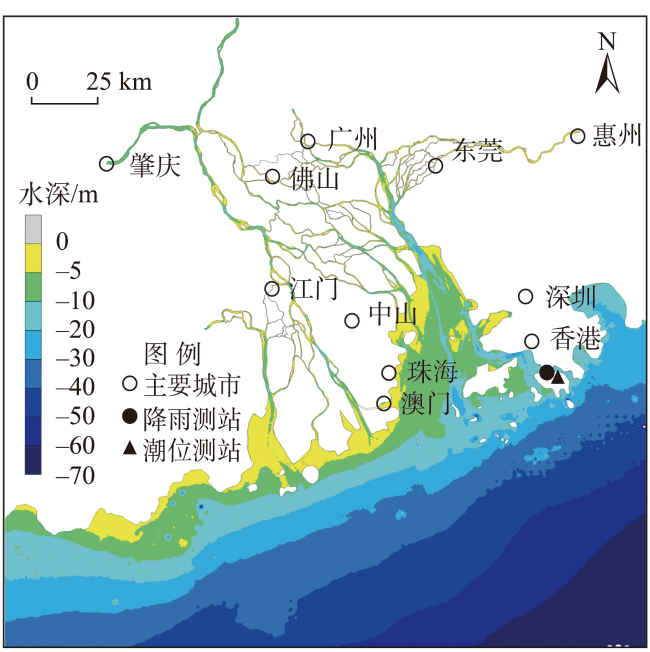
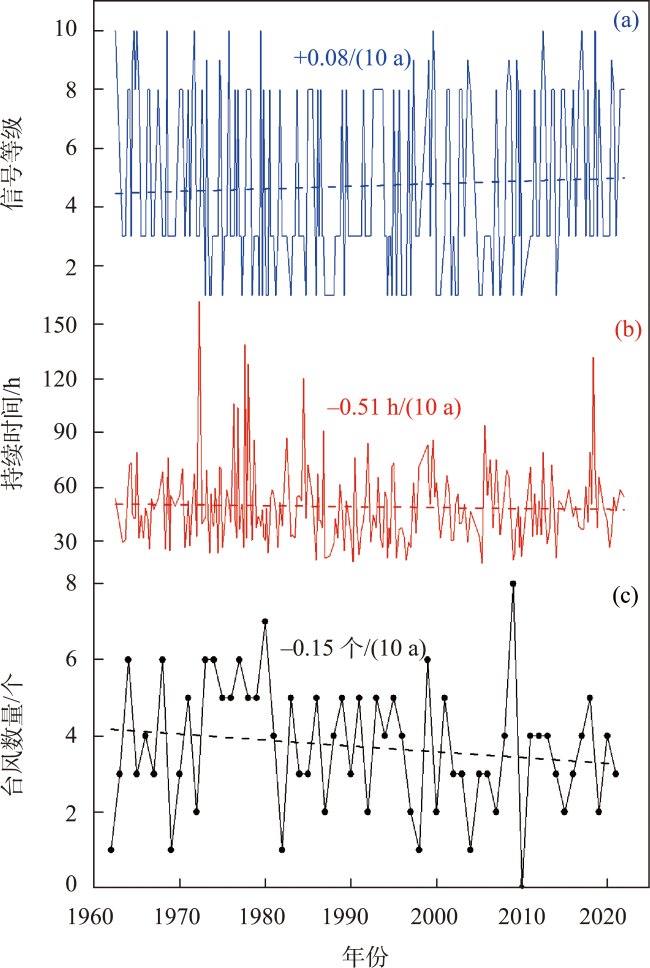
In the context of global climate change, compound flood disasters occur frequently in coastal areas, and thus it is of great significance to examine the related disaster risks. In this study, 223 typhoon events that affected Hong Kong from 1962 to 2021 were selected as statistical samples to analyze the compound disaster risk of rainfall and storm surges in Hong Kong under the influence of typhoons. The Mann-Kendall method was used to analyze the characteristics of typhoon events, and we found that the typhoons in Hong Kong during the past 60 years show the characteristics of low probability and high impact. The optimal marginal distribution function of the maximum storm water increase and cumulative rainfall under typhoon events was determined by a variety of statistical testing methods, and the Frank Copula function was used to fit the joint probability distribution of rainfall-storm surge compound disasters. Based on the risk assessment and design value calculation of single factors and compound disasters, the risk rate of the "or" return period is high, and the risk rate of the "and" return period is low. Finally, we concluded that the optimal design values of maximum storm surge and cumulative rainfall in the secondary return period should be selected for the design of coastal engineering projects in the Guangdong-Hong Kong-Macao Greater Bay area. This study showed the compound disaster risk characteristics of the Greater Bay area and provides a reference for the construction of relevant disaster scenarios.
QIAO Yu , JI Xiaomei , ZHANG Wei . Compound flood risk of rainfall and storm surges during typhoon events[J]. PROGRESS IN GEOGRAPHY, 2023 , 42(6) : 1153 -1161 . DOI: 10.18306/dlkxjz.2023.06.010
表1 研究数据信息Tab.1 Information on the data used in this research |
| 变量 | 频率 | 经度 /(°E) | 纬度 /(°N) | 数据来源 |
|---|---|---|---|---|
| 潮位 | 逐时 | 114.21 | 22.29 | uhslc.soest.hawaii.edu/network |
| 降雨 | 逐日 | 114.17 | 22.30 | www.hko.gov.hk/sc/cis/climat.htm |
| 台风 | www.hko.gov.hk/sc/cis/climat.htm |
表2 常用Archimedean Copula函数表达式及其参数范围Tab.2 Expressions and parameter ranges of the commonly used Archimedean Copula functions |
| Copula函数 | 分布函数 | 参数范围 |
|---|---|---|
| Gumbel | [1, ∞) | |
| Clayton | (0, ∞) | |
| Frank | R\{0} |
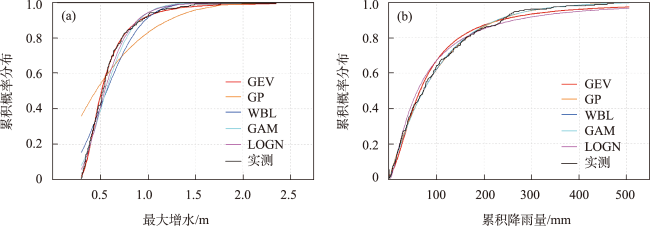
图5 最大增水和累积降雨量边缘分布函数Fig.5 Marginal distribution functions of maximum storm surge and cumulative rainfall |
表3 最大增水与累积降雨量拟合优度检验Tab.3 Goodness of fit test of maximum storm surge and cumulative rainfall |
| 分布函数 | 最大增水 | 累积降雨量 | |||||
|---|---|---|---|---|---|---|---|
| K-S | AIC | RMSE | K-S | AIC | RMSE | ||
| GEV | 0.061* | -4.883* | 0.021* | 0.057 | -4.107 | 0.031 | |
| GP | 0.359 | -0.705 | 0.169 | 0.028* | -6.046* | 0.011* | |
| WBL | 0.154 | -2.295 | 0.076 | 0.033 | -5.767 | 0.013 | |
| GAM | 0.104 | -3.088 | 0.051 | 0.036 | -5.680 | 0.014 | |
| LOGN | 0.073 | -3.914 | 0.034 | 0.079 | -3.885 | 0.034 | |
注:表中加*项为检验统计量的最小值。 |
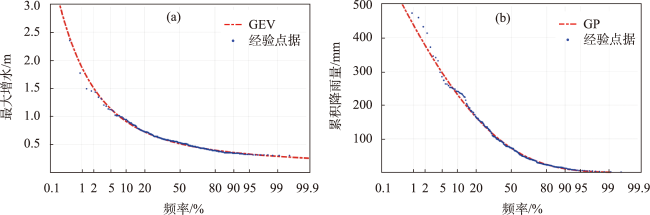
图6 最大增水和累积降雨量理论频率和经验频率Fig.6 Theoretical and empirical frequencies of maximum storm surge and cumulative rainfall |
表4 不同重现期下最大增水与累积降雨量边缘分布设计值Tab.4 Design values of marginal distribution of maximum storm surge and cumulative rainfall under different return periods |
| 重现期/a | 增水/m | 降雨量/mm |
|---|---|---|
| 100 | 1.87 | 436.13 |
| 50 | 1.51 | 376.82 |
| 20 | 1.14 | 295.15 |
| 10 | 0.91 | 230.79 |
| 5 | 0.72 | 164.13 |
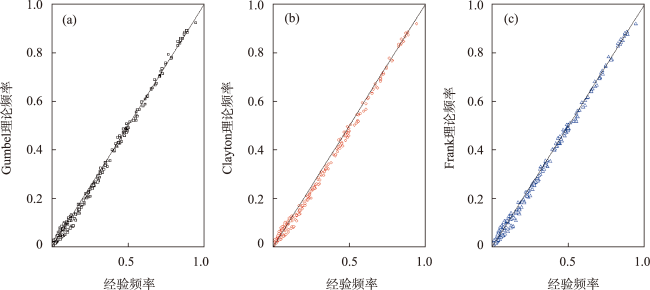
表5 Archimedean Copula函数参数及检验统计量Tab.5 Archimedean Copula function parameters and test statistics |
| Copula | θ | AIC | BIC | RMSE |
|---|---|---|---|---|
| Gumbel | 1.1440 | -7.0149 | -3.6077 | 0.0181 |
| Clayton | 0.1698 | -0.9640 | 2.4432 | 0.0229 |
| Frank | 1.3121 | -9.1802* | -5.7730* | 0.0169* |
注:表中加*项为检验统计量的最小值。 |
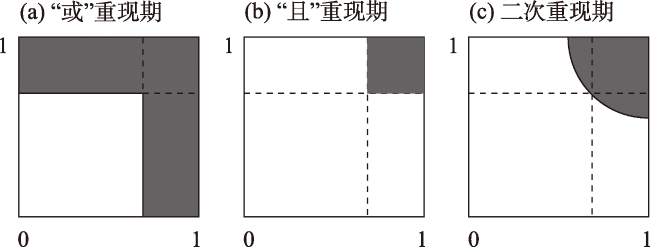
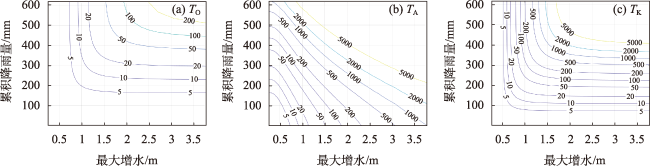
表6 不同情境下的雨潮复合灾害重现期Tab.6 Return periods of rainfall-storm surge compound flood under different scenarios |
| 重现期/a | “或”重现期 | “且”重现期 | 二次重现期 | |||||
|---|---|---|---|---|---|---|---|---|
| TO | P | TA | P | TK | P | |||
| 100 | 50.45 | 0.01982 | 5642.13 | 0.00017 | 2850.07 | 0.00035 | ||
| 50 | 25.44 | 0.03929 | 1428.61 | 0.00069 | 728.89 | 0.00137 | ||
| 20 | 10.44 | 0.09578 | 237.14 | 0.00422 | 124.49 | 0.00803 | ||
| 10 | 5.43 | 0.18406 | 62.75 | 0.01594 | 34.41 | 0.02906 | ||
| 5 | 2.92 | 0.34231 | 17.33 | 0.05769 | 10.25 | 0.09759 | ||
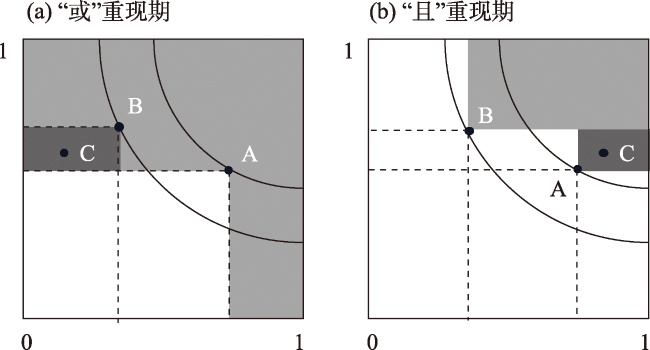
表7 不同重现期雨潮联合分布设计值Tab.7 Design values of rainfall-storm surge joint probability distribution under different return periods |
| 重现期/a | To | TA | TK | |||||
|---|---|---|---|---|---|---|---|---|
| 增水/m | 降雨/mm | 增水/m | 降雨/mm | 增水/m | 降雨/mm | |||
| 100 | 2.31 | 493.39 | 0.99 | 253.88 | 1.11 | 284.78 | ||
| 50 | 1.87 | 436.13 | 0.88 | 219.46 | 0.97 | 250.02 | ||
| 20 | 1.34 | 371.33 | 0.75 | 171.79 | 0.83 | 201.86 | ||
| 10 | 1.21 | 291.22 | 0.65 | 133.96 | 0.72 | 162.72 | ||
| 5 | 0.89 | 222.28 | 0.56 | 94.33 | 0.62 | 120.59 | ||
| [1] |
IPCC. AR6 climate change 2021: The physical science basis[M]. Cambridge, UK: Cambridge University Press, 2021.
|
| [2] |
|
| [3] |
|
| [4] |
|
| [5] |
|
| [6] |
|
| [7] |
冯爱青, 高江波, 吴绍洪, 等. 气候变化背景下中国风暴潮灾害风险及适应对策研究进展[J]. 地理科学进展, 2016, 35(11): 1411-1419.
[
|
| [8] |
|
| [9] |
|
| [10] |
|
| [11] |
|
| [12] |
许瀚卿, 谭金凯, 李梦雅, 等. 基于Copula函数的沿海城市雨潮复合灾害风险研究[J]. 自然灾害学报, 2022, 31(1): 40-48.
[
|
| [13] |
刘青, 王军, 许瀚卿, 等. 台风影响下沿海城市风雨复合灾害风险研究: 以海口市为例[J]. 灾害学, 2022, 37(4): 129-134.
[
|
| [14] |
陈浩, 徐宗学, 班春广, 等. 基于Copula函数的深圳河流域降雨潮位组合风险分析[J]. 北京师范大学学报(自然科学版), 2020, 56(2): 307-314.
[
|
| [15] |
徐宗学, 任梅芳, 陈浩. 我国沿海城市洪潮组合风险分析[J]. 水资源保护, 2021, 37(2): 10-14, 27.
[
|
| [16] |
陈子燊, 黄强, 刘曾美. 基于非对称Archimedean Copula的三变量洪水风险评估[J]. 水科学进展, 2016, 27(5): 763-771.
[
|
| [17] |
陈子燊, 路剑飞, 于吉涛. 基于非对称Archimedean Copula的三变量风浪重现水平分析[J]. 海洋通报, 2017, 36(6): 631-637.
[
|
| [18] |
|
| [19] |
|
| [20] |
|
| [21] |
罗志发, 黄本胜, 邱静, 等. 粤港澳大湾区风暴潮时空分布特征及影响因素[J]. 水资源保护, 2022, 38(3): 72-79, 153.
[
|
| [22] |
许瀚卿, 谭金凯, 李梦雅, 等. 中国沿海地区雨潮复合灾害联合分布及危险性研究[J]. 地理科学进展, 2022, 41(10): 1859-1867.
[
|
| [23] |
|
| [24] |
|
| [25] |
|
| [26] |
|
| [27] |
|
| [28] |
|
/
| 〈 |
|
〉 |