
Future global socioeconomic risk changes to rainstorms based on the different return periods of CMIP6
Received date: 2022-08-22
Revised date: 2022-11-26
Online published: 2023-03-27
Supported by
National Key Research and Development Program of China(2019YFA0606900)
National Natural Science Foundation of China(42077436)
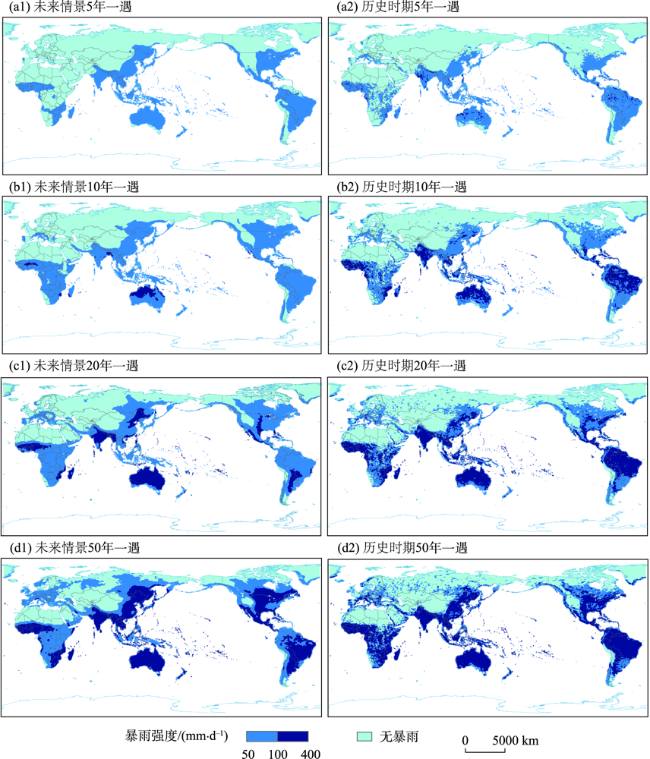
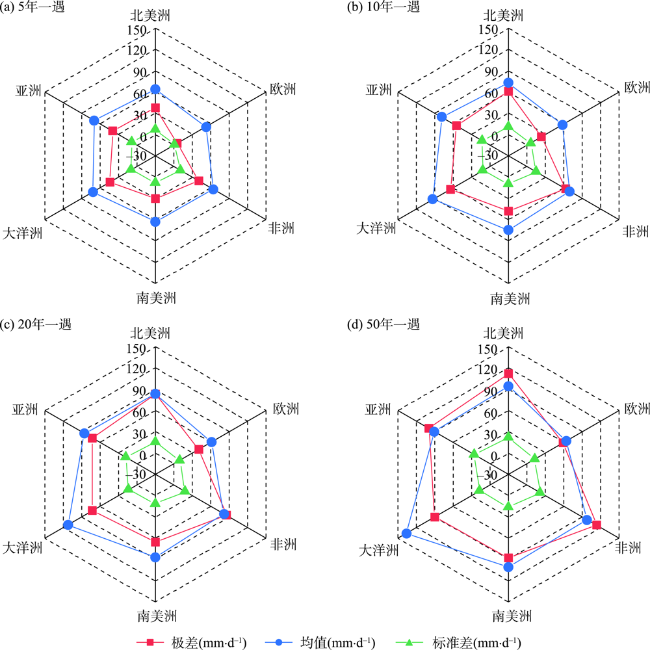
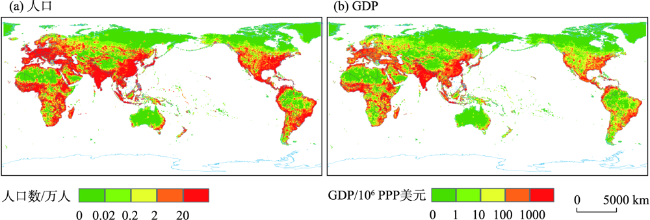
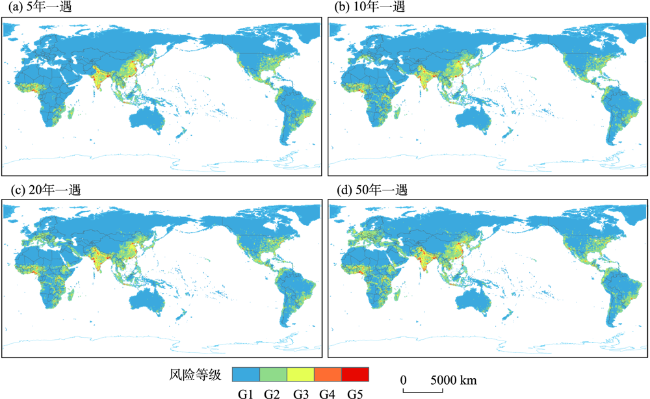
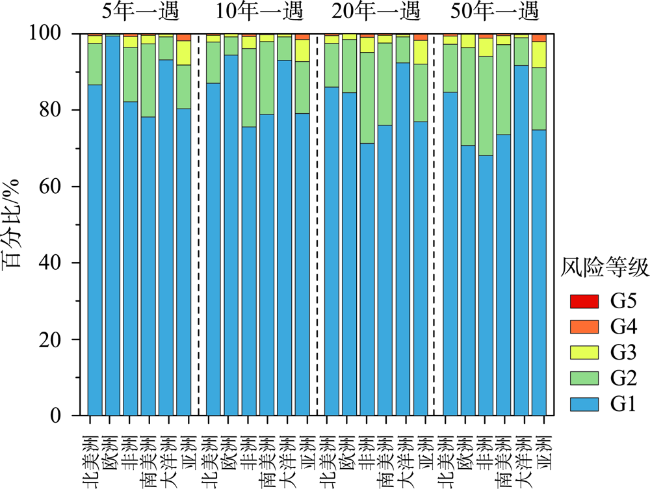
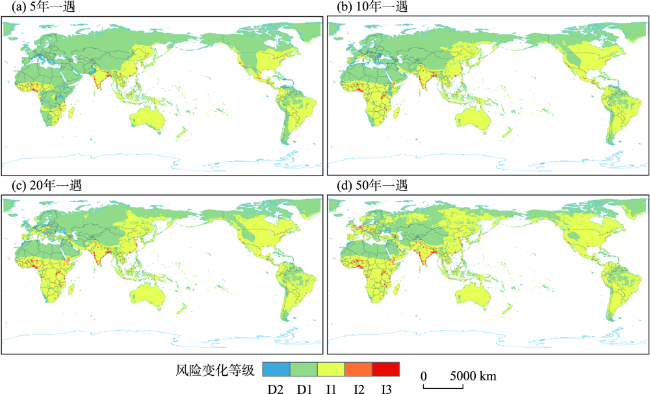
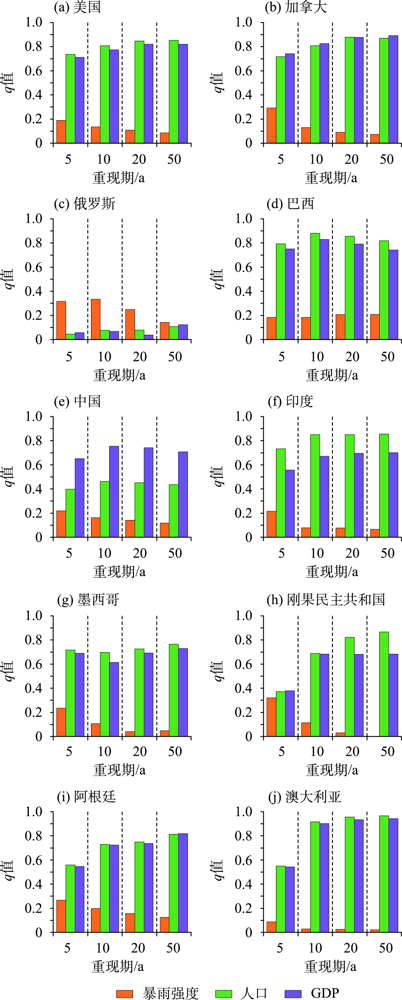
A reasonable assessment of the risk of extreme precipitation in the future and its changes relative to the past is conducive to the scientific formulation of risk prevention measures. Based on the future daily precipitation simulation data of 24 global climate models of the Shared Socioeconomic Pathways (SSP) 2-4.5 in the sixth phase of the Coupled Model Intercomparison Program (CMIP6), the reanalysis precipitation data of ERA5, and the prediction of population and gross domestic product (GDP), this study evaluated the socioeconomic risk of future global rainstorms at four return periods (5 years, 10 years, 20 years, 50 years) and their changes relative to historical periods. The main conclusions are as follows: 1) Under the future scenarios, the rainstorm intensity in Oceania is the highest and that in Europe is the lowest. With the increase of the return period, the areas where rainstorms occur continue to expand, and the intensity of rainstorms is also projected to increase. 2) At different return periods, the rainstorm risk in Europe and Oceania are the lowest, and that in Asia and Africa are the highest. 3) The regions with the most obvious increase of rainstorm risk in the future are concentrated in the southern and eastern coastal areas of Asia, the central, northern, and southeastern areas of Africa, and the eastern, western, and southern coastal areas of North America. The regions with the most obvious risk reduction are mainly distributed in central and southern Europe, northwestern and eastern Africa, and northern South America. With the increase of the return period, the proportion of the grids with increased risk is projected to increase. 4) The factors that are most related to risk changes at the four return periods differ in the 10 countries with significant changes in risk. The risk change of Russia has the greatest correlation with the change of rainstorm intensity. The risk changes of the United States, Brazil, India, Mexico, the Democratic Republic of the Congo, Argentina, and Australia have the greatest correlation with the change of population. The risk changes of Canada and China have the greatest correlation with the change of GDP. The study can provide a certain theoretical support for disaster prevention and mitigation in areas affected by extreme precipitation.
Key words: CMIP6; rainstorm; return period; socioeconomic risk; Geodetector
TANG Mingxiu , ZHU Xiufang , LIU Tingting , GUO Chunhua , ZHANG Shizhe , XU Kun . Future global socioeconomic risk changes to rainstorms based on the different return periods of CMIP6[J]. PROGRESS IN GEOGRAPHY, 2023 , 42(3) : 531 -542 . DOI: 10.18306/dlkxjz.2023.03.010
表1 研究所使用的CMIP6模型信息Tab.1 CMIP6 model information used in the study |
| 模型 | 国家 | 分辨率 (经纬向格点数) | 一年中 天数/d |
|---|---|---|---|
| ACCESS-CM2 | 澳大利亚 | 192×144 | 365/366 |
| ACCESS-ESM1-5 | 澳大利亚 | 192×145 | 365/366 |
| BCC-CSM2-MR | 中国 | 320×160 | 365 |
| CanESM5 | 加拿大 | 128×64 | 365 |
| CESM2-WACCM | 美国 | 288×192 | 365 |
| CMCC-CM2-SR5 | 意大利 | 288×192 | 365 |
| CMCC-ESM2 | 意大利 | 288×192 | 365 |
| EC-Earth3-Veg | 10个欧洲国家 | 512×256 | 365/366 |
| EC-Earth3-Veg-LR | 10个欧洲国家 | 320×160 | 365/366 |
| GFDL-ESM4 | 美国 | 288×180 | 365 |
| IITM-ESM | 印度 | 192×94 | 365/366 |
| INM-CM4-8 | 俄罗斯 | 180×120 | 365 |
| INM-CM5-0 | 俄罗斯 | 180×120 | 365 |
| IPSL-CM6A-LR | 法国 | 144×143 | 365/366 |
| KACE-1-0-G | 韩国 | 192×144 | 360 |
| KIOST-ESM | 韩国 | 192×96 | 365 |
| MIROC6 | 日本 | 256×128 | 365/366 |
| MPI-ESM1-2-HR | 德国 | 384×192 | 365/366 |
| MPI-ESM1-2-LR | 德国 | 192×96 | 365/366 |
| MRI-ESM2-0 | 日本 | 320×160 | 365/366 |
| NESM3 | 中国 | 192×96 | 365/366 |
| NorESM2-LM | 挪威 | 144×96 | 365 |
| NorESM2-MM | 挪威 | 288×192 | 365 |
| TaiESM1 | 中国 | 288×192 | 365 |
表2 4个重现期全球暴雨社会经济风险变化等级占比统计Tab.2 Statistics of the proportion of global rainstorm socio-economic risk change levels at four return periods (%) |
| 风险变化等级 | 5年一遇 | 10年一遇 | 20年一遇 | 50年一遇 |
|---|---|---|---|---|
| D2 | 1.44 | 1.23 | 0.90 | 0.52 |
| D1 | 66.85 | 55.64 | 49.90 | 41.62 |
| I1 | 30.69 | 41.83 | 47.65 | 55.89 |
| I2 | 0.93 | 1.19 | 1.41 | 1.78 |
| I3 | 0.09 | 0.11 | 0.14 | 0.19 |
| [1] |
姜大膀, 王晓欣. 对IPCC第六次评估报告中有关干旱变化的解读[J]. 大气科学学报, 2021, 44(5): 650-653.
[
|
| [2] |
苏布达, 孙赫敏, 李修仓, 等. 气候变化背景下中国陆地水循环时空演变[J]. 大气科学学报, 2020, 43(6): 1096-1105.
[
|
| [3] |
|
| [4] |
|
| [5] |
|
| [6] |
|
| [7] |
|
| [8] |
菅艺伟, 付瑾, 周丰. 极端降水对水稻产量的影响研究综述[J]. 地理科学进展, 2021, 40(10): 1746-1760.
[
|
| [9] |
王军, 谭金凯. 气候变化背景下中国沿海地区灾害风险研究与应对思考[J]. 地理科学进展, 2021, 40(5): 870-882.
[
|
| [10] |
|
| [11] |
|
| [12] |
方佳毅, 史培军. 全球气候变化背景下海岸洪水灾害风险评估研究进展与展望[J]. 地理科学进展, 2019, 38(5): 625-636.
[
|
| [13] |
|
| [14] |
|
| [15] |
|
| [16] |
|
| [17] |
|
| [18] |
|
| [19] |
|
| [20] |
井源源, 方建, 史培军. 未来气候变化情景下湖北省极端降水的人口暴露分析[J]. 北京师范大学学报(自然科学版), 2020, 56(5): 700-709.
[
|
| [21] |
|
| [22] |
|
| [23] |
|
| [24] |
|
| [25] |
宁思雨, 黄晶, 汪志强, 等. 基于投入产出法的洪涝灾害间接经济损失评估: 以湖北省为例[J]. 地理科学进展, 2020, 39(3): 420-432.
[
|
| [26] |
黄晓远, 李谢辉. 基于CMIP6的西南暴雨洪涝灾害风险未来预估[J]. 应用气象学报, 2022, 33(2): 231-243.
[
|
| [27] |
|
| [28] |
|
| [29] |
|
| [30] |
|
| [31] |
刘婷婷, 朱秀芳, 郭锐, 等. ERA5再分析降水数据在中国的适用性分析[J]. 干旱区地理, 2022, 45(1): 66-79.
[
|
| [32] |
|
| [33] |
|
| [34] |
|
| [35] |
唐明秀, 孙劭, 朱秀芳, 等. 基于CMIP6的中国未来暴雨危险性变化评估[J]. 地球科学进展, 2022, 37(5): 519-534.
[
|
| [36] |
|
| [37] |
王劲峰, 徐成东. 地理探测器: 原理与展望[J]. 地理学报, 2017, 72(1): 116-134.
[
|
| [38] |
胡畔, 陈波, 史培军. 中国暴雨洪涝灾情时空格局及影响因素[J]. 地理学报, 2021, 76(5): 1148-1162.
[
|
| [39] |
张若婧, 陈跃红, 张晓祥, 等. 基于参数最优地理探测器的江西省山洪灾害时空格局与驱动力研究[J]. 地理与地理信息科学, 2021, 37(4): 72-80.
[
|
| [40] |
|
| [41] |
|
| [42] |
|
/
| 〈 |
|
〉 |