
Detecting spatiotemporal variation of population in different types of regions in China based on the census data of 2000, 2010 and 2020
Received date: 2022-10-25
Revised date: 2023-01-10
Online published: 2023-03-27
Supported by
National Natural Science Foundation of China(41971220)
National Natural Science Foundation of China(41931293)
Young Top Talents Project of Hebei University Science and Technology Research Project(BJK2023081)
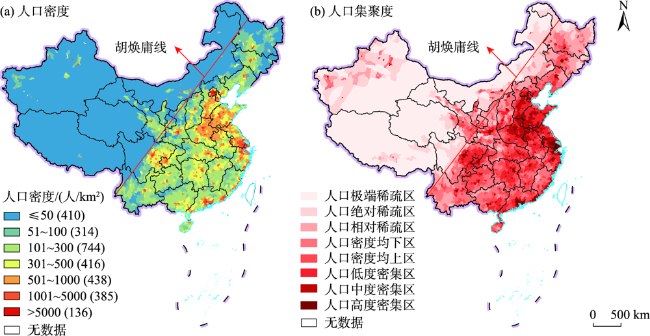
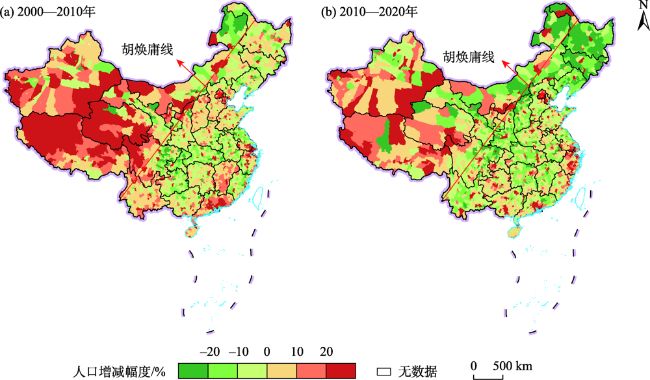
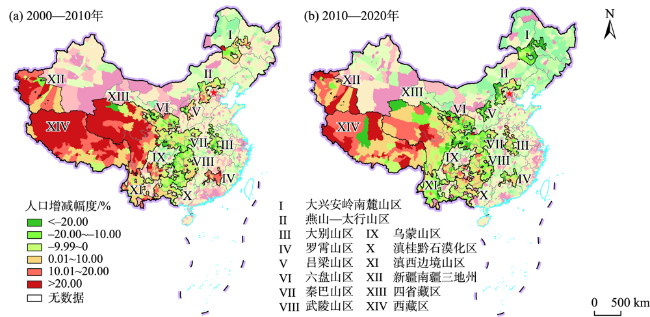
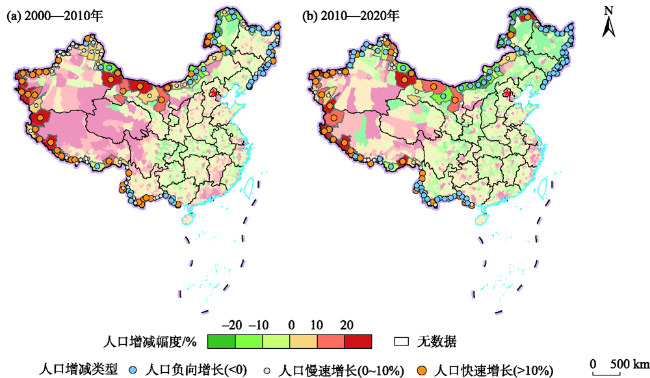
In the new era, research on China's population aggregation and decentralization in different types of regions is of great reference value for the implementation of strategies for the new-type urbanization and rural revitalization. Therefore, we studied the spatiotemporal variations of population in China and its different types of regions (for example, urban agglomerations, original contiguous destitute areas, and border areas) at the county level based on the data of three censuses from 2000 to 2020. The results show that: 1) The pattern of China's population distribution, which is dense in the east and sparse in the west, had not fundamentally changed, and the population ratio of the southeast side to the northwest side of the Hu line is still 94∶6. Furthermore, the Chinese population had entered a period of negative growth, and more than half of the counties had negative population growth from 2010 to 2020. 2) The urban agglomeration areas were the main areas carrying China's population, accounting for nearly 90% of China's total population in 2020. From 2010 to 2020, among the 19 urban agglomerations of China, the Pearl River Delta and the Yangtze River Delta had the most significant population growth, while the Harbin-Changchun and central-southern Liaoning urban agglomerations experienced negative population growth. 3) The population of original contiguous destitute areas dropped continuously from 2000 to 2020, and the total population decreased by more than 11 million during the 20 years. But the population growth of three prefectures of southern Xinjiang and the Tibet area inhabited by ethnic minorities exceeded 15% from 2010 to 2020. 4) The population of border areas had been basically stable, but the population agglomeration index and population density decreased slightly from 2000 to 2020. In particular, the population of the northeastern and northern border areas declined significantly, both with a decrease of 15% from 2010 to 2020. The implications of this study are that the government should attach greater importance to the actual status of population change for carrying out targeted policies—such as the new-type of urbanization, rural revitalization, and national defense and security—under the new situation.
YIN Xu , WEI Hui , LI Yurui , CHEN Yue . Detecting spatiotemporal variation of population in different types of regions in China based on the census data of 2000, 2010 and 2020[J]. PROGRESS IN GEOGRAPHY, 2023 , 42(3) : 452 -463 . DOI: 10.18306/dlkxjz.2023.03.004
表1 2000—2020年中国县级行政单元变动类型及处理过程Tab.1 Types of change of county administrative units in China from 2000 to 2020 and data processing |
| 类型 | 数量/个 | 处理方式 | 示例 |
|---|---|---|---|
| 仅行政代码发生变更 | 279 | 以2020年区县行政代码数据为基准,调整2000年和2010年的区县行政代码,将人口普查数据链接到2020年 | 如2019年,撤销莱芜市划归济南市,分别成立济南市莱芜区和钢城区,因此调整其原行政代码,并将其2000年和2010年的人口普查数据链接为当前行政区划 |
| 撤销合并 | 45 | 以2020年区县行政单元为基准,将2000年和2010年撤并的区县合并到2020年 | 如2010年,撤销北京市东城区、崇文区合并为新的东城区,撤销西城区、宣武区合并为新的西城区 |
| 拆分和辖区部分变动 | 92 | 由于七普的乡镇街道人口数据并未公布,因此参照2010年的乡镇街道人口比例,将行政边界发生变动的县级单元按照六普乡镇街道人口比例进行分配 | 如2018年,拆分山西省大同市南郊区,部分乡镇归属于云冈区,其余乡镇则归属于平城区 |
| 增设以及其他情况 | 28 | 主要为2010年之后新设立的县级单元,考虑缺少2000年和2010年人口数据,因此做了删除处理 | 如2010年之后新成立的北屯市、铁门关市、可克达拉市、双河市、胡杨河市、昆玉市和三沙市等 |
表2 基于分县尺度的人口集聚度分级标准Tab.2 Population agglomeration grading standards at the county-level |
| 人口集聚度分级 | 人口集聚度 | |
|---|---|---|
| 人口密集区 | 人口高度密集区 | JJD≥8 |
| 人口中度密集区 | 4≤JJD<8 | |
| 人口低度密集区 | 2≤JJD<4 | |
| 人口均值区 | 人口密度均上区 | 1≤JJD<2 |
| 人口密度均下区 | 0.5≤JJD<1 | |
| 人口稀疏地区 | 人口相对稀疏区 | 0.2≤JJD<0.5 |
| 人口绝对稀疏区 | 0.05≤JJD<0.2 | |
| 人口极端稀疏区 | JJD<0.05 | |
表3 2020年中国分县人口集聚度分区统计Tab.3 Population agglomeration zoning at the county-level in China in 2020 |
| 人口集聚度分区分类 | 县域行政单元数量/个 | 人口 | 土地 | 人口密度 | ||||||
|---|---|---|---|---|---|---|---|---|---|---|
| 总量/万人 | 比例/% | 面积/万km2 | 比例/% | 值域/(人/km2) | 均值/(人/km2) | |||||
| 人口密集地区 | 高度密集区 | 461 | 41784.12 | 29.65 | 14.49 | 1.51 | 1177~35571 | 2884 | ||
| 中度密集区 | 379 | 26155.97 | 18.56 | 33.66 | 3.51 | 588~1174 | 777 | |||
| 低度密集区 | 549 | 32548.76 | 23.10 | 78.91 | 8.24 | 294~588 | 412 | |||
| 小计 | 1389 | 100488.85 | 71.30 | 127.06 | 13.26 | 294~35571 | 791 | |||
| 人口均值地区 | 密度均上区 | 459 | 19967.36 | 14.17 | 95.57 | 9.97 | 147~294 | 209 | ||
| 密度均下区 | 445 | 12608.04 | 8.95 | 117.21 | 12.23 | 74~147 | 108 | |||
| 小计 | 904 | 32575.40 | 23.11 | 212.78 | 22.21 | 74~294 | 153 | |||
| 人口稀疏地区 | 相对稀疏区 | 251 | 4904.35 | 3.48 | 98.12 | 10.24 | 30~73 | 50 | ||
| 绝对稀疏区 | 155 | 2083.13 | 1.48 | 137.08 | 14.31 | 7~29 | 15 | |||
| 极端稀疏区 | 144 | 880.35 | 0.62 | 383.11 | 39.98 | 0.16~7 | 2 | |||
| 小计 | 550 | 7867.83 | 5.58 | 618.31 | 64.53 | 0.16~73 | 13 | |||
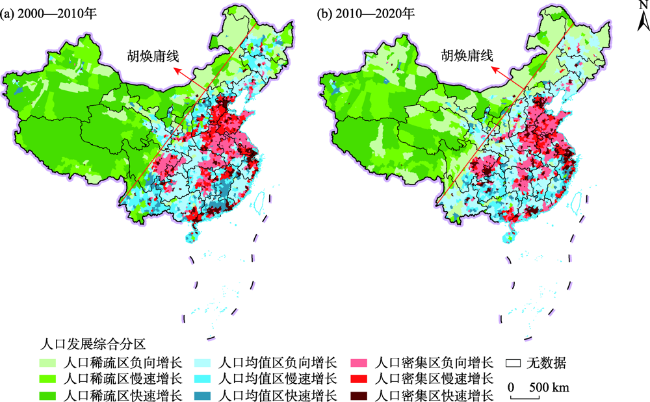
表4 2000—2020年中国分县人口集聚度分区统计Tab.4 Population agglomeration zoning of China during 2000-2020 |
| 人口集聚度分区 | 2000—2010年 | 2010—2020年 | |||
|---|---|---|---|---|---|
| 县域 数量/个 | 比例/% | 县域数量/个 | 比例/% | ||
| 人口密集区快速增长 | 558 | 19.63 | 514 | 18.08 | |
| 人口密集区慢速增长 | 404 | 14.21 | 271 | 9.53 | |
| 人口密集区负向增长 | 472 | 16.60 | 628 | 22.09 | |
| 人口均值区快速增长 | 175 | 6.16 | 122 | 4.29 | |
| 人口均值区慢速增长 | 328 | 11.54 | 202 | 7.11 | |
| 人口均值区负向增长 | 446 | 15.68 | 620 | 21.81 | |
| 人口稀疏区快速增长 | 183 | 6.44 | 102 | 3.59 | |
| 人口稀疏区慢速增长 | 137 | 4.82 | 105 | 3.69 | |
| 人口稀疏区负向增长 | 140 | 4.92 | 279 | 9.81 | |
表5 2000—2020年中国19个城市群人口整体情况统计Tab.5 Population statistics of urban agglomerations in China during 2000-2020 |
| 年份 | 人口总量/亿人 | 全国占比/% | 人口集聚度 | 人口密度/(人/km2) |
|---|---|---|---|---|
| 2000 | 10.78 | 86.65 | 7.73 | 229 |
| 2010 | 11.57 | 86.96 | 8.49 | 246 |
| 2020 | 12.31 | 87.39 | 9.25 | 262 |
表6 2000—2020年中国原连片特困地区人口增减统计Tab.6 Population change statistics of original contiguous destitute areas in China during 2000-2020 |
| 原连片特困地区名称 | 2000—2010年 | 2010—2020年 | |||
|---|---|---|---|---|---|
| 人口增减变化量/万人 | 人口增减变化率/% | 人口增减变化量/万人 | 人口增减变化率/% | ||
| 大兴安岭南麓山区 | 6.27 | 0.96 | -181.87 | -27.57 | |
| 燕山—太行山区 | 13.92 | 1.42 | -92.50 | -9.33 | |
| 大别山区 | -284.82 | -9.54 | -58.43 | -2.16 | |
| 罗霄山区 | 107.90 | 11.73 | -32.83 | -3.20 | |
| 吕梁山区 | -10.91 | -3.10 | -73.01 | -21.44 | |
| 六盘山区 | -41.60 | -2.18 | -140.71 | -7.52 | |
| 秦巴山区 | -171.60 | -5.47 | -250.49 | -8.45 | |
| 武陵山区 | -143.10 | -4.79 | -117.64 | -4.14 | |
| 乌蒙山区 | 85.76 | 4.66 | 6.53 | 0.34 | |
| 滇桂黔石漠化区 | -83.61 | -3.40 | 17.60 | 0.74 | |
| 滇西边境山区 | 71.61 | 4.96 | -103.98 | -6.87 | |
| 新疆南疆三地州 | 99.25 | 17.96 | 104.06 | 15.96 | |
| 四省藏区 | 66.38 | 13.99 | -2.67 | -0.49 | |
| 西藏区 | 38.93 | 14.85 | 63.73 | 21.17 | |
| 合计 | -245.62 | -1.17 | -862.22 | -4.16 | |
表7 2000—2020年中国边境地区人口增减统计Tab.7 Population change statistics of China's border areas during 2000-2020 |
| 边境地区 划分 | 省份 | 2000—2010年 | 2010—2020年 | |||
|---|---|---|---|---|---|---|
| 人口增减变化量/万人 | 人口增减变化率/% | 人口增减变化量/万人 | 人口增减变化率/% | |||
| 东北边境 | 辽宁 | 8.35 | 7.02 | -12.28 | -9.64 | |
| 吉林 | -8.07 | -3.68 | -51.99 | -24.62 | ||
| 黑龙江 | 6.40 | 2.05 | -34.48 | -10.82 | ||
| 北部边境 | 内蒙古 | 6.59 | 3.62 | -29.39 | -15.56 | |
| 西北边境 | 甘肃 | 0.19 | 14.82 | 0.01 | 0.76 | |
| 新疆 | 45.96 | 10.41 | 40.36 | 8.28 | ||
| 西南边境 | 西藏 | 3.42 | 11.44 | 4.30 | 12.88 | |
| 云南 | 41.71 | 6.68 | 9.86 | 1.48 | ||
| 广西 | 5.66 | 2.73 | 10.44 | 4.91 | ||
| 合计 | 110.21 | 5.16 | -63.17 | -2.81 | ||
| [1] |
国务院发展研究中心课题组. 认识人口基本演变规律, 促进我国人口长期均衡发展[J]. 管理世界, 2022, 38(1): 1-19, 34, 20.
[Research Group of the Development Research Center of the State Council. Understand the basic laws of population evolution and promote the longterm balanced development of China's population. Journal of Management World, 2022, 38(1): 1-19, 34, 20.]
|
| [2] |
尹旭, 王婧, 李裕瑞, 等. 中国乡镇人口分布时空变化及其影响因素[J]. 地理研究, 2022, 41(5): 1245-1261.
[
|
| [3] |
刘涛, 彭荣熙, 卓云霞, 等. 2000—2020年中国人口分布格局演变及影响因素[J]. 地理学报, 2022, 77(2): 381-394.
[
|
| [4] |
乔晓春. 从“七普”数据看中国人口发展、变化和现状[J]. 人口与发展, 2021, 27(4): 74-88.
[
|
| [5] |
翟振武, 刘雯莉. 七普数据质量与中国人口新“变化”[J]. 人口研究, 2021, 45(3): 46-56.
[
|
| [6] |
|
| [7] |
胡焕庸. 中国人口之分布: 附统计表与密度图[J]. 地理学报, 1935, 2(2): 33-74.
[
|
| [8] |
陆大道, 王铮, 封志明, 等. 关于“胡焕庸线能否突破”的学术争鸣[J]. 地理研究, 2016, 35(5): 805-824.
[
|
| [9] |
张波. 2000年代以来中国省际人才的时空变动分析[J]. 人口与经济, 2019(3): 91-101.
[
|
| [10] |
王婧, 李裕瑞. 中国县域城镇化发展格局及其影响因素: 基于2000和2010年全国人口普查分县数据[J]. 地理学报, 2016, 71(4): 621-636.
[
|
| [11] |
刘彦随, 杨忍, 林元城. 中国县域城镇化格局演化与优化路径[J]. 地理学报, 2022, 77(12): 2937-2953.
[
|
| [12] |
|
| [13] |
|
| [14] |
|
| [15] |
|
| [16] |
|
| [17] |
|
| [18] |
闫东升, 孙伟, 王玥, 等. 长江三角洲人口分布演变、偏移增长及影响因素[J]. 地理科学进展, 2020, 39(12): 2068-2082.
[
|
| [19] |
刘睿文, 封志明, 杨艳昭, 等. 基于人口集聚度的中国人口集疏格局[J]. 地理科学进展, 2010, 29(10): 1171-1177.
[
|
| [20] |
|
| [21] |
|
| [22] |
|
| [23] |
|
| [24] |
刘盛和, 王雪芹, 戚伟. 中国城镇人口“镇化”发展的时空分异[J]. 地理研究, 2019, 38(1): 85-101.
[
|
| [25] |
林李月, 朱宇, 柯文前. 区域协调发展背景下流动人口回流的空间意愿及其政策含义[J]. 地理研究, 2021, 40(5): 1515-1528.
[
|
| [26] |
吉宇琴, 姜会明. 新时代老龄化与养老资源适配度时空差异及其影响因素分析[J]. 地理科学, 2022, 42(5): 851-862.
[
|
| [27] |
|
| [28] |
王若宇, 黄旭, 薛德升, 等. 2005—2015年中国高校科研人才的时空变化及影响因素分析[J]. 地理科学, 2019, 39(8): 1199-1207.
[
|
| [29] |
方创琳. 新发展格局下的中国城市群与都市圈建设[J]. 经济地理, 2021, 41(4): 1-7.
[
|
| [30] |
张耀军, 王小玺. 城市群视角下中国人口空间分布研究[J]. 人口与经济, 2020(3): 1-13.
[
|
| [31] |
程艺, 刘慧, 宋涛, 等. 人文地理学视域下中国边境地区研究进展与展望[J]. 地理科学进展, 2022, 41(10): 1940-1955.
[
|
| [32] |
|
| [33] |
罗蓉, 何黄琪, 陈爽. 原连片特困地区共同富裕能力评价及其演变跃迁[J]. 经济地理, 2022, 42(8): 154-164.
[
|
| [34] |
中国人口分布适宜度研究课题组. 中国人口分布适宜度报告[M]. 北京: 科学出版社, 2014: 37-41.
[Research Group of China Population Distribution Suitability. Report on suitability evaluation of population distribution in China. Beijing, China: Science Press, 2014: 37-41.]
|
| [35] |
方创琳. 中国城市群地图集[M]. 北京: 科学出版社, 2020.
[
|
| [36] |
戚伟, 刘盛和, 赵美风. “胡焕庸线”的稳定性及其两侧人口集疏模式差异[J]. 地理学报, 2015, 70(4): 551-566.
[
|
/
| 〈 |
|
〉 |
