
Impact of agriculture industrial development on farmers’ livelihood:Based on the research of four migrant villages in Hongsibu District, Ningxia
Received date: 2020-11-16
Request revised date: 2020-12-17
Online published: 2021-07-28
Supported by
National Natural Science Foundation of China(41761034)
National Natural Science Foundation of China(41961034)
National Natural Science Foundation of China(42061037)
Natural Sciences Foundation of Ningxia(2020AAC02008)
Copyright
Industrial development is not only the basis of rural revitalization, but also an important breakthrough point to increase farmers' income and rural prosperity. Industrial development and farmers' livelihood depend on and influence each other, and the mechanism of influence is very complex. Examining the experience of agriculture industrial development in the area of ecological migration and analyze the impact of industrial development on farmers' livelihood is of great significance for promoting the revival of rural industry, the restoration of farmers' livelihood, and the sustainable development in the area. This study took Hongsibu District of Ningxia Hui Autonomous Region, the largest single immigrant area in China, as the study area, selected one village for each of the major rural industries, and used data from a questionnaire survey and semistructured interviews to examine the impact of agricultural industries on farmers' livelihood. On the basis of comparing the input-output of different industries, the impact of industrial development on farmers' livelihood output, livelihood capital, and livelihood strategy was explored. The results show that: 1) The agricultural industries in Hongsibu District has shown the characteristics of transformation from traditional extensive to high efficiency intensive agriculture, but the problems of short industrial chain and low ability to resist market risks and natural hazards and disasters are still outstanding. 2) Agriculture industrial development has an obvious effect on improving farmers' income, but the degree of influence is closely related to industrial types and farmers' participation. The total livelihood capital of farmers who have completed agriculture industrial transformation is much higher than that of other farmers, and there are obvious differences in livelihood capital structure. 3) The dominant livelihood modes of farmers in different specialized villages vary, and the support of agriculture industrial development to farmers' livelihood still needs to be improved. Under the background of rural revitalization, it is urgent to cultivate new business entities, guide small farmers to organically connect with modern agricultural industries, promote farmers' deep integration into the agriculture industrial chain and benefit for a long time, and fully release the diversified functions of agricultural industries. At the same time, the local government should continue to provide targeted assistance to farmers with difficulties in industrial transformation through financial support, technical training, trusteeship, and other forms of help to enable them to establish a sustainable livelihood system.
MA Caihong , YUAN Qianying , WEN Qi , LI Xuemei . Impact of agriculture industrial development on farmers’ livelihood:Based on the research of four migrant villages in Hongsibu District, Ningxia[J]. PROGRESS IN GEOGRAPHY, 2021 , 40(5) : 784 -797 . DOI: 10.18306/dlkxjz.2021.05.006
表1 红寺堡区生计资本评价指标体系Tab.1 Livelihood capital evaluation indicator system for Hongsibu District |
| 资本类型 | 指标代码 | 指标名称 | 权重 | 计算方式(单位) |
|---|---|---|---|---|
| 自然资本 | 1 | 人均耕地面积 | 0.0729 | 亩 |
| 2 | 耕地质量 | 0.0797 | 家庭经营耕地非常好为1;较好为0.75;一般为0.5;差为0.25;非常差为0 | |
| 人力资本 | 3 | 户主年龄 | 0.0203 | 40~49岁为1;30~39岁、50~59岁为0.8;20~29岁、60~69岁为0.6;20岁以下、70岁以上为0.4 |
| 4 | 户主受教育程度 | 0.0402 | 技校、大专及以上为1;高中为0.8;初中为0.6;小学为0.4;未受教育为0.2 | |
| 5 | 家庭人口数 | 0.0249 | 人数 | |
| 6 | 家庭劳动力数量 | 0.0505 | 人数 | |
| 7 | 男性劳动力数量 | 0.0412 | 人数 | |
| 8 | 家庭人口健康程度 | 0.0308 | 家庭成员有重病、残疾、慢性病等,1人计-0.3,每增加1人累计-0.2 | |
| 9 | 技能培训 | 0.0372 | 次数 | |
| 物质资本 | 10 | 住房类型 | 0.0231 | 楼房记为1;砖瓦房记为0.6;其他记为0.4 |
| 11 | 住房面积 | 0.0280 | 人均住房面积(m2/人) | |
| 12 | 交通工具 | 0.0452 | 私家车记为1;农用车记为0.4;班车记为0.1 | |
| 13 | 生产机械条件 | 0.0393 | 农业车、手推车、铡草机、苞米机等,每1件记为0.1 | |
| 14 | 牲畜/禽类数量 | 0.0473 | 牛记为1;猪记为0.6;羊记为0.4;禽类记为0.1 | |
| 15 | 家庭耐用消费品 | 0.0347 | 拥有一件生产机械记为0.1,依次累加 | |
| 金融资本 | 16 | 家庭人均纯收入 | 0.0828 | 元 |
| 17 | 是否有信贷机会 | 0.0649 | 是记为1;否记为0 | |
| 18 | 是否能筹到钱 | 0.0376 | 是记为1;否记为0 | |
| 社会资本 | 19 | 家庭领导潜力 | 0.0418 | 家中有公职人员有记为1;没有记为0 |
| 20 | 邻里关系 | 0.0204 | 非常好为1;较好为0.75;一般为0.5;不好为0.25;非常不好为0 | |
| 21 | 外出务工人数 | 0.0437 | 人数 | |
| 22 | 家庭通讯支出 | 0.0265 | 元 | |
| 23 | 社会保障程度 | 0.0240 | 家中享有的社会保障项目数,有1项记为0.1,每增加1项累计0.1 | |
| 24 | 交通便利程度 | 0.0430 | 到达县城的便捷程度,便捷记为0.3;一般记为0.2;偏远记为0.1 |
表2 玉米产业投入—产出表Tab.2 Input-output of corn production |
| 机耕费 /(元/亩) | 种子费 /(元/亩) | 化肥投入 /(元/亩) | 农药 /(元/亩) | 水费 /(元/亩) | 单产 /(kg/亩) | 含水率/% | 单价 /(元/kg) | 纯收益 /(元/亩) |
|---|---|---|---|---|---|---|---|---|
| 80 | 60 | 160 | 30 | 60 | 1100~1200 | 26 | 1.21 | 586.8~675.6 |
表3 黄花菜产业投入—产出表Tab.3 Input-output of daylily production |
| 时间 | 生命 周期/a | 苗木费/(元/亩) | 栽苗费/(元/亩) | 化肥投入 /(元/亩) | 水费 /(元/亩) | 单产(鲜)/(kg/亩) | 采摘费/(元/亩) | 干黄花产出系数 | 均价 /(元/kg) | 纯收益 /(元/亩) |
|---|---|---|---|---|---|---|---|---|---|---|
| 2009年 | 1 | 600 | 120 | 230 | 88 | 0 | 1.6 | 0.17 | 16 | -1038 |
| 2010年 | 2 | — | — | 230 | 88 | 60 | 1.6 | 0.17 | 30 | 116 |
| 2011年 | 3 | — | — | 230 | 88 | 210 | 1.6 | 0.17 | 32 | 696 |
| 2012年 | 4 | — | — | 230 | 88 | 300 | 1.6 | 0.17 | 35 | 1182 |
| 2013—2018年 | 5~10 | — | — | 230 | 88 | 1380 | 3.2 | 0.17 | 46 | 6076 |
表4 葡萄产业投出—产出表Tab.4 Input-output of grape production |
| 生命 周期 | 化肥投入 /(元/亩) | 水费 /(元/亩) | 采摘费 /(元/亩) | 埋藤费 /(元/亩) | 放藤费 /(元/亩) | 单产 /(kg/亩) | 单价 /(元/kg) | 纯收益 /(元/亩) |
|---|---|---|---|---|---|---|---|---|
| 第3年 | 200 | 60 | 200 | 55 | 235 | 250 | 3.6 | 150 |
| 第4年 | 200 | 60 | 200 | 55 | 235 | 500 | 3.6 | 1050 |
| 第5年 | 200 | 60 | 200 | 55 | 235 | 1300 | 3.6 | 3930 |
| 第6年 | 200 | 60 | 200 | 55 | 235 | 1400 | 3.6 | 4290 |
注:葡萄苗为财政补贴,故而没有计入投入部分;第3年开始挂果,故而从第3年开始计算投入产出。 |
表5 枸杞产业投入—产出表Tab.5 Input-output of Lycium barbarum production |
| 时间 | 生命 周期 | 苗木费 /(株/亩) | 单价 /(元/株) | 化肥投入 /(元/亩) | 水费 /(元/亩) | 鲜果 /(kg/亩) | 采摘 /(元/kg) | 干果 系数 | 夏果 /(元/kg) | 秋果 /(元/kg) | 纯收益 /(元/亩) |
|---|---|---|---|---|---|---|---|---|---|---|---|
| 2000年 | 第1年 | 230* | 0.7 | 160 | 65 | 0.2 | 20 | 10 | -357.1 | ||
| 2001年 | 第2年 | 160 | 65 | 625 | 0.5 | 0.2 | 20 | 10 | 1213.0 | ||
| 2002—2007年 | 盛果期 | 160 | 65 | 1250 | 0.5 | 0.2 | 20 | 10 | 2650.0 | ||
| 2008—2009年 | 盛果期 | 160 | 65 | 1250 | 1.0 | 0.2 | 20 | 10 | 2025.0 | ||
| 2010—2011年 | 盛果期 | 160 | 65 | 1250 | 1.0 | 0.2 | 36 | 4 | 2725.0 | ||
| 2012年 | 第1年 | 260** | 5.0 | 160 | 75 | 11.25 | 2.0 | 0.2 | 36 | 4 | -1507.0 |
| 2012年 | 第1年 | 130*** | 5.0 | 160 | 75 | 11.25 | 2.0 | 0.2 | 36 | 4 | -856.5 |
| 2013年 | 第2年 | 160 | 75 | 625 | 2.0 | 0.2 | 36 | 4 | 615.0 | ||
| 2014年 | 盛果期 | 160 | 75 | 1250 | 2.0 | 0.2 | 36 | 4 | 1465.0 | ||
| 2015—2018年 | 盛果期 | 160 | 75 | 1250 | 2.0 | 0.2 | 55 | 30 | 7265.0 |
注:*表示种植宁杞1号;**表示种植宁杞7号;***表示种植宁杞9号。 |
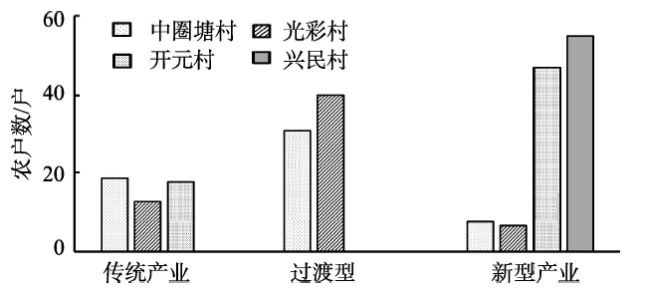
表6 样本村农户收入与产业的关联性Tab.6 Relationship between farmers' income and engagement in specialized agricultural industries in the sample villages |
| 样本村 | 高收入组(≥15000元/人) | 中收入组(6000~15000元/人) | 低收入组(<6000元/人) | 人均 纯收入/元 | 变异 系数/% | ||||||||
|---|---|---|---|---|---|---|---|---|---|---|---|---|---|
| 产业 | 数量/户 | 比例/% | 产业 | 数量/户 | 比例/% | 产业 | 数量/户 | 比例/% | |||||
| 兴民村 | 黄花菜 | 35 | 63.64 | 黄花菜 | 18 | 32.73 | 黄花菜 | 2 | 3.64 | 21048.62 | 66.14 | ||
| 中圈塘村 | 葡萄 | 8 | 13.79 | 葡萄+玉米 | 31 | 53.45 | 玉米 | 19 | 32.76 | 8923.70 | 68.92 | ||
| 光彩村 | 枸杞 | 7 | 11.67 | 枸杞+玉米 | 40 | 66.67 | 玉米 | 13 | 21.67 | 10142.92 | 50.12 | ||
| 开元村 | 草畜 | 6 | 9.23 | 草畜 | 41 | 63.08 | 玉米 | 18 | 27.69 | 9192.22 | 49.46 | ||
表7 样本村移民初期和2018年农户类型比例变化Tab.7 Changes in the type of rural households in the early stage of migration and in 2018 (%) |
| 类型 | 兴民村 | 中圈塘村 | 光彩村 | 开元村 | |||||||
|---|---|---|---|---|---|---|---|---|---|---|---|
| 移民初期 | 2018年 | 移民初期 | 2018年 | 移民初期 | 2018年 | 移民初期 | 2018年 | ||||
| 纯农型 | 34.55 | 32.73 | 34.48 | 18.97 | 53.33 | 8.33 | 41.54 | 20.00 | |||
| 农业主导型 | 3.64 | 38.18 | 3.45 | 24.14 | 0 | 21.67 | 12.31 | 20.00 | |||
| 兼业型 | 5.45 | 23.64 | 3.45 | 41.38 | 26.67 | 63.33 | 3.08 | 56.92 | |||
| 非农型 | 56.36 | 5.45 | 58.62 | 15.52 | 20.00 | 6.67 | 43.08 | 3.08 | |||
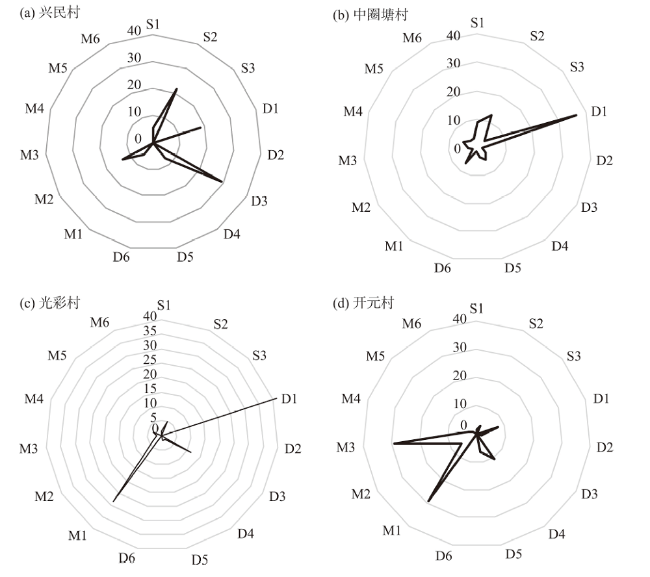
表8 样本村生计策略划分Tab.8 Classification of livelihood strategies in the sample villages |
| 大类 | 单一型生计模式 | 复合型生计模式 | 多样型生计模式 | |||||
|---|---|---|---|---|---|---|---|---|
| 类型 | 代码 | 类型 | 代码 | 类型 | 代码 | |||
| 单一型 | S | 复合型 | D | 多样型 | M | |||
| 务工型 | S1 | 务工+种植 | D1 | 务工+种植+养殖 | M1 | |||
| 亚类 | 种植型 | S2 | 务工+养殖 | D2 | 种植+务工+养殖 | M2 | ||
| 养殖型 | S3 | 种植+务工 | D3 | 务工+养殖+种植 | M3 | |||
| 种植+养殖 | D4 | 养殖+务工+种植 | M4 | |||||
| 养殖+种植 | D5 | 养殖+种植+务工 | M5 | |||||
| 养殖+务工 | D6 | 种植+养殖+务工 | M6 | |||||
| [1] |
文琦, 郑殿元, 施琳娜. 1949—2019年中国乡村振兴主题演化过程与研究展望[J]. 地理科学进展, 2019,38(9):1272-1281.
[
|
| [2] |
李冬慧, 乔陆印. 从产业扶贫到产业兴旺: 贫困地区产业发展困境与创新趋向 [J]. 求实, 2019(6): 81-91, 109-110.
[
|
| [3] |
涂圣伟. 脱贫攻坚与乡村振兴有机衔接: 目标导向、重点领域与关键举措[J]. 中国农村经济, 2020(8):2-12.
[
|
| [4] |
李玉山, 陆远权. 产业扶贫政策能降低脱贫农户生计脆弱性吗? 政策效应评估与作用机制分析[J]. 财政研究, 2020(5):63-77.
[
|
| [5] |
刘卫柏, 于晓媛, 袁鹏举. 产业扶贫对民族地区贫困农户生计策略和收入水平的影响[J]. 经济地理, 2019,39(11):175-182.
[
|
| [6] |
沈宏亮, 张佳, 郝宇彪. 乡村振兴视角下产业扶贫政策的增收效应研究: 基于入户调查的微观证据[J]. 经济问题探索, 2020(4):173-183.
[
|
| [7] |
胡晗, 司亚飞, 王立剑. 产业扶贫政策对贫困户生计策略和收入的影响: 来自陕西省的经验证据[J]. 中国农村经济, 2018(1):78-89.
[
|
| [8] |
宁静, 殷浩栋, 汪三贵, 等. 产业扶贫对农户收入的影响机制及效果: 基于乌蒙山和六盘山片区产业扶贫试点项目的准实验研究 [J]. 中南财经政法大学学报, 2019(4): 58-66, 88, 159-160.
[
|
| [9] |
王志涛, 徐兵霞. 产业扶贫降低了贫困脆弱性吗? 基于CLDS的准实验研究[J]. 云南财经大学学报, 2020,36(10):32-44.
[
|
| [10] |
吴雄周. 产业扶贫农户生计协同响应机制的解构及实践[J]. 甘肃社会科学, 2019(4):176-183.
[
|
| [11] |
袁明宝. 压力型体制、生计模式与产业扶贫中的目标失灵: 以黔西南L村为例[J]. 北京工业大学学报(社会科学版), 2018,18(4):19-25.
[
|
| [12] |
范东君. 精准扶贫视角下我国产业扶贫现状、模式与对策探析: 基于湖南省湘西州的分析[J]. 中共四川省委党校学报, 2016(4):74-78.
[
|
| [13] |
游俊, 李晓冰. 生计响应视域下的产业扶贫益贫机制研究: 以贵州省瓮安县为例[J]. 西南民族大学学报(人文社科版), 2019,40(10):185-192.
[
|
| [14] |
王君涵, 李文, 冷淦潇, 等. 易地扶贫搬迁对贫困户生计资本和生计策略的影响: 基于8省16县的3期微观数据分析[J]. 中国人口·资源与环境, 2020,30(10):143-153.
[
|
| [15] |
赵雪雁. 生计资本对农牧民生活满意度的影响: 以甘南高原为例[J]. 地理研究, 2011,30(4):687-698.
[
|
| [16] |
赵雪雁, 刘江华, 王伟军, 等. 贫困山区脱贫农户的生计可持续性及生计干预: 以陇南山区为例[J]. 地理科学进展, 2020,39(6):982-995.
[
|
| [17] |
陈秧分, 刘玉, 李裕瑞. 中国乡村振兴背景下的农业发展状态与产业兴旺途径[J]. 地理研究, 2019,38(3):632-642.
[
|
| [18] |
陈莉, 钟玲. 农民合作社参与扶贫的可行路径: 以小农为基础的农业产业发展为例[J]. 农村经济, 2017(5):116-122.
[
|
| [19] |
吴重庆, 张慧鹏. 小农与乡村振兴: 现代农业产业分工体系中小农户的结构性困境与出路[J]. 南京农业大学学报(社会科学版), 2019,19(1):13-24, 163.
[
|
| [20] |
王睦欣, 庞德良. 乡村经济多元化发展及其推进路径研究[J]. 经济纵横, 2019(12):116-123.
[
|
| [21] |
覃志敏. 社会网络与移民生计的分化发展: 以桂西北集中安置扶贫移民为例[D]. 武汉: 华中师范大学, 2014.
[
|
| [22] |
苏芳, 蒲欣冬, 徐中民, 等. 生计资本与生计策略关系研究: 以张掖市甘州区为例[J]. 中国人口·资源与环境, 2009,19(6):119-125.
[
|
| [23] |
|
| [24] |
陈良敏, 丁士军, 陈玉萍. 农户家庭生计策略变动及其影响因素研究: 基于 CFPS 微观数据[J]. 财经论丛, 2020(3):12-21.
[
|
| [25] |
|
| [26] |
李雪萍, 魏爱春. 摆动型生计: 生计能力视域下的生存策略选择: 以重庆市M镇易地扶贫搬迁安置点为例[J]. 吉首大学学报(社会科学版), 2020,41(4):65-74.
[
|
/
| 〈 |
|
〉 |