
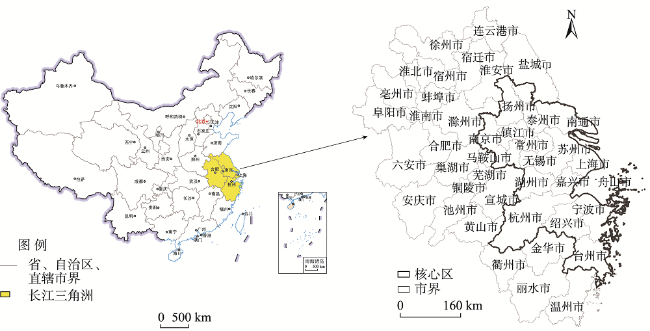
Change in distribution and growth shifts of population in the Yangtze River Delta and influencing factors
Received date: 2019-11-01
Request revised date: 2020-08-02
Online published: 2021-02-28
Supported by
National Natural Science Foundation of China(41871119)
Copyright
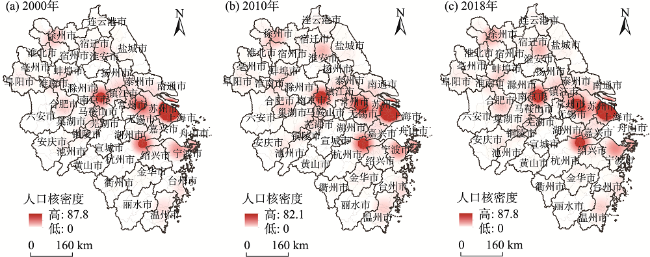
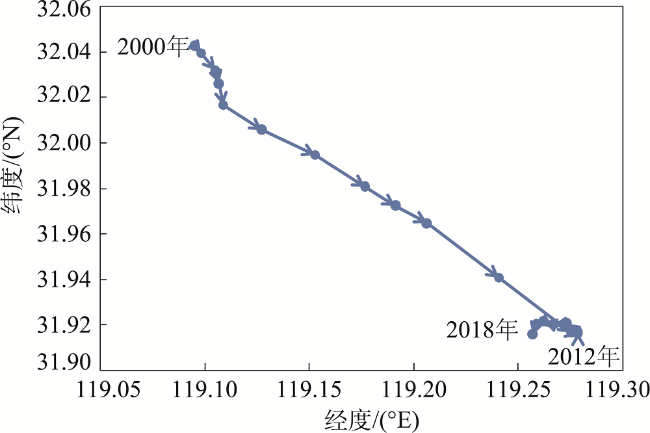
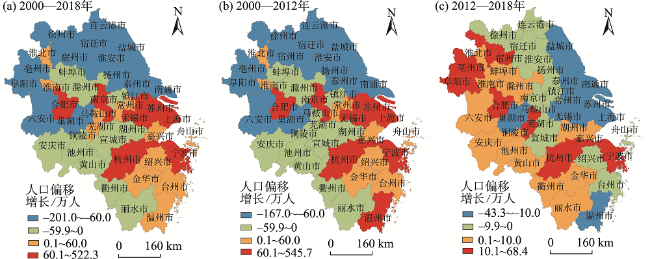
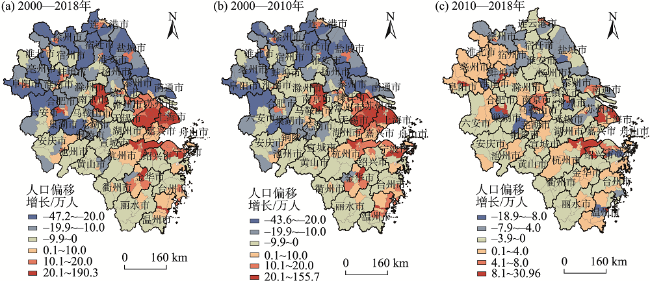
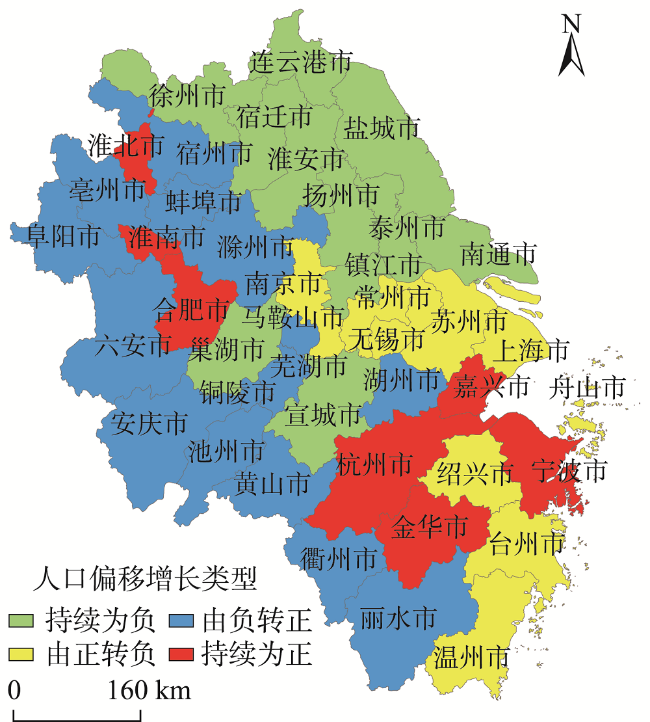
Population distribution is an important indicator of regional development patterns. Also, regional coordinated development is closely related to the balanced distribution of the population. In the context of the regional integration of the Yangtze River Delta as a national strategy, the population distribution across the Yangtze River Delta has undergone significant changes. Using Kernal density analysis, gravity center analysis, concentration index, and shift-share analysis methods, this study examined the spatio-temporal change characteristics of the population in the Yangtze River Delta from 2000 to 2018, and explored the influencing factors as well as internal mechanisms of population growth shifts by utilizing quantitative methods. The main conclusions are as follows: 1) The shift in the population distribution trend led by some cities did not significantly change the imbalanced pattern of regional population distribution, and the increase in the concentration index indicates that the regional population concentration showed a steady growth trend. 2) The research based on shift-share analysis found that the shift in population growth pattern was mainly manifested in the acceleration of population growth in some underdeveloped areas. For example, Anhui Province was transformed into positive growth shift at the provincial scale. On the city scale, the positive growth shift dominated by core developed cities has changed to the positive growth shift dominated by some less developed cities. The spatial distribution of positive growth shift of municipal districts changed from the core areas to the peripheral areas. However, the population was still attracted to a few large cities and municipal districts. The diversified population growth shift trend characterizes the differentiated demands for future development strategies. 3) Economic factors, social development, and financial resources were important driving forces of population growth shift in the Yangtze River Delta. However, the temporal and spatial change of influencing factors shows that the formulation of future population balancing policies not only needs to be adapted to local conditions, but also should evolve through time. This research not only provides a reference for the formulation of relevant population policies, but also enriches the empirical findings on the spatial and temporal change of population.
YAN Dongsheng , SUN Wei , WANG Yue , XU Shiyao . Change in distribution and growth shifts of population in the Yangtze River Delta and influencing factors[J]. PROGRESS IN GEOGRAPHY, 2020 , 39(12) : 2068 -2082 . DOI: 10.18306/dlkxjz.2020.12.009
表1 长江三角洲人口分布的集中指数Tab.1 Concentration index of population distribution in the Yangtze River Delta |
| 指数 | 2000年 | 2001年 | 2002年 | 2003年 | 2004年 | 2005年 | 2006年 | 2007年 | 2008年 | 2009年 |
|---|---|---|---|---|---|---|---|---|---|---|
| CI | 0.1974 | 0.2020 | 0.2053 | 0.2079 | 0.2117 | 0.2148 | 0.2183 | 0.2245 | 0.2292 | 0.2332 |
| 指数 | 2010年 | 2011年 | 2012年 | 2013年 | 2014年 | 2015年 | 2016年 | 2017年 | 2018年 | |
| CI | 0.2459 | 0.2480 | 0.2493 | 0.2511 | 0.2525 | 0.2532 | 0.2549 | 0.2574 | 0.2601 |
表2 2000—2018年长江三角洲人口增长总体状况Tab.2 Overall situation of population growth in the Yangtze River Delta, 2000-2018 |
| 年份 | 长江三角洲 | 分区域人口增长率/% | ||||||
|---|---|---|---|---|---|---|---|---|
| 总人口/万人 | 增长率/% | 占全国比重/% | 上海市 | 江苏省 | 浙江省 | 安徽省 | ||
| 2000 | 19651.70 | 1.79 | 15.51 | 2.65 | 0.79 | 4.57 | 0.69 | |
| 2001 | 19868.01 | 1.10 | 15.57 | 3.71 | 1.00 | 1.04 | 0.57 | |
| 2002 | 20015.38 | 0.74 | 15.58 | 2.68 | 0.53 | 1.01 | 0.26 | |
| 2003 | 20217.24 | 1.01 | 15.64 | 3.09 | 0.67 | 1.68 | 0.31 | |
| 2004 | 20478.51 | 1.29 | 15.75 | 3.92 | 0.79 | 1.41 | 1.05 | |
| 2005 | 20556.75 | 0.38 | 15.72 | 3.01 | 0.87 | 1.33 | -1.73 | |
| 2006 | 20767.86 | 1.03 | 15.80 | 3.91 | 0.88 | 1.62 | -0.16 | |
| 2007 | 21025.88 | 1.24 | 15.91 | 5.06 | 0.88 | 1.64 | 0.13 | |
| 2008 | 21230.86 | 0.97 | 15.99 | 3.73 | 0.69 | 1.12 | 0.28 | |
| 2009 | 21403.16 | 0.81 | 16.04 | 3.25 | 0.56 | 1.21 | -0.07 | |
| 2010 | 21545.97 | 0.67 | 16.07 | 4.18 | 0.69 | 3.24 | -2.84 | |
| 2011 | 21662.53 | 0.54 | 16.08 | 1.95 | 0.56 | 0.30 | 0.18 | |
| 2012 | 21754.83 | 0.43 | 16.07 | 1.40 | 0.32 | 0.26 | 0.34 | |
| 2013 | 21872.89 | 0.54 | 16.07 | 1.46 | 0.26 | 0.38 | 0.70 | |
| 2014 | 21966.46 | 0.43 | 16.06 | 0.44 | 0.25 | 0.18 | 0.88 | |
| 2015 | 22066.45 | 0.46 | 16.05 | -0.43 | 0.23 | 0.56 | 1.00 | |
| 2016 | 22193.15 | 0.57 | 16.05 | 0.18 | 0.24 | 0.92 | 0.85 | |
| 2017 | 22344.28 | 0.68 | 16.07 | -0.06 | 0.33 | 1.20 | 0.95 | |
| 2018 | 22535.08 | 0.85 | 16.15 | 0.23 | 0.46 | 1.41 | 1.10 | |
数据来源:《中国统计年鉴(2000—2018)》、各省市2018年统计公报。 |
表3 2000—2018年长江三角洲三省一市人口偏移增长状况对比Tab.3 Provincial scale growth shift of population in the Yangtze River Delta, 2000-2018 (万人) |
| 省市 | 2000—2018年 | 2000—2012年 | 2012—2018年 |
|---|---|---|---|
| 上海市 | 579.16 | 599.68 | -42.03 |
| 江苏省 | -286.20 | -138.85 | -142.38 |
| 浙江省 | 370.43 | 296.24 | 63.56 |
| 安徽省 | -663.39 | -757.07 | 120.84 |
表4 人口偏移增长的影响因素选择Tab.4 Selected influencing factors for population growth shift |
| 变量类型 | 编号 | 变量名称(单位) | 观测值数量* | 最小值 | 最大值 | 标准差 |
|---|---|---|---|---|---|---|
| 自然条件 | X1 | 年平均气温(℃) | 756 | 13.80 | 21.60 | 1.13 |
| 经济因素 | X2 | 城镇居民可支配收入(万元) | 756 | 0.44 | 4.66 | 0.86 |
| X3 | 就业人口(万人) | 756 | 39.80 | 1375.00 | 194.48 | |
| X4 | 固定资产投资(亿元) | 756 | 21.24 | 5771.17 | 1191.37 | |
| X5 | FDI(亿美元) | 756 | 0.00 | 185.14 | 22.90 | |
| X6 | 三产比重(%) | 756 | 23.40 | 69.90 | 7.22 | |
| 社会发展 | X7 | 公路密度(km/km2) | 756 | 0.20 | 2.44 | 0.46 |
| X8 | 万人医疗卫生院床位数(张) | 756 | 9.63 | 96.59 | 13.96 | |
| X9 | 建成区绿化覆盖率(%) | 756 | 13.80 | 77.78 | 7.08 | |
| 财政水平 | X10 | 人均财政支出(元) | 756 | 253.72 | 29504.05 | 3946.31 |
注:*为保持全文数据的可比性,所有数据均以2000年为基准,即756代表42个城市、18 a的数据观测值。 |
表5 长江三角洲人口偏移增长的影响因素的回归结果Tab.5 Regression results of factors affecting population growth shift in the Yangtze River Delta, 2000-2018 |
| 变量 | 2001—2018年 | 2001—2012年 | 2012—2018年 | |||||
|---|---|---|---|---|---|---|---|---|
| FE | RE | FE | RE | FE | RE | |||
| X1 | 0.0046 (0.02) | -0.0580 (-0.23) | -0.0487 (-0.18) | -0.1286 (-0.47) | -0.1628 (-1.16) | -0.1616 (-1.16) | ||
| X2 | 2.4180** (2.11) | 0.6190 (0.60) | 3.8060** (2.09) | 0.7650 (0.45) | 1.4570* (1.68) | 1.4370* (1.71) | ||
| X3 | 0.0038*** (2.91) | 0.0015** (2.38) | 0.0016** (2.27) | 0.0086** (2.54) | 0.0019*** (2.72) | 0.0017*** (2.66) | ||
| X4 | -0.0012 (-1.59) | -0.0011 (-1.49) | 0.0015*** (2.75) | 0.0007** (2.35) | -0.0007** (-2.12) | -0.0007** (-2.20) | ||
| X5 | 0.1434*** (3.26) | 0.2466*** (6.99) | 0.2163*** (2.78) | 0.4077*** (5.98) | 0.0594** (2.56) | 0.0553*** (2.68) | ||
| X6 | 0.1448** (2.50) | 0.1779* (1.95) | 0.1338** (2.03) | 0.3311*** (2.68) | 0.0185*** (3.32) | 0.0236*** (3.43) | ||
| X7 | 0.7700 (0.52) | -1.6275 (-1.33) | 5.8110** (2.50) | 4.0857** (2.41) | -1.6155* (-1.87) | -1.5234* (-1.89) | ||
| X8 | 0.3385*** (5.61) | 0.2638*** (4.61) | 0.1826** (2.14) | 0.1672* (1.95) | 0.1318*** (3.68) | 0.1354*** (4.15) | ||
| X9 | -0.0460 (-0.19) | -0.0085 (-0.04) | -0.1130 (-0.45) | -0.0791 (-0.31) | 0.0796** (2.11) | 0.0787** (2.12) | ||
| X10 | 0.0004*** (2.61) | 0.0009*** (3.61) | 0.0017*** (2.80) | 0.001*** (3.17) | -0.0004*** (-3.37) | -0.0004*** (-3.36) | ||
| R2 | 0.36 | 0.35 | 0.37 | 0.34 | 0.32 | 0.34 | ||
| Hausman检验 | 16.97** | 25.09*** | 30.38*** | |||||
注:*、**和***分别表示0.1、0.05和0.01显著性水平,括号内为t统计量。下同。 |
表6 不同区域人口偏移增长的影响因素的回归结果Tab.6 Regression results of factors affecting population growth shift in different regions, 2000-2018 |
| 变量 | 模型1 | 模型2 | 模型3 | 模型4 |
|---|---|---|---|---|
| X1 | -0.650 (-0.35) | -0.180 (-0.69) | 0.170 (0.59) | -0.066 (-0.20) |
| X2 | 1.108** (2.20) | 2.204*** (3.06) | -1.282*** (-4.02) | -0.422 (-1.01) |
| X3 | 0.116* (1.70) | 0.015** (2.42) | 0.055*** (3.68) | 0.023*** (3.67) |
| X4 | -0.003*** (-2.82) | 0.003*** (2.60) | -0.002* (-1.82) | 0.043** (2.38) |
| X5 | 0.285* (1.94) | 0.113 (0.38) | 0.200*** (2.70) | 0.121** (2.12) |
| X6 | 0.133 (1.42) | 0.061*** (3.39) | 1.302 (1.09) | 0.012*** (3.06) |
| X7 | 6.665** (2.42) | 0.392** (2.14) | 2.790 (1.22) | -3.024* (-1.72) |
| X8 | 0.096** (2.32) | 0.168** (2.47) | 0.622** (2.35) | 0.191* (1.80) |
| X9 | 0.724** (2.39) | 0.073 (0.34) | 0.056** (2.17) | -0.101 (-0.31) |
| X10 | -0.008 (-0.53) | 0.003*** (3.05) | -0.001 (-1.05) | 0.001* (1.75) |
| R2 | 0.34 | 0.30 | 0.30 | 0.44 |
| Hausman检验 | 12.78** | 23.55*** | 37.17*** | 19.88** |
| [1] |
马颖忆, 陆玉麒, 张莉. 江苏省人口空间格局演化特征[J]. 地理科学进展, 2012,31(2):167-175.
[
|
| [2] |
张耀军, 岑俏. 中国人口空间流动格局与省际流动影响因素研究[J]. 人口研究, 2014,38(5):54-71.
[
|
| [3] |
高倩, 阿里木江·卡斯木. 基于DMSP/OLS夜间灯光数据的天山北坡城市群人口分布空间模拟[J]. 西北人口, 2017,38(3):113-120.
[
|
| [4] |
杨剑, 蒲英霞, 秦贤宏, 等. 浙江省人口分布的空间格局及其时空演变[J]. 中国人口·资源与环境, 2010,20(3):95-99.
[
|
| [5] |
段学军, 王书国, 陈雯. 长江三角洲地区人口分布演化与偏移增长[J]. 地理科学, 2008,28(2):139-144.
[
|
| [6] |
闫东升, 杨槿, 高金龙. 长江三角洲人口与经济的非均衡格局及其影响因素研究[J]. 地理科学, 2018,38(3):376-384.
[
|
| [7] |
王超, 阚瑷珂, 曾业隆, 等. 基于随机森林模型的西藏人口分布格局及影响因素[J]. 地理学报, 2019,74(4):664-680.
[
|
| [8] |
邓楚雄, 李民, 宾津佑. 湖南省人口分布格局时空变化特征及主要影响因素分析[J]. 经济地理, 2017,37(12):41-48.
[
|
| [9] |
|
| [10] |
|
| [11] |
齐宏纲, 刘盛和, 戚伟, 等. 广东跨省流入人口缩减的演化格局及影响因素研究[J]. 地理研究, 2019,38(7):1764-1776.
[
|
| [12] |
刘望保, 石恩名. 基于ICT的中国城市间人口日常流动空间格局: 以百度迁徙为例[J]. 地理学报, 2016,71(10):1667-1679.
[
|
| [13] |
胡焕庸. 中国人口的分布、区划和展望[J]. 地理学报, 1990,45(2):139-145.
[
|
| [14] |
|
| [15] |
陈前虎, 司梦祺. 1990—2015年浙江省人口时空变迁特征与趋势分析[J]. 现代城市研究, 2018(3):8-14, 38.
[
|
| [16] |
张家旗, 陈爽, Mapunda D W. 坦桑尼亚人口分布空间格局及演变特征[J]. 地理科学进展, 2017,36(5):610-617.
[
|
| [17] |
吉亚辉, 张岩. 2000—2010年甘肃人口分布演变特征分析[J]. 西北人口, 2014,35(6):104-109.
[
|
| [18] |
李晓玲, 修春亮, Шендрик Александр, 等. 中俄滨海大城市人口密度空间格局比较研究: 以圣彼得堡和大连市为例[J]. 经济地理, 2018,38(9):78-86.
[
|
| [19] |
吴一凡, 刘彦随, 李裕瑞. 中国人口与土地城镇化时空耦合特征及驱动机制[J]. 地理学报, 2018,73(10):1865-1879.
[
|
| [20] |
|
| [21] |
吕晨, 樊杰, 孙威. 基于ESDA的中国人口空间格局及影响因素研究[J]. 经济地理, 2009,29(11):1797-1802.
[
|
| [22] |
肖周燕. 人口迁移势能转化的理论假说: 对人口迁移推—拉理论的重释[J]. 人口与经济, 2010(6):77-83.
[
|
| [23] |
闫东升, 杨槿. 长江三角洲人口与经济空间格局演变及影响因素[J]. 地理科学进展, 2017,36(7):820-831.
[
|
| [24] |
夏怡然, 苏锦红, 黄伟. 流动人口向哪里集聚?流入地城市特征及其变动趋势[J]. 人口与经济, 2015(3):13-22.
[
|
/
| 〈 |
|
〉 |