
Evolution characteristics and driving factors of county poverty degree in China’s southeast coastal areas: A case study of Fujian Province
Received date: 2019-12-20
Request revised date: 2020-05-11
Online published: 2021-01-28
Supported by
National Natural Science Foundation of China(41701118)
China Postdoctoral Science Foundation(2018M641458)
Soft Science Project of Fujian Province(2017R0051)
Copyright
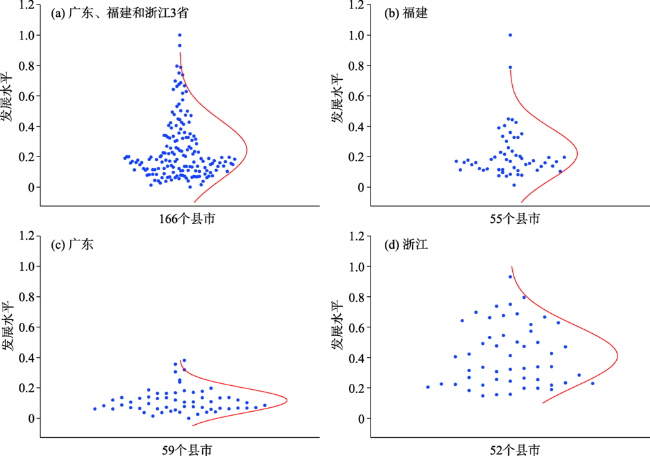
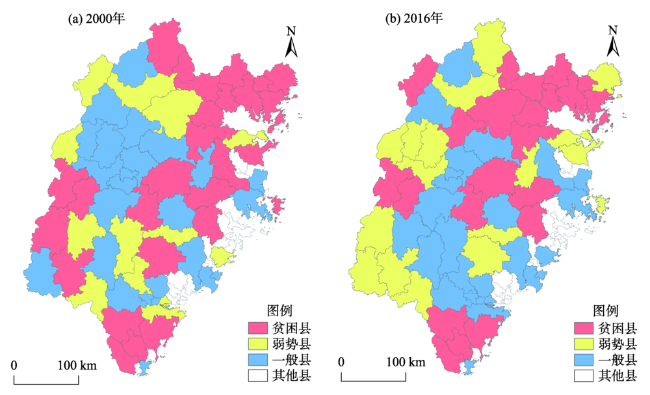
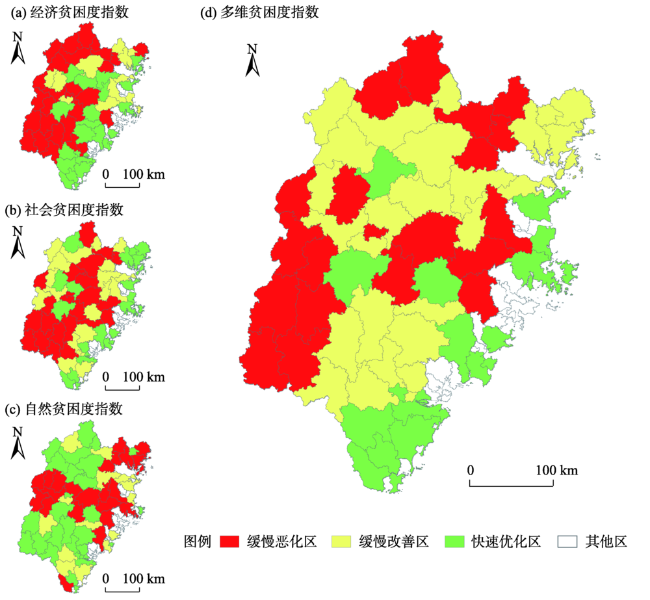
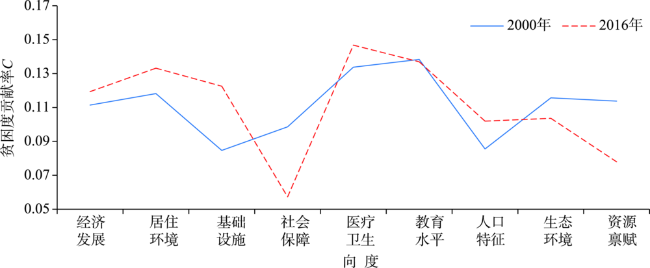
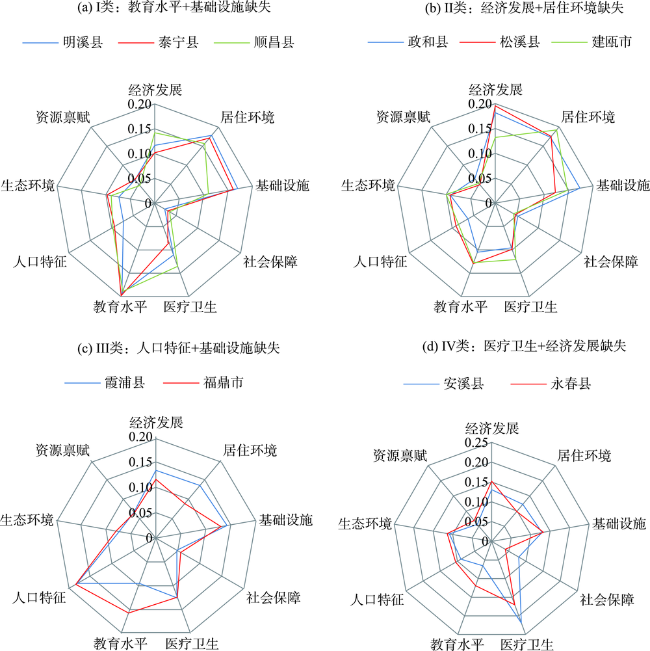
:Regional poverty is the focus of attention and research of the society, while the traditional study of poverty areas lacks attention to the southeast coast of China. Taking 64 counties in Fujian Province—a relatively developed coastal province in China's southeast coastal areas—as an example, this study constructed a measurement model of 30 indicators in three dimensions and nine vectors, and analyzed the characteristics of change and driving factors of county poverty degree in 2000 and 2016 by using the multidimensional poverty degree index (PI) and Kohonen neural network algorithm. The results show that: 1) The county development level of Fujian Province is typical among the southeast coastal provinces (Guangdong, Fujian, and Zhejiang). 2) According to the poverty degree index, the province can be divided into poor counties, disadvantaged counties, and normal counties. In general, poor counties and disadvantaged counties are found in the north and southwest, and concentrated near the peripheral areas of the province. 3) The change rates of the economic dimension, social dimension, and natural dimension of poverty indicate that most of the counties belong to the slowly deteriorating area, followed by counties with rapidly improving conditions, while the counties with slow improvement are few and scattered spatially. The change rate based on PI shows that the areas with slowly deteriorating conditions are distributed in the northern, central, and southwestern parts of Fujian Province, the areas with slowly improving conditions are distributed in western Fujian Province, while rapidly improving areas are distributed in the east coast of Fujian Province. The poverty of most poor counties are caused by economic, natural, and other factors, which have important influence on the process of poverty alleviation. 4) In 2000 and 2016, medical and health care, education level, living environment, and economic development deeply affected the contribution rate of PI. Strengthening the development and provision of public services such as infrastructure, medical and health care, and education should be the focus of current poverty alleviation efforts in Fujian Province. At the same time, the ecological environment and resource endowment also play a part in poverty alleviation. 5) There are four types of poverty factors based on contribution rate of poverty degree in different vectors: Type I is dominated by education and infrastructure, type II is dominated by economic development and living environment, type III is dominated by demographic characteristics and infrastructure, and type IV is dominated by health care and economic development. This study can be of some reference for the identification of poverty counties, and may contribute to the implementation of targeted poverty alleviation strategy.
Key words: poverty degree; Kohonen neural network; poverty county; Fujian Province
WANG Wulin , YU Cuichan , ZENG Xianjun , LI Chunqiang . Evolution characteristics and driving factors of county poverty degree in China’s southeast coastal areas: A case study of Fujian Province[J]. PROGRESS IN GEOGRAPHY, 2020 , 39(11) : 1860 -1873 . DOI: 10.18306/dlkxjz.2020.11.007
表1 东南沿海地区县域发展水平指标体系Tab.1 County development level index system for the southeast coastal areas of China |
| 维度 | 指标 | 变量 | 单位 |
|---|---|---|---|
| 收入及 购买力水平 | 人均GDP | x1 | 元/人 |
| 人均居民储蓄存款余额 | x2 | 元/人 | |
| 人均社会消费品零售总额 | x3 | 元/人 | |
| 农民人均纯收入 | x4 | 元 | |
| 非农产业 发展水平 | 第三产业增加值比第二产业增加值 | x5 | — |
| 第二产业从业人员数 | x6 | 人 | |
| 第三产业从业人员数 | x7 | 人 | |
| 人均规模以上工业企业数 | x8 | 个/万人 | |
| 农业 发展水平 | 地均农业机械总动力 | x9 | 万kW/100 km2 |
| 人均农业增加值 | x10 | 万元/人 | |
| 人均粮食产量 | x11 | kg/人 | |
| 政府 能力 | 人均固定资产投资额 | x12 | 万元/人 |
| 人均公共财政收入 | x13 | 万元/人 | |
| 人均公共财政支出 | x14 | 万元/人 | |
| 人均医疗卫生机构床位数 | x15 | 床/千人 |
表2 县域贫困度评价指标体系Tab.2 Evaluation index system of county poverty degree |
| 维度 | 向度 | 具体指标 | 指标方向 | 指标说明 |
|---|---|---|---|---|
| 经济 维度 | 经济发展 | 第二、三产业增加值占GDP比重(%) | - | 比重越大,可持续脱贫的驱动力越大 |
| 农民人均纯收入(元) | - | 农民收入是现阶段衡量农村贫困的基础和核心,越贫困的县域,农民人均纯收入越低 | ||
| 人均一般财政预算收入(元) | - | 衡量县政府的收入能力和水平,人均一般财政预算收入之低可见县域贫困之深 | ||
| 人均全社会固定资产投资 | - | 投资力度大能推进减贫进程 | ||
| 农林水事务支出占比(%) | - | 支出力度大能推进减贫进程 | ||
| 人均社会消费品零售总额(元) | - | 值越大,消费需求越旺盛,贫困度越低 | ||
| 人均GDP(元) | - | 反映县域宏观经济运行状况,用县域生产总值与区内常住人口的比值表示 | ||
| 恩格尔系数 | + | 恩格尔系数可用于测量贫困,恩格尔系数越大越不利于减贫 | ||
| 社会 维度 | 居住环境 | 人均住房面积(m2) | - | 贫困认定的居住面积要小于某一标准 |
| 每千户电话拥有量(台) | - | 反映贫困户的耐用品拥有量 | ||
| 夜间灯光指数 | - | 值越大反映城镇建成区面积越大,贫困度越低 | ||
| 城镇化率(%) | - | 衡量城镇化发展程度,反映社会生产力水平,为城镇人口与常住人口的比值,城镇化率越高,贫困度越低 | ||
| 基础设施 | 农村公路里程(km) | - | 值越大越利于通过吸引投资、提高生产效率来减贫 | |
| 地均农业机械总动力(kW/hm2) | - | 农机化程度越高,贫困度越低 | ||
| 农村人均用电量(kWh) | - | 用电水平越高,间接反映耐用品拥有量越大,贫困度越低 | ||
| 社会保障 | 参加基本养老保险比例(%) | - | 反映贫困人口的兜底保障情况,有利于贫困人口减少 | |
| 参加基本医疗保险比例(%) | - | 反映贫困人口的兜底保障情况,有利于贫困人口减少 | ||
| 农村低保人口(人) | + | 反映农村脱贫成绩 | ||
| 医疗卫生 | 每千人卫生机构床位数(床) | - | 值越大,医疗保障水平越高,贫困度越低 | |
| 人均卫生技术人员个数(人) | - | 反映医疗水平和服务覆盖面 | ||
| 教育水平 | 师生比(%) | - | 反映县域教育文化水平 | |
| 文盲人口占15岁及以上人口比重(%) | + | 反映劳动力转化为生产力的效率大小 | ||
| 教育经费支出(元) | - | 教育投入越充足越利于教育减贫 | ||
| 人口特征 | 人口总抚养比(%) | + | 人口抚养比越小,人口红利越好,贫困度越低 | |
| 少数民族人口占比(%) | + | 少数民族聚居区一般贫困度较高 | ||
| 自然 维度 | 生态环境 | 坡度>15°的土地面积比重(%) | + | 坡度>15°的土地为难利用地,值越小越利于防止生态贫困 |
| NDVI | - | 反映地表植被覆盖状况,值越小,生态越脆弱,不利于减贫 | ||
| 资源禀赋 | 人均耕地面积(hm2/人) | - | 耕地是土地资源中重要组成,反映耕地资源对脱贫的支撑能力 | |
| 农田生产潜力(kg/hm2) | - | 利用GAEZ模型综合考虑光、温、水、CO2浓度、病虫害、气候限制、土壤、地形等多方面因素计算,反映粮食生产潜力 | ||
| 单位农地面积产值(元/hm2) | - | 土地生产力越高,越有利于增加农民收入,降低贫困度 |
表3 Kohonen神经网络聚类结果Tab.3 Clustering results of Kohonen neural network |
| 类型 | 主导向度 | 样本县 | 数量 |
|---|---|---|---|
| I类 | 教育水平和基础设施 | 寿宁、屏南、周宁、顺昌、柘荣、光泽、古田、明溪、闽清、永定、建阳、罗源、上杭、泰宁、武平 | 15 |
| II类 | 经济发展和居住环境 | 政和、宁化、永泰、松溪、清流、尤溪、建瓯、浦城、长汀、将乐、建宁 | 11 |
| III类 | 人口特征和基础设施 | 霞浦、福安、福鼎、平潭 | 4 |
| IV类 | 医疗卫生和经济发展 | 诏安、漳浦、云霄、平和、仙游、大田、连江、南靖、安溪、永春、闽侯 | 11 |
| [1] |
|
| [2] |
|
| [3] |
|
| [4] |
文琦, 郑殿元. 西北贫困地区乡村类别识别与振兴途径研究[J]. 地理研究, 2019,38(3):509-521.
[
|
| [5] |
刘一明, 胡卓玮, 赵文吉, 等. 基于BP神经网络的区域贫困空间特征研究: 以武陵山连片特困区为例[J]. 地球信息科学学报, 2015,17(1):69-77.
[
|
| [6] |
徐戈, 陆迁, 姜雅莉. 社会资本、收入多样化与农户贫困脆弱性[J]. 中国人口·资源与环境, 2019,29(2):123-133.
[
|
| [7] |
刘艳华, 徐勇. 中国农村多维贫困地理识别及类别划分[J]. 地理学报, 2015,70(6):993-1007.
[
|
| [8] |
周扬, 郭远智, 刘彦随. 中国县域贫困综合测度及2020年后减贫瞄准[J]. 地理学报, 2018,73(8):1478-1493.
[
|
| [9] |
|
| [10] |
刘艳华, 徐勇. 扶贫模式可持续减贫效应的分析框架及机理探析[J]. 地理科学进展, 2018,37(4):567-578.
[
|
| [11] |
|
| [12] |
|
| [13] |
|
| [14] |
|
| [15] |
|
| [16] |
刘愿理, 廖和平, 张茜茜, 等. 西南喀斯特区贫困空间剥夺的识别及空间格局分析[J]. 农业工程学报, 2019,35(15):284-294.
[
|
| [17] |
|
| [18] |
|
| [19] |
|
| [20] |
袁媛, 王仰麟, 马晶, 等. 河北省县域贫困多维评估[J]. 地理科学进展, 2014,33(1):124-133.
[
|
| [21] |
|
| [22] |
|
| [23] |
|
| [24] |
马振邦, 陈兴鹏, 贾卓, 等. 人穷还是地穷?空间贫困陷阱的地统计学检验[J]. 地理研究, 2018,37(10):1997-2010.
[
|
| [25] |
曾永明, 张果. 基于GIS和BP神经网络的区域农村贫困空间模拟分析: 一种区域贫困程度测度新方法[J]. 地理与地理信息科学, 2011,27(2):70-75.
[
|
| [26] |
谭雪兰, 蒋凌霄, 米胜渊, 等. 湖南省县域乡村反贫困绩效评价与空间分异特征[J]. 地理科学, 2019,39(6):938-946.
[
|
| [27] |
丁建军, 冷志明. 区域贫困的地理学分析[J]. 地理学报, 2018,73(2):232-247.
[
|
| [28] |
刘小鹏, 李永红, 王亚娟, 等. 县域空间贫困的地理识别研究: 以宁夏泾源县为例[J]. 地理学报, 2017,72(3):545-557.
[
|
| [29] |
陈烨烽, 王艳慧, 赵文吉, 等. 中国贫困村致贫因素分析及贫困类型划分[J]. 地理学报, 2017,72(10):1827-1844.
[
|
| [30] |
|
| [31] |
梁晨霞, 王艳慧, 徐海涛, 等. 贫困村空间分布及影响因素分析: 以乌蒙山连片特困区为例[J]. 地理研究, 2019,38(6):1389-1402.
[
|
| [32] |
傅伯杰. 地理学综合研究的途径与方法: 格局与过程耦合[J]. 地理学报, 2014,69(8):1052-1059.
[
|
| [33] |
刘春腊, 黄嘉钦, 龚娟, 等. 中国精准扶贫的省域差异及影响因素[J]. 地理科学, 2018,38(7):1098-1106.
[
|
| [34] |
彭继增, 陶旭辉, 徐丽. 我国数字化贫困地理集聚特征及时空演化机制[J]. 经济地理, 2019,39(2):169-179.
[
|
| [35] |
赵雪雁, 马艳艳, 陈欢欢, 等. 农村多维贫困的时空格局及影响因素: 以石羊河流域为例[J]. 经济地理, 2018,38(2):140-147.
[
|
| [36] |
马蓓蓓, 李海玲, 魏也华, 等. 西安市贫困空间结构特征与发生机理[J]. 地理学报, 2018,73(6):1018-1032.
[
|
| [37] |
刘新梅, 韩林芝, 郑江华, 等. 贫困县多维综合贫困度时空分异特征及其驱动机制: 以南疆四地州深度贫困地区贫困县为例[J]. 经济地理, 2019,39(7):165-174.
[
|
| [38] |
|
| [39] |
|
| [40] |
王武林, 杨文越, 曹小曙. 中国集中连片特困地区公路交通优势度及其对经济增长的影响[J]. 地理科学进展, 2015,34(6):665-675.
[
|
| [41] |
|
| [42] |
桑秋, 张平宇, 高晓娜, 等. 辽中城市群县域综合发展水平差异的时空特征分析[J]. 地理科学, 2008,28(2):150-155.
[
|
| [43] |
孟德友, 沈惊宏, 陆玉麒. 中原经济区县域交通优势度与区域经济空间耦合[J]. 经济地理, 2012,32(6):7-14.
[
|
| [44] |
王艳慧, 钱乐毅, 陈烨烽, 等. 生态贫困视角下的贫困县多维贫困综合度量[J]. 应用生态学报, 2017,28(8):2677-2686.
[
|
| [45] |
于淑会, 李璐丹, 曹萌萌, 等. 太行山区农村多维贫困测度: 以平山县北冶乡为例[J]. 中国生态农业学报, 2019,27(9):1453-1462.
[
|
| [46] |
杜国明, 冯悦, 于佳兴. 典型深度贫困县贫困格局及影响因素分析: 以海伦市为例[J]. 地理科学进展, 2020,39(1):69-77.
[
|
/
| 〈 |
|
〉 |