
Population distribution and industrial evolution of the Tokyo Metropolitan Area
Received date: 2019-11-04
Request revised date: 2020-02-20
Online published: 2020-11-28
Supported by
National Natural Science Foundation of China(41271132)
Program of Collaborative Innovation Center for Geopolitical Setting of Southwest China and Borderland Development
Copyright
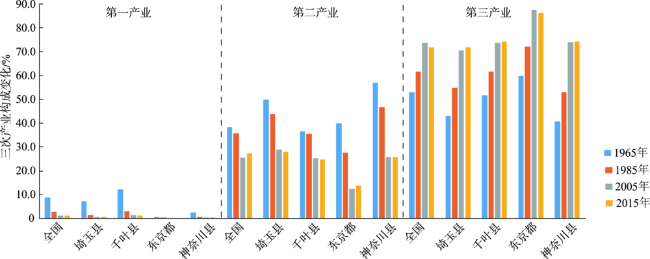
As a spatial organization form of urban functional area, metropolitan area is the product of urbanization at a certain stage. Taking the Tokyo Metropolitan Area as a case study area and based on the index of densely inhabited district (DID), population net immigration rate, and industrial location quotient and spatial Gini coefficient, this study systematically reviewed the evolution of population distribution, population migration patterns, industrial structure transformation, and spatial reorganization since the 1960s in the region. The conclusions are as follows: First, the population distribution in the Tokyo Metropolitan Area has gradually changed from "isolated concentration" to "spreading diffusion", but the core radiation range is still within the radius of 50 km. According to the index of DID, the metropolitan area of Tokyo is characterized by large-scale and high-density population concentration, and the trend of concentration continues to be strong. Second, population inflow of three metropolitan areas in Japan changed from simultaneous growth to differentiation, and the Tokyo Metropolitan Area has always shown a strong trend of population agglomeration, with characteristics of unipolar concentration. Internally, suburbanization has basically ended, and a return to the centers is obvious. Third, the proportion of tertiary industry continues to rise, the proportion of secondary industry declines significantly, and the primary industry gradually shrinks. Although the proportion of the secondary industry has gradually declined, its status as an important production area of the national economy has not changed. Finally, from the center to the periphery, the tertiary industry, the secondary industry, and the primary industry are distributed in turn. The industrial structure adjustment and spatial reorganization in the metropolitan area happened at the same time and from the center to the periphery the value chain of industries changes from high to low. The advanced producer services and urban industries are concentrated in central areas, while technology-intensive heavy industries are located in peripheral areas.
CHEN Hongyan , LUO Huasong , SONG Jinping . Population distribution and industrial evolution of the Tokyo Metropolitan Area[J]. PROGRESS IN GEOGRAPHY, 2020 , 39(9) : 1498 -1511 . DOI: 10.18306/dlkxjz.2020.09.007
表1 1960年以来主要普查年份日本3大都市圈人口规模及占全国比重变化Tab.1 Population size and proportion of three metropolitan areas in Japan since 1960 |
| 都市圈 | 指标 | 1960年 | 1970年 | 1980年 | 1990年 | 2000年 | 2010年 | 2015年 |
|---|---|---|---|---|---|---|---|---|
| 东京都市圈 | 规模/万人 | 1786.4 | 2411.3 | 2869.7 | 3179.6 | 3341.8 | 3561.8 | 3613.1 |
| 占比/% | 18.9 | 23.0 | 24.5 | 25.7 | 26.3 | 27.8 | 28.4 | |
| 3大都市圈 | 规模/万人 | 3737.9 | 4827.0 | 5592.2 | 6046.4 | 6287.2 | 6545.5 | 6581.1 |
| 占比/% | 39.6 | 46.1 | 47.8 | 48.9 | 49.5 | 51.1 | 51.8 |
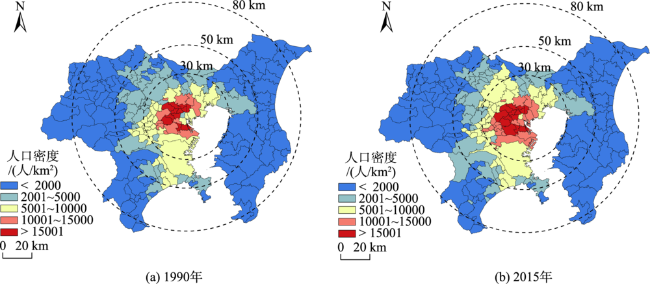
图2 1990年和2015年东京都市圈人口密度空间分布Fig.2 Spatial distribution of population density in the Tokyo Metropolitan Area, 1990 and 2015 |
表2 1960—2015年主要普查年份东京都市圈人口规模分布变化Tab.2 Population size change of the Tokyo Metropolitan Area, 1960-2015 |
| 空间范围 | 1960年 | 1970年 | 1980年 | 1990年 | 2000年 | 2010年 | 2015年 | |
|---|---|---|---|---|---|---|---|---|
| 都市圈总人口/万人 | 1786.4 | 2411.3 | 2869.7 | 3179.6 | 3341.8 | 3561.8 | 3613.1 | |
| 50 km半径 | 规模/万人 | 1578.8 | 2195.3 | 2634.3 | 2920.0 | 3072.4 | 3271.4 | 3333.5 |
| 占比/% | 88.4 | 91.0 | 91.8 | 91.8 | 91.9 | 91.8 | 92.3 | |
表3 1960—2015年普查年份东京都市圈DID人口规模及比重变化Tab.3 Population size and proportion changes of DID in the Tokyo Metropolitan Area, 1960-2015 |
| 年份 | 东京都 | 埼玉县 | 千叶县 | 神奈川县 | 东京都市圈 | |||||||||
|---|---|---|---|---|---|---|---|---|---|---|---|---|---|---|
| 规模/万人 | 占比/% | 规模/万人 | 占比/% | 规模/万人 | 占比/% | 规模/万人 | 占比/% | 规模/万人 | 占比/% | |||||
| 1960 | 890.8 | 92.0 | 89.6 | 36.9 | 66.3 | 28.7 | 241.1 | 70.0 | 1287.8 | 72.1 | ||||
| 1965 | 1009.9 | 92.9 | 132.0 | 43.8 | 105.3 | 39.0 | 317.5 | 71.6 | 1564.7 | 74.5 | ||||
| 1970 | 1087.6 | 95.3 | 212.6 | 55.0 | 170.6 | 50.7 | 429.0 | 78.4 | 1899.8 | 78.8 | ||||
| 1975 | 1127.9 | 96.6 | 311.3 | 64.6 | 239.4 | 57.7 | 540.1 | 84.4 | 2218.6 | 82.0 | ||||
| 1980 | 1129.4 | 97.2 | 378.1 | 69.8 | 295.2 | 62.3 | 610.9 | 88.2 | 2413.7 | 84.1 | ||||
| 1985 | 1148.3 | 97.1 | 420.5 | 71.7 | 334.4 | 65.0 | 662.3 | 89.1 | 2565.5 | 84.7 | ||||
| 1990 | 1159.1 | 97.8 | 487.3 | 76.1 | 384.1 | 69.1 | 730.7 | 91.6 | 2761.3 | 86.8 | ||||
| 1995 | 1152.7 | 97.9 | 525.2 | 77.7 | 408.1 | 70.4 | 769.0 | 93.3 | 2854.9 | 87.6 | ||||
| 2000 | 1182.1 | 98.0 | 542.6 | 78.2 | 419.7 | 70.8 | 794.9 | 93.6 | 2939.3 | 88.0 | ||||
| 2005 | 1232.9 | 98.0 | 556.6 | 78.9 | 434.2 | 71.7 | 825.0 | 93.8 | 3048.8 | 88.4 | ||||
| 2010 | 1291.7 | 98.2 | 573.0 | 79.6 | 452.9 | 72.9 | 852.2 | 94.2 | 3169.8 | 89.0 | ||||
| 2015 | 1329.5 | 98.4 | 582.8 | 80.2 | 462.2 | 74.3 | 861.6 | 94.4 | 3236.1 | 89.6 | ||||
表4 2006年和2015年东京都市圈及东京都各行业产值区位商分布Tab.4 Industrial location quotient of the Tokyo Metropolitan Area and Tokyo, 2006 and 2015 |
| 行业分类 | 东京都市圈 | 东京都 | ||
|---|---|---|---|---|
| 2006年 | 2015年 | 2006年 | 2015年 | |
| 农林水产业 | 0.2 | 0.2 | 0 | 0 |
| 矿业 | 0.5 | 0.7 | 0.6 | 0.8 |
| 制造业 | 0.7 | 0.6 | 0.4 | 0.4 |
| 电气、煤气、自来水、 废料处理业 | 0.8 | 0.9 | 0.5 | 0.6 |
| 建筑业 | 0.9 | 0.9 | 0.9 | 0.9 |
| 批发零售业 | 1.3 | 1.2 | 1.7 | 1.6 |
| 运输、邮政业 | 1.0 | 1.0 | 0.9 | 0.9 |
| 住宿、饮食服务业 | 0.9 | 1.0 | 0.8 | 1.0 |
| 信息通信业 | 1.6 | 1.6 | 2.2 | 2.2 |
| 金融保险业 | 1.4 | 1.4 | 1.9 | 1.9 |
| 不动产业 | 1.1 | 1.1 | 0.9 | 1.0 |
| 学术研究、专业技术服务业 | 1.2 | 1.3 | 1.4 | 1.6 |
| 公务 | 0.9 | 0.9 | 0.9 | 0.8 |
| 教育 | 0.8 | 0.8 | 0.7 | 0.8 |
| 保健卫生、社会事业 | 0.7 | 0.8 | 0.5 | 0.5 |
| 其他产业 | 1.0 | 1.0 | 0.8 | 1.0 |
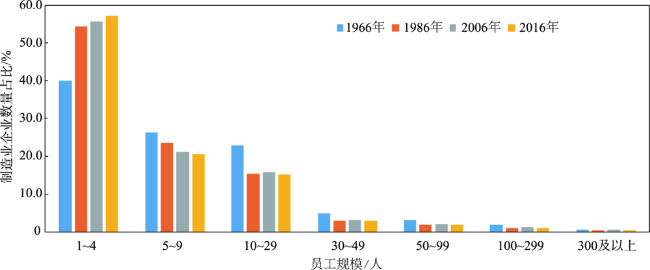
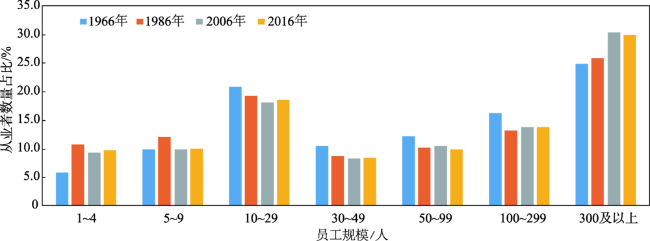
图9 1966、1986、2006、2016年东京都分员工规模的制造业企业数量占比Fig.9 Proportion of manufacturing enterprises in Tokyo by the number of employees, 1966, 1986, 2006, and 2016 |
| [1] |
张京祥, 邹军, 吴启焰, 等. 论都市圈地域空间的组织[J]. 城市规划, 2001(5):19-23.
[
|
| [2] |
李国平, 等. 首都圈: 结构、分工与营建战略 [M]. 北京: 中国城市出版社, 2004: 1-8.
[
|
| [3] |
王丽, 邓羽, 牛文元. 城市群的界定与识别研究[J]. 地理学报, 2013,68(8):1059-1070.
[
|
| [4] |
胡序威. 应厘清与城镇化有关的各种地域空间概念[J]. 城市发展研究, 2014,21(11):1-4.
[
|
| [5] |
方创琳. 城市群空间范围识别标准的研究进展与基本判断[J]. 城市规划学刊, 2009(3):1-5.
[
|
| [6] |
宁越敏. 中国都市区和大城市群的界定: 兼论大城市群在区域经济发展中的作用[J]. 地理科学, 2011,31(3):257-263.
[
|
| [7] |
陈守强, 黄金川. 城市群空间发育范围识别方法综述[J]. 地理科学进展, 2015,34(3):313-320.
[
|
| [8] |
陈群元, 宋玉祥, 喻定权. 城市群发展阶段的划分与评判: 以长株潭和泛长株潭城市群为例[J]. 长江流域资源与环境, 2009,18(4):301-306.
[
|
| [9] |
王婧, 方创琳. 中国城市群发育的新型驱动力研究[J]. 地理研究, 2011,30(2):335-347.
[
|
| [10] |
孙斌栋, 华杰媛, 李琬, 等. 中国城市群空间结构的演化与影响因素: 基于人口分布的形态单中心—多中心视角[J]. 地理科学进展, 2017,36(10):1294-1303.
[
|
| [11] |
孙铁山, 王兰兰, 李国平. 北京都市区人口—就业分布与空间结构演化[J]. 地理学报, 2012,67(6):829-840.
[
|
| [12] |
钮心毅, 王垚, 刘嘉伟. 基于跨城功能联系的上海都市圈空间结构研究[J]. 城市规划学刊, 2018(5):80-87.
[
|
| [13] |
陶希东. 跨省区域治理: 中国跨省都市圈经济整合的新思路[J]. 地理科学, 2005,25(5):19-26.
[
|
| [14] |
耿云. 新区域主义视角下的京津冀都市圈治理结构研究[J]. 城市发展研究, 2015,22(8):15-20.
[
|
| [15] |
刘玉亭, 王勇, 吴丽娟. 城市群概念、形成机制及其未来研究方向评述[J]. 人文地理, 2013,28(1):62-68.
[
|
| [16] |
陈美玲. 城市群相关概念的研究探讨[J]. 城市发展研究, 2011,18(3):135-138.
[
|
| [17] |
姚士谋, 陈振光, 朱英明, 等. 中国城市群 [M]. 4版. 合肥: 中国科技大学出版社, 2008.
[
|
| [18] |
周一星. 城市地理学 [M]. 北京: 商务印书馆, 2007.
[
|
| [19] |
方创琳. 中国城市群研究取得的重要进展与未来发展方向[J]. 地理学报, 2014,69(8):1130-1144.
[
|
| [20] |
顾朝林. 城市群研究进展与展望[J]. 地理研究, 2011,30(5):771-784.
[
|
| [21] |
陆军, 宋吉涛, 汪文姝. 世界城市的人口分布格局研究: 以纽约、东京、伦敦为例[J]. 世界地理研究, 2010,19(1):28-35.
[
|
| [22] |
王桂新, 王丽. 国外大城市人口发展特征及其对上海市的启示[J]. 中国人口科学, 2005,19(S1):48-57.
[
|
| [23] |
日野正辉, 刘云刚. 1990年代以来日本大都市圈的结构变化[J]. 地理科学, 2011,31(3):302-308.
[
|
| [24] |
焦利民, 龚晨, 许刚, 等. 大都市区城市扩张过程及形态对比分析: 以东京、纽约和上海为例[J]. 地理科学进展, 2019,38(5):675-685.
[
|
| [25] |
|
| [26] |
日本总务省统计局. 国势调查统计地图: 人口集中地区[M]. 东京: 日本总务省统计局, 2015.
[ Statistical Bureau of Japan. Population census map: Densely inhabited district. Tokyo, Japan: Statistical Bureau of Japan, 2015. ]
|
| [27] |
|
| [28] |
黄曦颖, 周君. 东京的人口调控经验及对我国特大城市发展的启示[J]. 区域经济评论, 2019(3):103-110.
[
|
| [29] |
藤田直晴, 李国庆. 东京大都市圈的产业结构转换和地区重组 [M]. 北京: 社会科学出版社, 2018.
[
|
/
| 〈 |
|
〉 |