
Estimation of time delay cost of hub airports in China, air routes effect and comparison with the United States
Received date: 2019-05-30
Request revised date: 2019-09-24
Online published: 2020-09-28
Supported by
National Natural Science Foundation of China(41671121)
Copyright
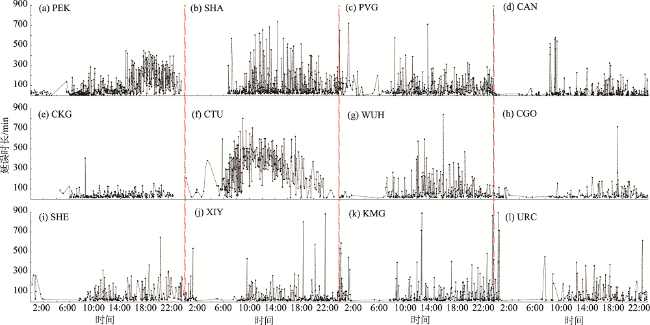
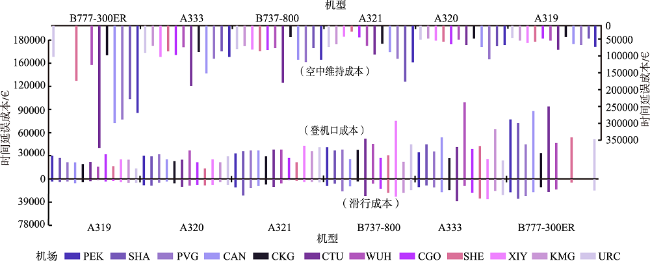
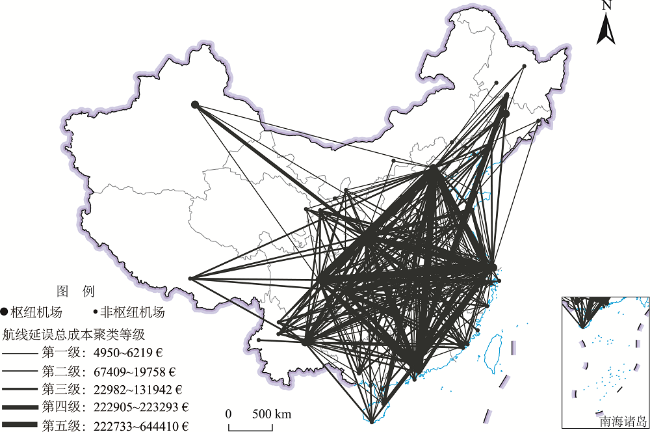
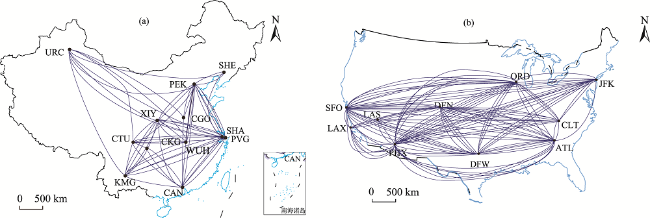
Based on the European Control (EC) estimation model and using aircraft configuration ratio and flight stages as impact parameters, this study estimated the time delay cost and the total time delay cost of Chinese hub airports in 24 hours with the improved EC estimation model. Then the air routes effect of time delay cost was analyzed and a comparison with the United States was carried out. The conclusions are as follows: 1) Time delay cost of the compound hub airports is generally higher than that of the regional hub airports while per minute delay cost and gating cost of regional hub airports are higher. This is caused by the centrality of the network structure of air routes, the need of aero geographic market, and the influence on the transmission efficiency of the aviation network in China. The air maintenance cost of hub airports accounts for the largest proportion of the total cost of time delay, which indicates that there are defects in the configuration of air corridors in China. 2) The spatial heterogeneity of the total cost of time delay between hub airports (air routes) and hub airport to non-hub airport (air routes) is caused by air route attributes, which are determined by the joint action of geographic market demand and the location of participating airports in air-corridors in the sky. The specific performance is affected by the difference of clustering levels: the hub and non-hub airports (air routes) generally exist in the low level, and the hub airports (air routes) basically exist in the high level. There is a significant difference in the total cost of time delay between the compound hub airports and the regional hub airports. The three routes in the fifth level clustering connect PEK, SHA, CAN, which is dominated by the aero geographic market, and the total cost of time delay accounts for 9.22% of the total cost of all routes in 24 hours. Among the total cost of time delay between hub airport and non-hub airport (air routes), PEK-SZX is the highest, followed by SHA-NKG. 3) The difference in time delay cost of hub airports and air routes between China and the United States is mainly manifested in the different proportion of the flight stages, which is determined by the width of characteristic path and the number of track intersections in air corridors in the sky.
Key words: time delay cost; hub airports; EC estimation model; air corridors; China
DU Xinru , LU Zi , LI Renjie , DONG Yaqing , GAO Wei . Estimation of time delay cost of hub airports in China, air routes effect and comparison with the United States[J]. PROGRESS IN GEOGRAPHY, 2020 , 39(7) : 1160 -1171 . DOI: 10.18306/dlkxjz.2020.07.009
表1 中国枢纽机场6种机型配置比及3个航班执行阶段单位时长延误成本Tab.1 Time delay cost per minute for six aircraft types and three flight stages in hub airports of China |
| 机型/座位容量 (成本标准值/(€/min))* | A319/122 (0.6/2.6/7.1) | A320/158 (0.6/2.6/7.7) | A321/185 (0.7/3.0/9.5) | B737-800/162 (0.5/2.9/7.8) | A333/370 (1.8/4.5/27.6) | B777-300ER/300 (0.6/10.6/14.2) | |
|---|---|---|---|---|---|---|---|
| PEK | 配置比/% 延误成本/(€/min) | 2.93 0.12/0.47/1.26 | 17.59 0.70/2.81/8.09 | 23.28 0.93/4.19/13.27 | 23.62 0.71/4.02/11.10 | 20.34 2.24/13.02/33.76 | 12.24 0.49/3.30/10.40 |
| SHA | 配置比/% 延误成本/(€/min) | 1.09 0.04/0.17/0.47 | 21.68 0.87/3.47/9.98 | 21.68 0.87/3.90/12.36 | 39.78 1.19/6.76/18.70 | 12.48 1.37/7.99/20.72 | 3.28 0.13/0.88/2.78 |
| PVG | 配置比/% 延误成本/(€/min) | 3.47 0.14/0.55/1.49 | 30.11 1.20/4.82/13.85 | 24.09 0.96/4.34/13.73 | 25.36 0.76/4.31/11.92 | 6.20 0.68/3.97/10.30 | 10.77 0.43/2.91/9.15 |
| CAN | 配置比/% 延误成本/(€/min) | 6.13 0.25/0.98/2.64 | 23.24 (0.93/3.72/10.69 | 15.63 0.63/2.81/8.91 | 43.03 1.29/7.31/20.22 | 7.12 0.78/4.56/11.82 | 4.85 0.19/1.31/4.12 |
| CKG | 配置比/% 延误成本/(€/min) | 19.12 0.76/3.06/8.22 | 51.39 2.06/8.22/23.64 | 13.94 0.56/2.51/7.95 | 13.94 0.42/2.37/6.55 | 1.2 0.13/0.76/1.98 | 0.40 0.02/0.11/0.34 |
| CTU | 配置比/% 延误成本/(€/min) | 14.77 0.59/2.36/6.35 | 33.86 1.35/5.42/15.57 | 24.58 0.98/4.42/14.01 | 19.87 0.60/3.38/9.34 | 6.67 0.73/4.27/11.07 | 0.26 0.01/0.07/0.22 |
| WUH | 配置比/% 延误成本/(€/min) | 4.55 0.18/0.73/1.95 | 21.21 0.85/3.39/9.76 | 6.44 0.26/1.16/3.67 | 66.29 1.99/11.27/31.16 | 0.76 0.08/0.48/1.26 | 0.76 0.03/0.20/0.64 |
| CGO | 配置比/% 延误成本/(€/min) | 2.16 0.09/0.35/0.93 | 23.74 0.95/3.80/10.92 | 3.24 0.13/0.58/1.85 | 70.50 2.12/11.99/33.14 | 0.36 0.04/0.23/0.60 | 0 0/0/0 |
| SHE | 配置比/% 延误成本/(€/min) | 4.33 0.17/0.69/1.86 | 47.99 1.92/7.86/22.07 | 14.86 0.59/2.67/8.47 | 31.58 0.95/5.37/14.84 | 0.62 0.07/0.40/1.03 | 0.62 0.02/0.17/0.53 |
| XIY | 配置比/% 延误成本/(€/min) | 10.03 0.40/1.61/4.31 | 38.19 1.53/6.11/17.57 | 15.86 0.63/2.85/9.04 | 34.95 1.05/5.94/16.43 | 0.97 0.11/0.62/1.61 | 0 0/0/0 |
| KMG | 配置比/% 延误成本/(€/min) | 5.99 0.24/0.96/2.58 | 26.65 1.07/4.26/12.26 | 3.31 0.13/0.60/1.88 | 62.40 1.87/10.61/29.33 | 1.65 0.18/1.06/2.74 | 0 0/0/0 |
| URC | 配置比/% 延误成本/(€/min) | 19.71 0.79/3.16/8.50 | 24.42 0.98/3.91/11.23 | 15.12 0.60/2.72/8.62 | 37.21 1.12/6.33/17.49 | 2.33 0.26/1.49/3.86 | 1.16 0.05/0.31/0.99 |
注:*为EC估算模型标准值,来自参考文献[12];A333参考了B747-400(406座)的延误成本方案。 |
表2 中美复合枢纽机场6种机型3个航班执行阶段单位时长延误成本和首位联系强度比较Tab.2 Comparison of time delay cost per minute for six aircraft types and three flight stages in hub airports between China and the United States and degree of association intensity |
| 比较内容 | 美国 | 中国 | ||||||
|---|---|---|---|---|---|---|---|---|
| 机型/机场 | 单位时长延误成本/(€/min) | 机型/机场 | 单位时长延误成本/(€/min) | |||||
| 登机口 | 滑行 | 空中维持 | 登机口 | 滑行 | 空中维持 | |||
| 机型 | A319 | 0.6 | 2.6 | 7.1 | A319 | 0.3 | 1.3 | 3.4 |
| A320 | 0.6 | 2.6 | 7.7 | A320 | 1.2 | 4.8 | 13.8 | |
| A321 | 0.7 | 3.0 | 9.5 | A321 | 0.6 | 3.2 | 8.4 | |
| B737-800 | 0.5 | 2.9 | 7.9 | B737-800 | 1.2 | 6.6 | 18.4 | |
| A333 | 1.9 | 4.62 | 27.8 | A333 | 0.6 | 2.8 | 8.7 | |
| B777-300ER | 0.6 | 10.6 | 14.3 | B777-300ER | 0.1 | 0.8 | 14.3 | |
| 复合枢纽机场 | ATL | 179.6 | 176.8 | 55.9 | PEK | 71.9 | 280.1 | 424.7 |
| PHL | 117.0 | 77.4 | 66.8 | CAN | 77.2 | 253.8 | 357.4 | |
| JFK | 201.6 | 98.1 | 88.6 | SHA | 66.9 | 146.2 | 291.4 | |
| ORD | 118.4 | 132.4 | 104.3 | PVG | 76.3 | 112.9 | 310.5 | |
| 机场首位联系强度 | ATL | CLT(19)、JFK(11)、PHL(21)、DFW(21)、ORD(25)、DEN(20)/16.58%* | PEK | SHA(59)、PVG(20)、CAN(42)、WHU(15)、CTU(33)、XIY(43)、SHE(23)、URC(18)/32.4% | ||||
| PHL | JFK(7)、ORD(16)、DEN(10)、LAS(6)、LAX(9)、SFO(8)/11.56% | CAN | SHA(60)、PVG(25)、WUH(23)、CTU(60)、KMG(18)、CKG(25)、URC(21)、XIY(2)、SHE(12)/25.6% | |||||
| JFK | DFW(6)、ORD(9)、ATL(10)、LAX(37)/7.72% | SHA | CTU(38)、KMG(15)、CGO(4)、WUH(79)、CKG(18)、SHE(43)、URC(16)/14.72% | |||||
| ORD | CLT(15)、DFW(26)、ORD(2)、PHX(12)/7.51% | PVG | KMG(15)、WUH(21)、XIY(36)、URC(3)/6.17% | |||||
注:美国6种机型单位时长延误成本引自参考文献[12];美国时间延误成本前四位枢纽机场分别为ATL(亚特兰大机场)、PHL(费城机场)、JFK(纽约肯尼迪机场)、ORD(芝加哥奥黑尔机场),联系机场分别为CLT(夏洛特机场)、DFW(达拉斯机场)、DEN(丹佛机场)、LAX(洛杉矶机场)、SFO(旧金山机场);*为联系机场(数量)/占比。 |
表3 中美前10位枢纽机场间(航线)3个航班执行阶段时间延误总成本比较Tab.3 Comparison of time delay cost for six aircraft types and three flight stages in the top 10 hub airports between China and the United States (€) |
| 美国 | 中国 | ||||||||
|---|---|---|---|---|---|---|---|---|---|
| 航线 | 时间延误成本 | 航线 | 时间延误成本 | ||||||
| 登机口 | 滑行 | 空中维持 | 总计 | 登机口 | 滑行 | 空中维持 | 总计 | ||
| DEN-CLT | 14499 | 71972 | 76086 | 162557 | PEK-KMG | 16547 | 62979 | 169572 | 249098 |
| LAX-JFK | 43668 | 167542 | 156062 | 267272 | PEK-SHA | 29592 | 34487 | 173140 | 337219 |
| SFO-DEN | 22719 | 52593 | 31354 | 106666 | PEK-CAN | 17641 | 68828 | 241567 | 328036 |
| ATL-DFW | 50207 | 70232 | 27704 | 148143 | PEK-CTU | 24352 | 59329 | 248979 | 332660 |
| CLT-ORD | 30354 | 111835 | 187679 | 229868 | PEK-XIY | 47983 | 41140 | 133639 | 222762 |
| JFK-CLT | 23588 | 265200 | 45255 | 334043 | CTU-CAN | 21095 | 29069 | 201833 | 251997 |
| JFK-SFO | 27699 | 125408 | 156253 | 309360 | CTU-SHA | 40611 | 56130 | 145523 | 242264 |
| ATL-DEN | 55128 | 145523 | 6169 | 206820 | CTU-WUH | 29554 | 55115 | 75821 | 160490 |
| ATL-PHL | 35457 | 174688 | 35380 | 245525 | KMG-XIY | 11007 | 14764 | 181690 | 207461 |
| LAX-ORD | 11536 | 11823 | 17632 | 130991 | CAN-SHA | 28323 | 44707 | 91317 | 164347 |
| [1] |
|
| [2] |
|
| [3] |
|
| [4] |
|
| [5] |
|
| [6] |
|
| [7] |
|
| [8] |
|
| [9] |
|
| [10] |
杨秀云, 王全良, 何建宝. 航班延误问题的研究动态, 演化趋势及启示[J]. 经济经纬, 2013,30(4):76-82.
[
|
| [11] |
|
| [12] |
|
| [13] |
|
| [14] |
|
| [15] |
|
| [16] |
|
| [17] |
|
| [18] |
|
| [19] |
|
| [20] |
|
| [21] |
莫辉辉, 金凤君, 刘毅, 等. 机场体系中心性的网络分析方法与实证[J]. 地理科学, 2010,30(2):204-212.
[
|
| [22] |
丁金学, 金凤君, 王成金, 等. 中国交通枢纽空间布局的评价、优化与模拟[J]. 地理学报, 2011,66(4):504-514.
[
|
| [23] |
曹小曙, 廖望. 全球多机场区域空间格局与类型划分[J]. 地理科学进展, 2018,37(11):1473-1484.
[
|
| [24] |
王姣娥, 景悦. 中国城市网络等级结构特征及组织模式: 基于铁路和航空流的比较[J]. 地理学报, 2017,72(8):1508-1519.
[
|
| [25] |
乐美龙, 李星灿, 高金敏. 机场到达时刻数量决策随机模型[J]. 系统工程理论与实践, 2017,37(11):2948-2954.
[
|
| [26] |
|
| [27] |
|
| [28] |
|
| [29] |
|
| [30] |
|
| [31] |
|
| [32] |
|
| [33] |
|
| [34] |
|
| [35] |
|
| [36] |
|
| [37] |
|
| [38] |
董雅晴, 路紫, 刘媛, 等. 中国空中廊道划设与时空拥堵识别及其航线流量影响[J]. 地理学报, 2018,73(10):2001-2013.
[
|
| [39] |
|
| [40] |
|
| [41] |
|
| [42] |
路紫, 杜欣儒. 国外空域资源开发利用的理论基础、方法论变革与实践[J]. 地球科学进展, 2015,30(11):1260-1267.
[
|
| [43] |
王姣娥, 莫辉辉. 航空运输地理学研究进展与展望[J]. 地理科学进展, 2011,30(6):670-680.
[
|
| [44] |
叶倩, 吴殿廷, 戴特奇, 等. 中美航空客运网络层次结构和地域系统对比分析[J]. 地理研究, 2013,32(6):1084-1094.
[
|
| [45] |
徐敏政, 许珺, 陈娱. 基于最多叶子生成树的中国航空网络轴辐结构构建[J]. 地理学报, 2014,69(12):1847-1857.
[
|
| [46] |
吴文婕, 张小雷, 杨兆萍, 等. 乌鲁木齐国际机场时刻资源与航线布局的时空网络模式分析[J]. 干旱区地理, 2015,38(6):1290-1299.
[
|
| [47] |
|
/
| 〈 |
|
〉 |
