
Spatial difference of multidimensional poverty and its influencing factors in the rural areas of Hainan Province
Received date: 2020-01-08
Request revised date: 2020-05-09
Online published: 2020-08-28
Supported by
National Natural Science Foundation of China(41661028)
National Natural Science Foundation of China(41761118)
Natural Science Foundation of Hainan Province(417099)
Natural Science Foundation of Hainan Province(418MS052)
High-level Talent Project of Natural Science Foundation of Hainan Province(2019RC178)
Innovative Research Project for Postgraduates of Hainan Province in 2019(Hys2019-240)
Copyright
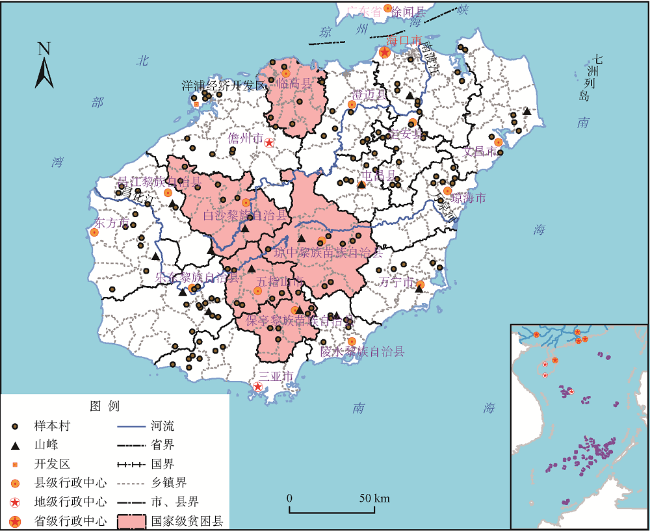
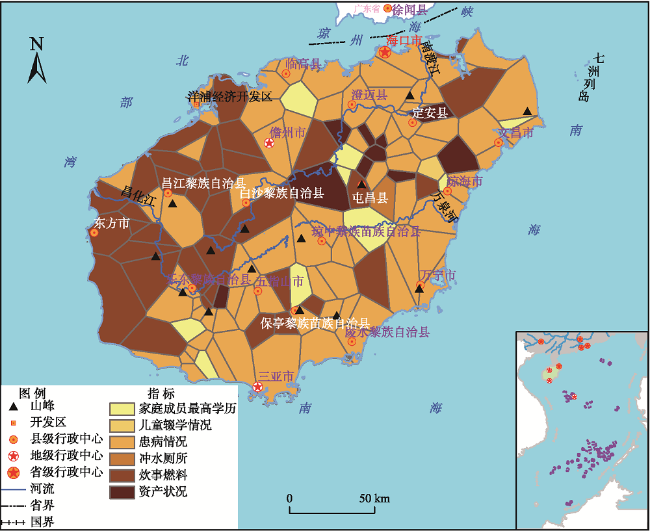
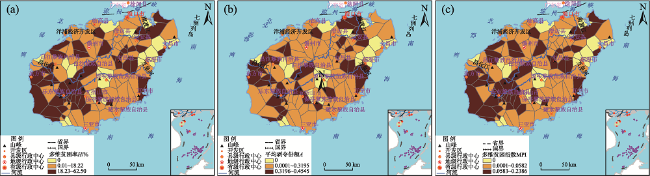
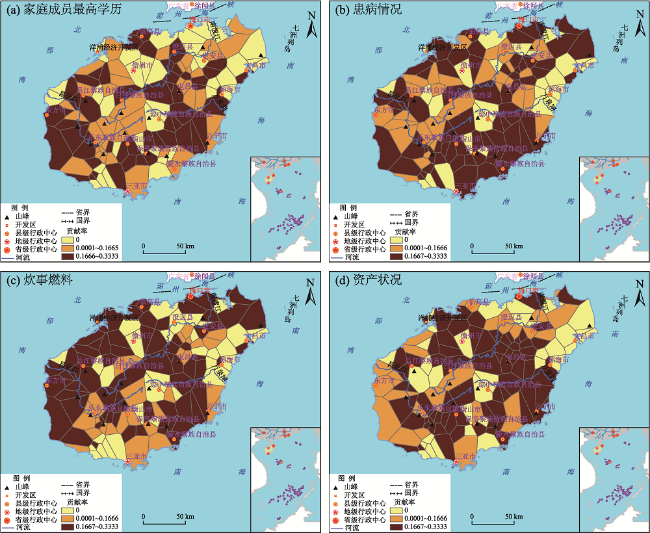
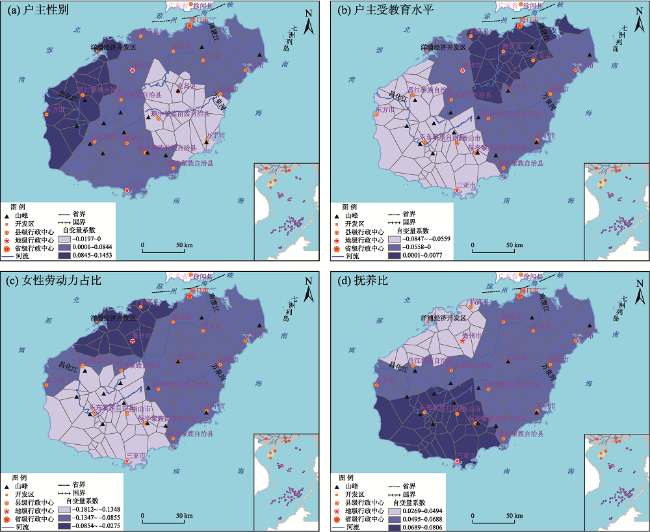
Poverty has multidimensional attributes, and it has become a consensus to study poverty from a multidimensional perspective according to different social groups and backgrounds. In order to measure the multidimensional poverty situation in the rural areas where the poor population is concentrated in Hainan Province, we expanded the index system based on the exit criteria for targeted poverty alleviation fulfilling the basic needs of food and clothing and guaranteeing compulsory education, basic medical care, and housing, and established a multidimensional poverty assessment conceptual model for rural households in Hainan Province that covers education, health, housing, livelihood, and income indicators. Then, based on household survey data from 3924 households in 70 towns and 134 poor villages of Hainan Province in 2018, we used the double threshold Alkire-Foster (A-F) method to evaluate the multidimensional poverty status of rural households and villages, and then used the geographically weighted regression (GWR) model to analyze the spatial heterogeneity of the influencing factors of multidimensional poverty in villages. The study results show that: 1) The incidence of multidimensional poverty of the surveyed households was 18.22%. But the incidence of multidimensional poverty in villages with severe multidimensional poverty is not necessarily high. 2) The four indicators of farming households' asset status, cooking fuels, family members' diseases, and family members’ highest academic qualifications contribute the most to multidimensional poverty, while the contribution ratio of indicators belonging to the standard of fulfilling basic needs of food and clothing and guaranteeing compulsory education, basic medical care, and housing, as well as income are generally not high. The multidimensional poverty in the contiguous poverty areas in the central and western regions of the province is mainly manifested by poor asset conditions, unclean cooking fuels, high prevalence of disease of family members, and lower education levels. 3) The GWR model analysis showed that as the most important influencing factors of multidimensional poverty, spatial heterogeneity of the estimated coefficients of the four variables, gender of the household head, education level of the household head, ratio of female labor force, and dependency ratio, have very obvious impacts. In general, areas with more female-headed and low-education attainment individual headed households tend to be more prone to multidimensional poverty, and their impacts increased from east to west and from north to south, separately. With an increasing trend from north to south, the effect of the proportion of female labor force is negative and that of the dependency ratio is positive, which reflects the typical regional characteristics of weak labor force and relatively more industrious women in Hainan poverty-stricken areas.
ZHANG Jinping , LIN Dan , ZHOU Xiangli , YU Zhenxin , SONG Wei , CHENG Yeqing . Spatial difference of multidimensional poverty and its influencing factors in the rural areas of Hainan Province[J]. PROGRESS IN GEOGRAPHY, 2020 , 39(6) : 1013 -1023 . DOI: 10.18306/dlkxjz.2020.06.011
表1 海南省农户多维贫困测度的指标体系Tab.1 Index system of multidimensional poverty measurement for rural households in Hainan Province |
| 子系统 | 指标 | 剥夺临界值Z | 指标描述 |
|---|---|---|---|
| 教育 | 家庭成员最高学历 | 1 | 初中以下赋值为1,初中及以上为0 |
| 儿童就学情况* | 1 | 家中义务教育阶段辍学儿童≥1赋值为1,否则为0 | |
| 健康 | 购买新农合保险情况* | 1 | 家庭成员中未购买人数≥1赋值为1,否则为0 |
| 患病情况 | 1 | 家中大病或长期慢性病患者或残疾人≥1赋值为1,否则为0 | |
| 居住 | 安全住房* | 1 | 居住在危房中或无住房或人均住房面积<10 m2赋值为1,否则为0 |
| 生活 | 营养状况* | 1 | 缺口粮或每月吃蛋白质食品≤1次赋值为1,否则为0 |
| 穿衣状况* | 1 | 无应季换洗衣服、被褥、鞋赋值为1,否则为0 | |
| 冲水厕所 | 1 | 家中没有冲水厕所赋值为1,否则为0 | |
| 炊事燃料 | 1 | 使用畜禽粪便或柴草、木炭等薪柴等非清洁能源赋值为1,否则为0 | |
| 资产状况 | 1 | 拥有冰箱、电视机、空调、电热水器、电磁炉、洗衣机、电脑、电饭锅、电话等家用电器数量≤1或自行车、电动车、摩托车、小汽车等交通工具数量<1赋值为1,否则为0 | |
| 收入 | 家庭年人均纯收入* | 3523 | ≤3523元赋值为1,否则为0 |
注:2018年海南省扶贫标准线为农村家庭年人均纯收入3523元;带*的为精准扶贫重点关注的“两不愁、三保障”及收入指标。 |
表2 多维贫困测算的变量及方法Tab.2 Variables and methods of multidimensional poverty measurement |
| 变量 | 计算方法 |
|---|---|
| 剥夺临界值Z | 各指标的贫困标准zj,j=1, 2, …, d,其中d为指标数量 |
| 加权剥夺矩阵Gw | gij(i=1, 2, … , n; j=1, 2, … , d)表示第i个农户在第j指标上是否被剥夺,如果第i个农户的第j个指标的观测值低于zj则赋值为1,否则赋值为0;加权后的剥夺矩阵为Gw,wj为第j个指标的权重, |
| 被剥夺指标数k | k表示农户贫困维度总数,1≤k≤d,k的取值一般介于2~d之间 |
| 多维贫困剥夺矩阵C | (k=1, 2, 3, …, d) |
| 多维贫困个体剥夺矩阵Q | |
| 多维贫困率H(k) | ,n为研究区域农户总数 |
| 平均剥夺份额A(k) | |
| 多维贫困指数MPI(k) | MPI(k)表示研究区域多维贫困状况,MPI(k)=H(k)×A(k) |
| 指标贡献率λj(k) | ,其中m表示第k维贫困情况下被剥夺的农户数量 |
表3 被调查农户单维贫困率Tab.3 Unidimensional poverty incidence of surveyed rural households |
| 子系统 | 教育 | 健康 | 居住 | 生活 | 收入 | ||||||||||
|---|---|---|---|---|---|---|---|---|---|---|---|---|---|---|---|
| 家庭成员 最高学历 | 儿童就学 情况 | 新农合 情况 | 患病 情况 | 安全 住房 | 营养 状况 | 穿衣 状况 | 冲水 厕所 | 炊事 燃料 | 资产 状况 | 家庭年人均 纯收入 | |||||
| 剥夺农户数量/户 | 803 | 17 | 6 | 1554 | 389 | 13 | 19 | 390 | 1237 | 1010 | 285 | ||||
| 贫困率/% | 20.5 | 0.4 | 0.2 | 39.6 | 9.9 | 0.3 | 0.5 | 9.9 | 31.5 | 25.7 | 7.3 | ||||
表4 不同k值下的多维贫困测算结果Tab.4 Measurements and contribution of each subsystem under different k-values |
| k | 多维贫困率H/% | 平均剥夺份额A | 多维贫困指数MPI |
|---|---|---|---|
| 1 | 76.33 | 0.1725 | 0.1317 |
| 2 | 40.93 | 0.2431 | 0.0995 |
| 3 | 18.22 | 0.3195 | 0.0582 |
| 4 | 6.45 | 0.4050 | 0.0261 |
| 5 | 2.17 | 0.4866 | 0.0105 |
| 6 | 0.54 | 0.5844 | 0.0031 |
| 7 | 0.18 | 0.6623 | 0.0012 |
| 8 | 0.05 | 0.7273 | 0.0004 |
表5 不同指标对多维贫困指数的贡献率(k=3)Tab.5 Contribution of the indicators to the multidimensional poverty index (%) |
| 子系统 | 教育 | 健康 | 居住 | 生活 | 收入 | ||||||||||
|---|---|---|---|---|---|---|---|---|---|---|---|---|---|---|---|
| 家庭成员 最高学历 | 儿童就学 情况 | 新农合 情况 | 患病 情况 | 安全 住房 | 营养 状况 | 穿衣 状况 | 冲水 厕所 | 炊事 燃料 | 资产 状况 | 家庭年人均 纯收入 | |||||
| 贡献率 | 14.88 | 0.36 | 0.24 | 18.27 | 8.83 | 0.52 | 0.76 | 9.39 | 19.14 | 19.90 | 7.72 | ||||
| 合计 | 15.24 | 18.50 | 8.83 | 49.70 | 7.72 | ||||||||||
表6 影响因素的变量表示及统计特征Tab.6 Variable representation and statistical features of influencing factors |
| 变量 | 变量说明 | 预设作用方向 | 最小值 | 最大值 | 平均值 | 中位数 |
|---|---|---|---|---|---|---|
| 户主性别x1 | 1为女性户主家庭,0为男性户主家庭 | 正向 | 0 | 1.00 | 0.084 | 0 |
| 户主受教育水平x2 | 小学及以下为1,初中为2,高中、职中、职专为3,大学及以上为4;数值越大表示受教育水平越高 | 负向 | 1.00 | 2.33 | 1.621 | 1.630 |
| 女性劳动力占比x3 | 农户女性劳动力占全部劳动力之比 | 正向 | 0.21 | 2.00 | 0.699 | 0.620 |
| 抚养比x4 | 农户家中单位劳动力供养的60岁以上老人和16岁以下未成年人数量 | 正向 | 0.49 | 3.78 | 1.506 | 1.295 |
表7 多维贫困影响因素的OLS和GWR模型估计结果Tab.7 Estimation results of the ordinary least squares (OLS) and geographically weighted regression (GWR) models for factors of multidimensional poverty |
| 变量 | OLS模型 | 变量 | GWR模型 | |||||
|---|---|---|---|---|---|---|---|---|
| 回归系数 | 标准差 | t统计值 | P值 | 回归系数范围 | 回归系数平均值 | |||
| 截距 | 0.1358 | 0.0253 | 5.3765 | 0.0007*** | 截距 | 0.0084~0.1895 | 0.0957 | |
| x1 | 0.0529 | 0.0247 | 2.1406 | 0.0342** | x1 | -0.0197~0.1453 | 0.0416 | |
| x2 | -0.0573 | 0.0147 | -3.8948 | 0.0002*** | x2 | -0.0847~0.0070 | -0.0370 | |
| x3 | -0.0985 | 0.0256 | -3.8541 | 0.0002*** | x3 | -0.1812~-0.0275 | -0.1171 | |
| x4 | 0.0505 | 0.0110 | 4.5918 | <0.0001*** | x4 | 0.0269~0.0806 | 0.0622 | |
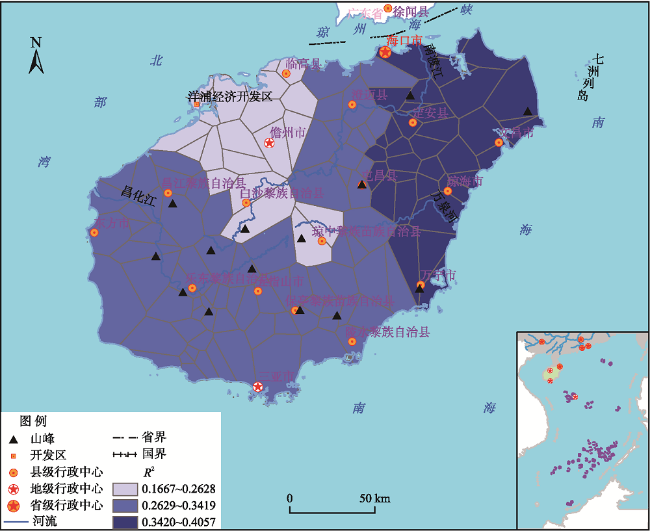
| F | 11.6624*** | 局部R2 | 0.1667~0.4057 | |||||
| R2 | 0.2656 | R2 | 0.4419 | |||||
| 调整R2 | 0.2428 | 调整R2 | 0.3598 | |||||
| 残差平方和 | 0.2249 | 残差平方和 | 0.1709 | |||||
| 残差Moran's I | 0.1746 (P=0.0004) | 残差Moran's I | 0.0554 (P=0.2190) | |||||
| AICc | 781.1336 | AICc | 764.1921 | |||||
注:***、**分别表示通过0.01、0.05水平上的显著性检验。 |
| [1] |
|
| [2] |
|
| [3] |
|
| [4] |
|
| [5] |
|
| [6] |
|
| [7] |
|
| [8] |
|
| [9] |
|
| [10] |
|
| [11] |
|
| [12] |
|
| [13] |
|
| [14] |
|
| [15] |
|
| [16] |
刘彦随. 中国新时代城乡融合与乡村振兴[J]. 地理学报, 2018,73(4):637-650.
[
|
| [17] |
杨慧敏, 罗庆, 李小建, 等. 生态敏感区农户多维贫困测度及影响因素分析: 以河南省淅川县3个村为例[J]. 经济地理, 2016,36(10):137-144.
[
|
| [18] |
文琦, 施琳娜, 马彩虹, 等. 黄土高原村域多维贫困空间异质性研究: 以宁夏彭阳县为例[J]. 地理学报, 2018,73(10):1850-1864.
[
|
| [19] |
|
| [20] |
|
| [21] |
|
| [22] |
马历, 龙花楼, 屠爽爽, 等. 基于乡村多功能理论的贫困村域演变特征与振兴路径探讨: 以海南省什寒村为例[J]. 地理科学进展, 2019,38(9):1435-1446.
[
|
| [23] |
|
| [24] |
何仁伟, 方方, 刘运伟. 贫困山区农户人力资本对生计策略的影响研究: 以四川省凉山彝族自治州为例[J]. 地理科学进展, 2019,38(9):1282-1293.
[
|
| [25] |
张金萍, 宋伟, 林丹, 等. 海南省连片贫困地区农户致贫风险分析[J]. 地理科学, 2020,40(4):608-616.
[
|
| [26] |
张金萍, 秦耀辰. 县域粮食单产及其生产投入因素的空间异质性: 以河南省为例[J]. 自然资源学报, 2011,26(3):373-381.
[
|
| [27] |
|
| [28] |
程叶青, 翟梦潇, 王莹, 等. 海南省新型城镇化发展模式及驱动力分析: 以琼海市为例[J]. 地理科学, 2019,39(12):1902-1909.
[
|
/
| 〈 |
|
〉 |