
Spatiotemporal distribution of drug crimes at micro-scale: Taking NH and DM residential communities in SZ City as an example
Received date: 2019-09-24
Request revised date: 2020-02-02
Online published: 2020-07-28
Supported by
Key Found Project of Guangdong Province(2017B030305005)
Copyright
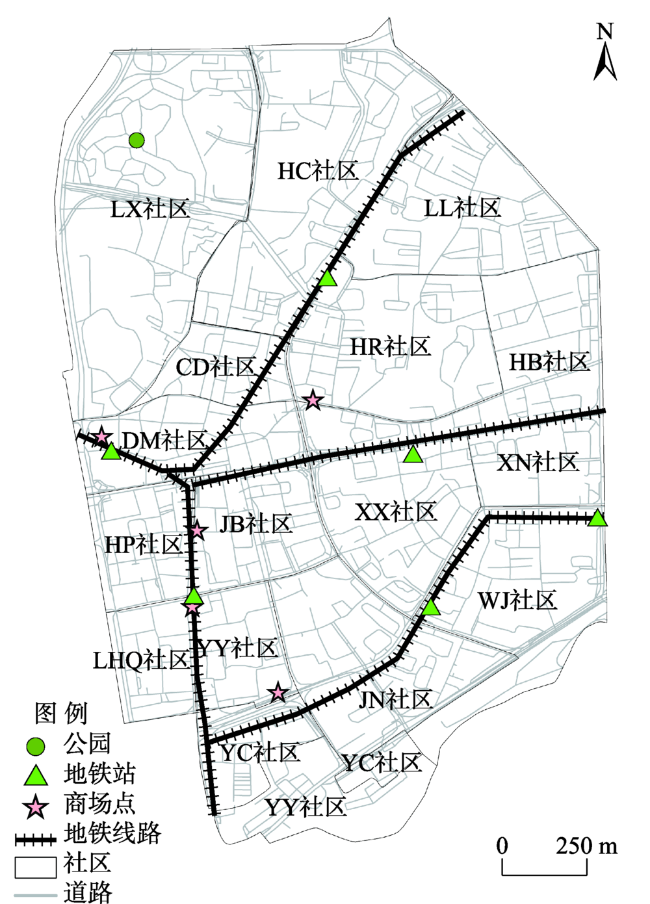
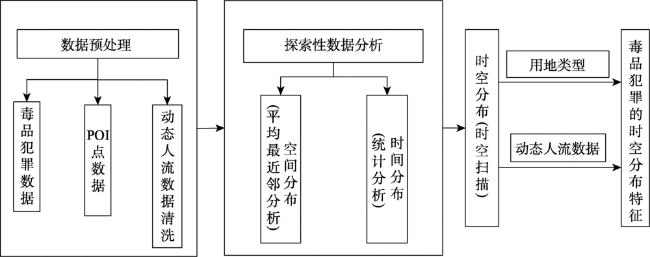
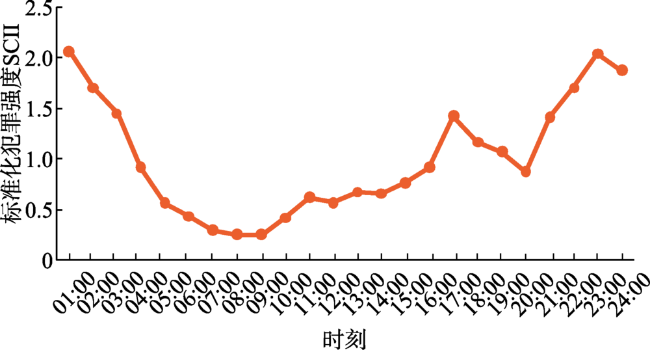
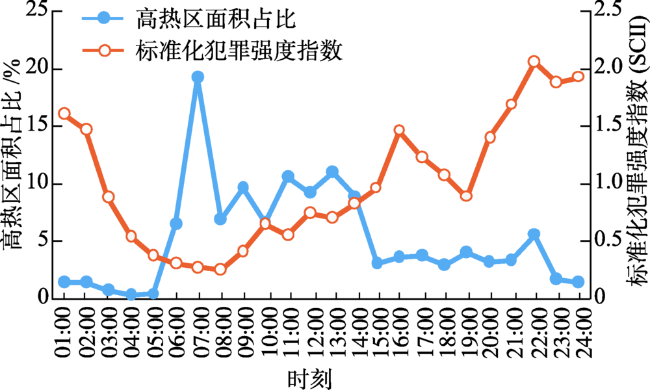
Drug crime is a criminal act of common concern in many places of the world. Many scholars have carried out research from different professional fields. The causes of drug-related crimes have been analyzed in the existing literature. Because of the limitations of data, there is little research on the spatial and temporal distribution of drug-related crime hotspots at the micro-scale. This study took NH and DM residential communities in SZ as an example. Based on the data of drug crime cases, this study used exploratory data analysis and spatiotemporal scanning to identify the distribution of hotspots of drug crimes. Then, by combining the spatial data of land use types and dynamic population flow, it quantitatively analyzed the influencing factors of the spatiotemporal distribution pattern of drug crime cases. The results show that: 1) Drug crimes mainly distribute in developed commercial areas and urban villages, and the hotspot distribution of drug crimes in urban villages occurred earlier than in developed commercial areas, and the scope of influence is larger in the former; 2) The distribution of drug crimes in different land types is uneven; the land use types of accommodation, tourism, and entertainment, wholesale and retail commercial department stores, and catering and business services are highly correlated with drug crimes. 3) The proportion of the area in hotspot areas with high flow of people has a certain correlation with the occurrence of drug crimes. When the proportion of hotspot areas is greater than 5% or 0, it can restrain the occurrence of drug-related crimes; when the proportion of hotspot areas is between 0 and 5%, it can promote the occurrence of drug-related crimes.
Key words: drug crime; land use type; dynamic population flow; crime geography
LIU Yimeng , LI Weihong , WANG Xin . Spatiotemporal distribution of drug crimes at micro-scale: Taking NH and DM residential communities in SZ City as an example[J]. PROGRESS IN GEOGRAPHY, 2020 , 39(5) : 841 -852 . DOI: 10.18306/dlkxjz.2020.05.012
表1 NH、DM街道社区基础数据Tab.1 Data of NH and DM residential communities |
| 区域 | 面积/km2 | 居民面面积密度/(km2/km2) | 流动人口密度/(万人/km2) | 道路密度/(km/km2) | 毒品犯罪数量/个 |
|---|---|---|---|---|---|
| HR社区 | 0.2719 | 0.4386 | 7.3145 | 27.7034 | 397 |
| HB社区 | 0.2366 | 0.3782 | 6.6923 | 36.0450 | 392 |
| XX社区 | 0.2113 | 0.3746 | 7.3594 | 34.4651 | 618 |
| JN社区 | 0.2647 | 0.3108 | 4.0139 | 42.4013 | 452 |
| DM社区 | 0.1673 | 0.4446 | 5.8316 | 35.8341 | 153 |
| JB社区 | 0.1496 | 0.4356 | 5.3669 | 46.8281 | 173 |
| YY社区 | 0.2439 | 0.3217 | 0.5489 | 29.1530 | 261 |
| LX社区 | 0.5615 | 0.1598 | 0.7651 | 34.4173 | 66 |
| CD社区 | 0.0909 | 0.5629 | 3.8510 | 32.1671 | 75 |
| WJ社区 | 0.2767 | 0.2004 | 4.7269 | 33.3276 | 227 |
| LL社区 | 0.2687 | 0.3776 | 4.5917 | 34.2651 | 354 |
| XN社区 | 0.1139 | 0.2606 | 2.9650 | 31.3794 | 77 |
| LHQ社区 | 0.0925 | 0.3358 | 2.1895 | 32.7419 | 99 |
| HP社区 | 0.1183 | 0.3238 | 1.6810 | 42.9612 | 79 |
| YC社区 | 0.1118 | 0.2586 | 4.4269 | 47.4451 | 147 |
| HC社区 | 0.4192 | 0.2363 | 1.8833 | 32.8779 | 87 |
表2 NH、DM街道2009—2018年毒品犯罪平均最近邻群聚分析Tab.2 Average nearest neighbor cluster analysis of drug crimes in NH and DM residential communities, 2009-2018 |
| 毒品犯罪资料年度 | 平均最近邻距离/m | 期望最近邻距离/m | 最近邻指数 | Z值 |
|---|---|---|---|---|
| 2009 | 18.13 | 36.04 | 0.503174*** | -25.485873 |
| 2010 | 20.37 | 41.85 | 0.486784*** | -23.563643 |
| 2011 | 27.90 | 46.14 | 0.604639*** | -15.883410 |
| 2012 | 26.35 | 49.44 | 0.532951*** | -17.394550 |
| 2013 | 30.63 | 50.21 | 0.609894*** | -13.981935 |
| 2014 | 32.84 | 52.59 | 0.624494*** | -13.128682 |
| 2015 | 34.22 | 54.64 | 0.626347*** | -12.686879 |
| 2016 | 45.14 | 66.37 | 0.680198*** | -8.781033 |
| 2017 | 47.45 | 71.96 | 0.659333*** | -8.371492 |
| 2018 | 48.13 | 71.38 | 0.674258*** | -8.220137 |
| 2009—2018年 | 6.03 | 16.56 | 0.364209*** | -74.830417 |
注:***表示显著性P<0.001。 |
表3 XX社区内各用地类型上的毒品犯罪率区位熵(Qi)Tab.3 Location entropy of drug crime rate of different land use types in XX community (Qi) |
| 序号 | 用地类型 | 面积/km2 | 毒品犯罪数量/个 | 毒品犯罪率区位熵(Qi) |
|---|---|---|---|---|
| 1 | 党政机关政法团体 | 0.54 | 4 | 0.243934 |
| 2 | 科研开发教育机构 | 0.35 | 1 | 0.093903 |
| 3 | 医疗卫生保健福利 | 0.51 | 10 | 0.650487 |
| 4 | 新闻媒体文化体育 | 0.1 | 3 | 0.960384 |
| 5 | 水电建筑城建环保 | 0 | 0 | 0 |
| 6 | 金融保险邮政电信 | 0.82 | 24 | 0.959366 |
| 7 | 农林牧渔宠物园艺 | 0.05 | 1 | 0.642476 |
| 8 | 商业科技贸易公司 | 0.39 | 6 | 0.506511 |
| 9 | 纺织建材食品加工 | 0.01 | 0 | 0 |
| 10 | 机械化工电器制造 | 0 | 0 | 0 |
| 11 | 住宿旅游娱乐 | 2.45 | 128 | 1.723174 |
| 12 | 居民服务商务服务 | 1.76 | 71 | 1.327987 |
| 13 | 房产园区商务楼宇 | 6.54 | 175 | 0.880289 |
| 14 | 商业百货批发零售 | 1.92 | 68 | 1.168733 |
| 15 | 交通运输物流仓储 | 2.97 | 65 | 0.719284 |
| 16 | 餐饮经营服务品牌 | 2.72 | 86 | 1.042033 |
注:加粗数据表示该类用地毒品犯罪率区位熵Qi>1。 |
表4 HR、HB社区内各用地类型上的毒品犯罪率区位熵(Qi)Tab.4 Location entropy of drug crime rate in HR and HB communities |
| 序号 | 用地类型 | 面积/km2 | 毒品犯罪数量/个 | 毒品犯罪率区位熵(Qi) |
|---|---|---|---|---|
| 1 | 党政机关政法团体 | 1.83 | 24 | 0.817773 |
| 2 | 科研开发教育机构 | 0.91 | 11 | 0.756084 |
| 3 | 医疗卫生保健福利 | 0.95 | 11 | 0.722779 |
| 4 | 新闻媒体文化体育 | 1.22 | 18 | 0.923064 |
| 5 | 水电建筑城建环保 | 0.15 | 0 | 0 |
| 6 | 金融保险邮政电信 | 1.94 | 21 | 0.675579 |
| 7 | 农林牧渔宠物园艺 | 0.14 | 0 | 0 |
| 8 | 商业科技贸易公司 | 0.59 | 7 | 0.737111 |
| 9 | 纺织建材食品加工 | 0.02 | 0 | 0 |
| 10 | 机械化工电器制造 | 0 | 0 | 0 |
| 11 | 住宿旅游娱乐 | 4.28 | 208 | 3.031710 |
| 12 | 居民服务商务服务 | 2.73 | 39 | 0.892887 |
| 13 | 房产园区商务楼宇 | 15.89 | 173 | 0.679480 |
| 14 | 商业百货批发零售 | 9.85 | 163 | 1.032380 |
| 15 | 交通运输物流仓储 | 5.79 | 63 | 0.678177 |
| 16 | 餐饮经营服务品牌 | 4.57 | 77 | 1.050990 |
注:加粗数据表示该类用地毒品犯罪率区位熵Qi>1。 |
表5 JN社区内各用地类型上的毒品犯罪率区位熵(Qi)Tab.5 Location entropy of drug crime rate of different land use types in JN community (Qi) |
| 序号 | 用地类型 | 面积/km2 | 毒品犯罪数量/个 | 毒品犯罪率区位熵(Qi) |
|---|---|---|---|---|
| 1 | 党政机关政法团体 | 0.97 | 9 | 0.521638 |
| 2 | 科研开发教育机构 | 1.83 | 3 | 0.092286 |
| 3 | 医疗卫生保健福利 | 1.42 | 21 | 0.835206 |
| 4 | 新闻媒体文化体育 | 0.45 | 4 | 0.501637 |
| 5 | 水电建筑城建环保 | 0 | 0 | 0 |
| 6 | 金融保险邮政电信 | 0.81 | 3 | 0.209177 |
| 7 | 农林牧渔宠物园艺 | 0.16 | 1 | 0.343831 |
| 8 | 商业科技贸易公司 | 0.02 | 0 | 0 |
| 9 | 纺织建材食品加工 | 0 | 0 | 0 |
| 10 | 机械化工电器制造 | 0 | 0 | 0 |
| 11 | 住宿旅游娱乐 | 3.85 | 149 | 2.176620 |
| 12 | 居民服务商务服务 | 2.02 | 20 | 0.557126 |
| 13 | 房产园区商务楼宇 | 4.27 | 62 | 0.818716 |
| 14 | 商业百货批发零售 | 2.79 | 51 | 1.028359 |
| 15 | 交通运输物流仓储 | 4.80 | 81 | 0.950060 |
| 16 | 餐饮经营服务品牌 | 3.08 | 66 | 1.207736 |
注:加粗数据表示该类用地毒品犯罪率区位熵Qi>1。 |
表6 毒品犯罪总量与各影响因子之间的关系Tab.6 Relationship between drug crime cases and influencing factors |
| 影响因子 | Person相关系数 | 显著性水平 | |
|---|---|---|---|
| 道路密度 | -0.010 | 0.969 | |
| 流动人口密度 | 0.653** | 0.006 | |
| 居民面密度 | 0.262 | 0.327 | |
注:**表示在0.01水平(双侧)上显著相关。 |
| [1] |
梅建明 . 论环境犯罪学的起源、发展与贡献 [J]. 中国人民公安大学学报(社会科学版), 2006(5):66-72.
[
|
| [2] |
姜超, 唐焕丽, 柳林 . 中国犯罪地理研究述评 [J]. 地理科学进展, 2014,33(4):561-573.
[
|
| [3] |
|
| [4] |
|
| [5] |
李卫红, 童昊昕 . 针对非平衡警情数据改进的K-Means-Boosting-BP模型 [J]. 中国图象图形学报, 2017,22(9):1314-1324.
[
|
| [6] |
柳林, 张春霞, 冯嘉欣 , 等. ZG市诈骗犯罪的时空分布与影响因素 [J]. 地理学报, 2017,72(2):315-328.
[
|
| [7] |
张宁, 王大为 . 基于风险地形建模的毒品犯罪风险评估和警务预测 [J]. 地理科学进展, 2018,37(8):1131-1139.
[
|
| [8] |
李卫红, 闻磊, 陈业滨 . 改进的GA-BP神经网络模型在财产犯罪预测中的应用 [J]. 武汉大学学报(信息科学版), 2017,42(8):1110-1117.
[
|
| [9] |
陈鹏, 疏学明 . 时空犯罪热点预测模型研究 [J]. 系统仿真学报, 2011,23(9):1782-1786.
[
|
| [10] |
|
| [11] |
肖露子, 柳林, 周素红 , 等. ZG市工作日地铁站点扒窃案件的时空分布及其影响因素 [J]. 地理科学, 2018,38(8):1227-1234.
[
|
| [12] |
|
| [13] |
闻磊, 李卫红, 戴侃 , 等. 空间视角下中国城市财产犯罪成因分析 [J]. 测绘科学, 2015,40(8):152-157.
[
|
| [14] |
|
| [15] |
李卫红, 戴侃, 闻磊 . 顾及地理因素的犯罪地理目标模型改进方法 [J]. 测绘科学, 2015,40(7):86-91, 149.
[
|
| [16] |
|
| [17] |
|
| [18] |
|
| [19] |
徐冲, 柳林, 周素红 . DP半岛街头抢劫案件的临近重复发生模式 [J]. 地理研究, 2015,34(2):384-394.
[
|
| [20] |
柳林, 杜方叶, 肖露子 , 等. 不同类型道路密度对公共空间盗窃犯罪率的影响: 基于ZG市的实证研究 [J]. 人文地理, 2017,32(6):32-38, 46.
[
|
| [21] |
|
| [22] |
|
| [23] |
|
| [24] |
毛媛媛, 丁家骏 . 抢劫与抢夺犯罪行为时空分布特征研究: 以上海市浦东新区为例 [J]. 人文地理, 2014,29(1):49-54.
[
|
| [25] |
|
| [26] |
赵丹丹 . 盗三车类案件时空分布特征及预测: 以上海市长宁区为例[D]. 开封: 河南大学, 2017.
[
|
| [27] |
徐嘉祥 . 基于环境犯罪学理论的入室盗窃时空分布研究: 以北京市主城区案件的分析为例 [J]. 人文地理, 2018,33(1):43-50.
[
|
| [28] |
陈鹏, 李欣, 胡啸峰 , 等. 北京市长安街沿线的扒窃案件高发区分析及防控对策 [J]. 地理科学进展, 2015,34(10):1250-1258.
[
|
| [29] |
徐冲, 柳林, 周素红 , 等. 微观空间因素对街头抢劫影响的空间异质性: 以DP半岛为例 [J]. 地理研究, 2017,36(12):2492-2504.
[
|
| [30] |
程连生, 马丽 . 北京城市犯罪地理分析 [J]. 人文地理, 1997,12(2):7-12.
[
|
| [31] |
刘大千, 宋伟, 修春亮 . 长春市“两抢两盗”犯罪的空间分析 [J]. 地理科学, 2014,34(11):1344-1352.
[
|
| [32] |
柳林, 姜超, 周素红 , 等. 城市入室盗窃犯罪的多尺度时空格局分析: 基于中国H市DP半岛的案例研究 [J]. 地理研究, 2017,36(12):2451-2464.
[
|
/
| 〈 |
|
〉 |

