
Population exposure to heatwaves in Shenzhen based on mobile phone location data
Received date: 2019-02-18
Request revised date: 2019-05-14
Online published: 2020-04-28
Supported by
National Key Technology Research and Development Program of the Ministry of Science and Technology of China(2013BAJ05B04)
The Project Supported by the Open Fund of Key Laboratory of Urban Land Resources Monitoring and Simulation, MNR(KF-2015-01-011)
Copyright
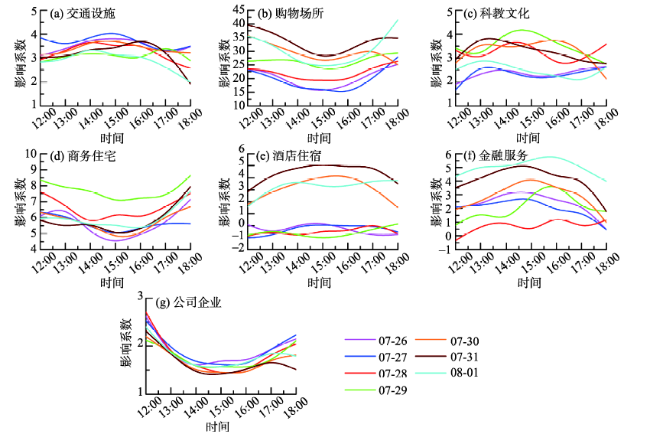
As one of the characteristic disasters of urbanization, heatwaves seriously affect the life and health of urban residents. Existing research on heatwaves mainly focuses on the spatial and temporal pattern based on static data, risk management, and vulnerability assessment, and studies on dynamic population exposure are relatively few. This study first integrated spatial and temporal distribution models of population and temperature hourly in Shenzhen to reveal the dynamic population exposure to heatwaves based on mobile phone location data. Then a set of geographically weighted regression models in different time were built based on seven types of points of interest (POIs) and population distribution to explore the influencing mechanisms of POIs on crowd behavior patterns during the heatwaves. The results show that: 1) Compared with the baseline (12:00 to 18:00 on 28 July 2018), the average radiation range of the heatwaves increases by 8.66 times on 29 July, and jumped to the peak of 18.93 times on 30 July from 26 July to 1 August 2018. The overall coverage shows that temperature in the west was higher than the east and temperature in the south was lower than the north. 2) Population distribution exhibited an obvious zonal distribution of aggregates in different time periods, and population exposure was closely related to the dynamic evolution of temperature and population. The population exposure was similar to that of heatwaves, showing 2.29 times proportional growth. The coverage included densely populated urban commercial, industrial, and residential centers such as Nanshan District, Futian District, and Luohu District. 3) The same type of POIs at different times and the different types of POIs at the same time showed obvious spatial-temporal differences as driving mechanisms and selection preferences in the interactive mobility behavior of reducing population exposure. Under the background of sustainable urbanization, this research can provide a scientific reference for the analysis of population exposure to similar urban hazards and disasters.
XIE Cheng , HUANG Bo , LIU Xiaoqian , ZHOU Tao , WANG Yu . Population exposure to heatwaves in Shenzhen based on mobile phone location data[J]. PROGRESS IN GEOGRAPHY, 2020 , 39(2) : 231 -242 . DOI: 10.18306/dlkxjz.2020.02.005
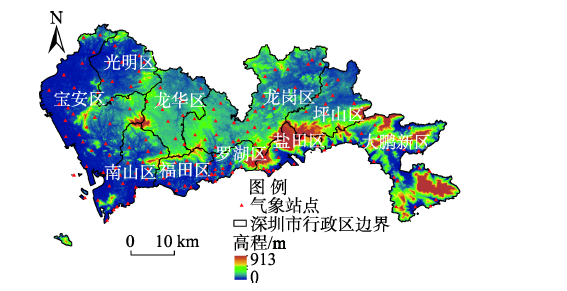
图1 深圳市高程及气象站点分布Fig.1 Distribution of meteorological stations and elevation of Shenzhen |
表1 深圳市2018年第三季度高温及台风预警信息Tab.1 High temperature and typhoon warning information for the third quarter of 2018 in Shenzhen |
| 编号 | 发布时间 | 取消时间 | 预警类型 | 发布区域是否覆盖全境陆地 |
|---|---|---|---|---|
| 1 | 2018-07-11T05:20 | 2018-07-12T18:00 | 高温 | 是 |
| 2 | 2018-07-16T17:00 | 2018-07-18T06:10 | 台风 | 否 |
| 3 | 2018-07-17T12:25 | 2018-07-17T20:00 | 高温 | 是 |
| 4 | 2018-07-21T07:45 | 2018-07-22T15:55 | 高温 | 是 |
| 5 | 2018-07-22T17:00 | 2018-07-24T11:00 | 台风 | 是 |
| 6 | 2018-07-28T11:45 | 2018-08-03T17:45 | 高温 | 是 |
| 7 | 2018-08-06T09:05 | 2018-08-09T19:30 | 高温 | 是 |
| 8 | 2018-08-09T17:00 | 2018-08-15T17:00 | 台风 | 是 |
| 9 | 2018-08-25T09:00 | 2018-08-26T15:30 | 高温 | 是 |
| 10 | 2018-09-11T11:00 | 2018-09-13T06:30 | 台风 | 否 |
| 11 | 2018-09-14T12:30 | 2018-09-17T14:10 | 台风 | 是 |
| 12 | 2018-09-14T09:10 | 2018-09-15T20:00 | 高温 | 是 |
Tab.2 Types of points of interest (POIs) in Shenzhen |
| 类型 | 交通设施 | 购物场所 | 科教文化 | 餐饮 | 商务住宅 | 医疗保健 | 生活服务 | 风景名胜 | 酒店住宿 | 金融服务 | 公司企业 |
|---|---|---|---|---|---|---|---|---|---|---|---|
| 数量/个 | 37356 | 4661 | 26684 | 75030 | 27453 | 20326 | 56695 | 2514 | 12622 | 14183 | 141700 |
表3 人口与城市POI相关性及变量间共线性检验结果Tab.3 Results of correlation between population and urban points of interest (POIs) and collinearity test between variables |
| 解释变量 | 相关性 | 多重共线性 | |||
|---|---|---|---|---|---|
| 相关系数 | 相关性强弱 | 膨胀系数(VIF) | 共线性强弱 | ||
| 交通设施 | 0.710 | 强 | 8.49 | 较强 | |
| 购物场所 | 0.780 | 强 | 6.66 | 无 | |
| 科教文化 | 0.702 | 强 | 7.35 | 无 | |
| 餐饮 | 0.810 | 极强 | 19.87 | 较强 | |
| 商务住宅 | 0.781 | 强 | 5.70 | 无 | |
| 医疗保健 | 0.772 | 强 | 13.22 | 较强 | |
| 生活服务 | 0.801 | 极强 | 32.65 | 较强 | |
| 风景名胜 | 0.268 | 弱 | 1.32 | 无 | |
| 酒店住宿 | 0.578 | 较强 | 2.24 | 无 | |
| 金融服务 | 0.585 | 较强 | 3.49 | 无 | |
| 公司企业 | 0.746 | 强 | 3.52 | 无 | |
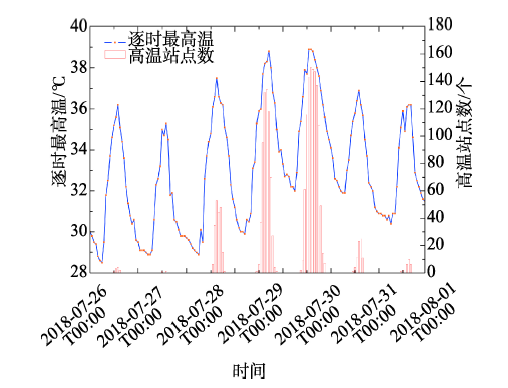
表4 热浪覆盖面积百分比Tab.4 Percentage of coverage of heatwaves (%) |
| 日期 | 12:00 | 13:00 | 14:00 | 15:00 | 16:00 | 17:00 | 18:00 |
|---|---|---|---|---|---|---|---|
| 2018-07-26 | 0 | 0 | 2.94 | 0 | 0 | 0 | 0 |
| 2018-07-27 | 0 | 0 | 0 | 0 | 0 | 0 | 0 |
| 2018-07-28 | 0 | 0 | 1.00 | 10.88 | 4.10 | 14.70 | 0.45 |
| 2018-07-29 | 0 | 0 | 52.62 | 86.52 | 86.52 | 74.14 | 1.00 |
| 2018-07-30 | 83.42 | 100 | 99.76 | 100 | 91.90 | 91.95 | 53.70 |
| 2018-07-31 | 0 | 0 | 2.72 | 0 | 0 | 0 | 0 |
| 2018-08-01 | 0 | 0 | 0 | 0 | 0 | 0 | 0 |
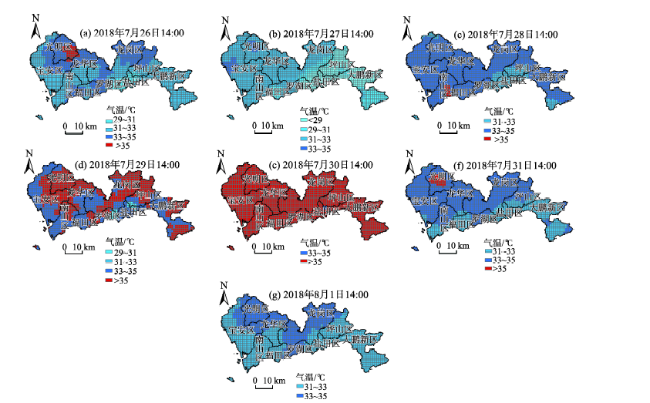
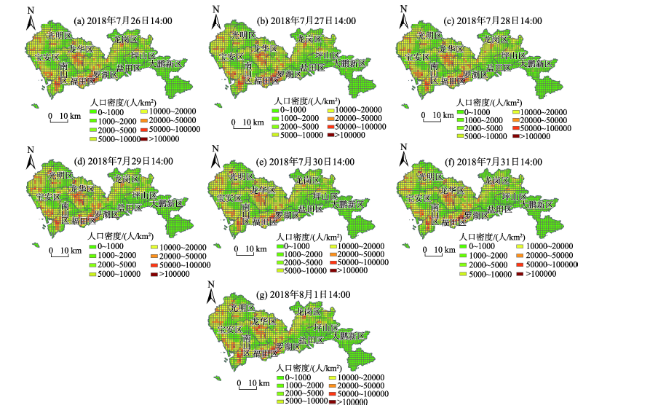
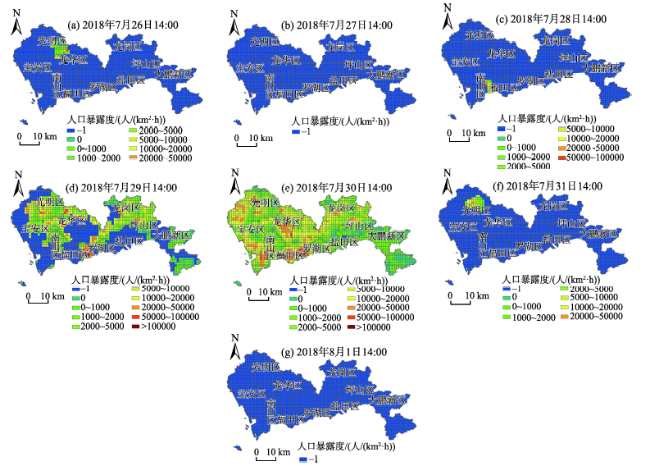
图6 热浪周期日内14:00时人口暴露度空间分布注:图例中标注为“-1”所示区域表示热浪零暴露区。 Fig.6 Spatial distribution of diurnal population exposure at 14:00 during the period of heatwaves |
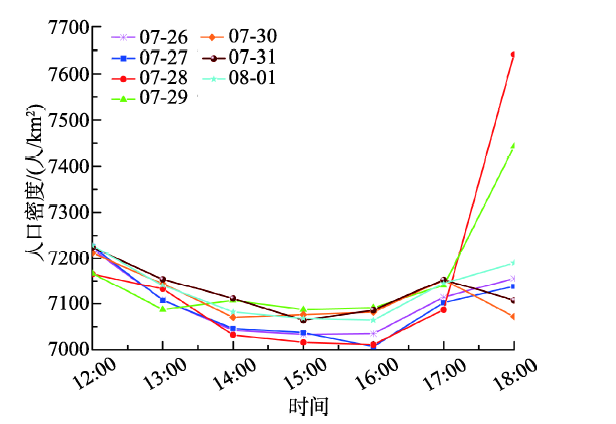
表5 热浪周期12:00~18:00逐时人口暴露度百分比Tab.5 Percentage of population exposure from 12:00 to 18:00 during the period of heatwaves (%) |
| 日期 | 12:00 | 13:00 | 14:00 | 15:00 | 16:00 | 17:00 | 18:00 |
|---|---|---|---|---|---|---|---|
| 2018-07-26 | 0 | 0 | 1.47 | 0 | 0 | 0 | 0 |
| 2018-07-27 | 0 | 0 | 0 | 0 | 0 | 0 | 0 |
| 2018-07-28 | 0 | 0 | 1.54 | 15.00 | 5.61 | 20.31 | 1.47 |
| 2018-07-29 | 0 | 0 | 45.12 | 93.26 | 93.17 | 70.69 | 1.16 |
| 2018-07-30 | 77.43 | 100.00 | 99.80 | 100.00 | 97.72 | 97.55 | 64.33 |
| 2018-07-31 | 0 | 0 | 2.43 | 0 | 0 | 0 | 0 |
| 2018-08-01 | 0 | 0 | 0 | 0 | 0 | 0 | 0 |
| [1] |
IPCC. Climate change 2014: Synbook report. Contribution of working groups I, II and III to the fifth asessment report of the Intergovernmental Panel on Climate Change[M]. Geneva, Switzerland, 2014.
|
| [2] |
|
| [3] |
|
| [4] |
金星星, 祁新华, 陆玉麒 , 等. 福建省高温热浪风险评估与空间分异研究[J]. 地球信息科学学报, 2018,20(12):1820-1829.
[
|
| [5] |
聂羽, 韩振宇, 韩荣青 , 等. 中国夏季热浪持续天数的年际变化及环流异常分析[J]. 气象, 2018,44(2):294-303.
[
|
| [6] |
|
| [7] |
谢盼, 王仰麟, 彭建 , 等. 基于居民健康的城市高温热浪灾害脆弱性评价: 研究进展与框架[J]. 地理科学进展, 2015,34(2):165-174.
[
|
| [8] |
周洋, 祝善友, 华俊玮 , 等. 南京市高温热浪时空分布研究[J]. 地球信息科学学报, 2018,20(11):1613-1621.
[
|
| [9] |
|
| [10] |
|
| [11] |
李双双, 延军平, 杨赛霓 , 等. 1960—2016 年秦岭—淮河地区热浪时空变化特征及其影响因素[J]. 地理科学进展, 2018,37(4):504-514.
[
|
| [12] |
|
| [13] |
|
| [14] |
谢盼, 王仰麟, 刘焱序 , 等. 基于社会脆弱性的中国高温灾害人群健康风险评价[J]. 地理学报, 2015,70(7):1041-1051.
[
|
| [15] |
税伟, 陈志淳, 邓捷铭 , 等. 耦合适应力的福州市高温脆弱性评估[J]. 地理学报, 2017,72(5):830-849.
[
|
| [16] |
|
| [17] |
黄大鹏, 张蕾, 高歌 . 未来情景下中国高温的人口暴露度变化及影响因素研究[J]. 地理学报, 2016,71(7):1189-1200.
[
|
| [18] |
张蕾, 黄大鹏, 杨冰韵 . RCP4.5情景下中国人口对高温暴露度预估研究[J]. 地理研究, 2016,35(12):2238-2248.
[
|
| [19] |
金星星, 祁新华, 程煜 , 等. 流动人口对高温热浪影响的感知与适应: 以福州市为例[J]. 福建师范大学学报(自然科学版), 2016,32(4):111-117.
[
|
| [20] |
彭朝琼, 余淑苑, 廖玉学 , 等. 深圳市2014年居民热浪期间适应性行为调查[J]. 中国公共卫生, 2017,33(5):802-805.
[
|
| [21] |
|
| [22] |
|
| [23] |
IPCC. Climate change 2014: Impacts, adaptation, and vulnerability. Part A: Global and sectoral aspects. Contribution of working group II to the fifth assessment report of the Intergovernmental Panel on Climate Change [M]. Cambridge,UK and New York, USA: Cambridge University Press, 2014.
|
| [24] |
陈倩, 丁明军, 杨续超 , 等. 长江三角洲地区高温热浪人群健康风险评价[J]. 地球信息科学学报, 2017,19(11):1475-1484.
[
|
| [25] |
同丽嘎, 李雪铭, 斯琴 , 等. 高温热浪暴露风险评价: 以内蒙古包头市为例[J]. 干旱区地理, 2017,40(2):284-292.
[
|
| [26] |
陈丽娜, 吴升, 陈洁 , 等. 基于手机定位数据的城市人口分布近实时预测[J]. 地球信息科学学报, 2018,20(4):523-531.
[
|
| [27] |
田俊荣, 刘泰山, 白之羽, 等. 鹏城展翅再高飞(壮阔东方潮, 奋进新时代: 庆祝改革开放40年) [N/OL]. 人民日报, 2018- 05- 21(1).
[
|
| [28] |
俞文政, 刘海涛 . 近35年深圳市气候变化与城市化发展的关联性[J]. 华南师范大学学报(自然科学版), 2018,50(1):85-91.
[
|
| [29] |
百度地图, 中国城市规划设计研究院. 2018年Q3中国城市活力研究报告 [R/OL]. 百度地图慧眼. 2018-11-08.
[ Baidu Map, China Academy of Urban Planning & Design. China urban vitality research report, 2018Q3. Baidu Map Huiyan. 2018-11-08.]
|
| [30] |
百度地图, 中国城市规划设计研究院. 2018年第四季度&年度中国城市活力研究报告 [R/OL]. 百度地图慧眼. 2019-01-25.
[ Baidu Map, China Academy of Urban Planning & Design. China urban vitality research report, 2018. Baidu Map Huiyan. 2019-01-25.]
|
| [31] |
林珲, 张鸿生, 林殷怡 , 等. 基于城市不透水面-人口关联的粤港澳大湾区人口密度时空分异规律与特征[J]. 地理科学进展, 2018,37(12):1644-1652.
[
|
| [32] |
中国气象局. 高温科普五: 什么是高温热浪 [R]. 北京: 中国气象报社, 2011.
[ China Meteorological Administration. High temperature science five: What is high temperature heat wave. Beijing, China: China Meteorological News, 2011. ]
|
| [33] |
|
| [34] |
|
| [35] |
杨喜平, 方志祥, 赵志远 , 等. 城市人群聚集消散时空模式探索分析: 以深圳市为例[J]. 地球信息科学学报, 2016,18(4):486-492.
[
|
| [36] |
张子民, 周英, 李琦 , 等. 城市局域动态人口估算方法与模拟应用[J]. 地球信息科学学报, 2010,12(4):503-509.
[
|
| [37] |
吴健生, 李博, 黄秀兰 . 小城市居民出行行为时空动态及驱动机制研究[J]. 地球信息科学学报, 2017,19(2):176-184.
[
|
/
| 〈 |
|
〉 |