
Spatial pattern and evolution of cereal trade networks among the Belt and Road countries
Received date: 2019-06-17
Request revised date: 2019-09-01
Online published: 2019-11-01
Supported by
National Natural Science Foundation of China(No. 41971222)
Key Project of the Humanities and Social Sciences Research Base in Ministry of Education(No. 15JJDZONGHE008)
Natural Science Foundation of Henan Province(No. 182300410144)
Program for the First-class Discipline of Henan University(No. 2018YLTD16)
Program for the First-class Discipline of Henan University(No. 2019YLZDYJ12)
Henan Planning Project of Philosophy and Social Science(No. 2019BJJ019)
Copyright
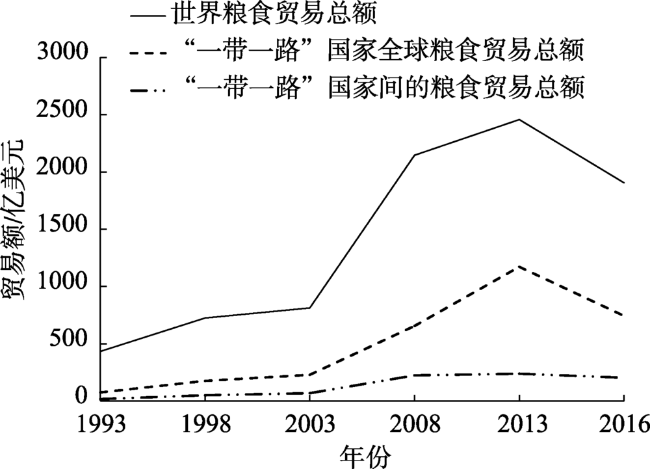
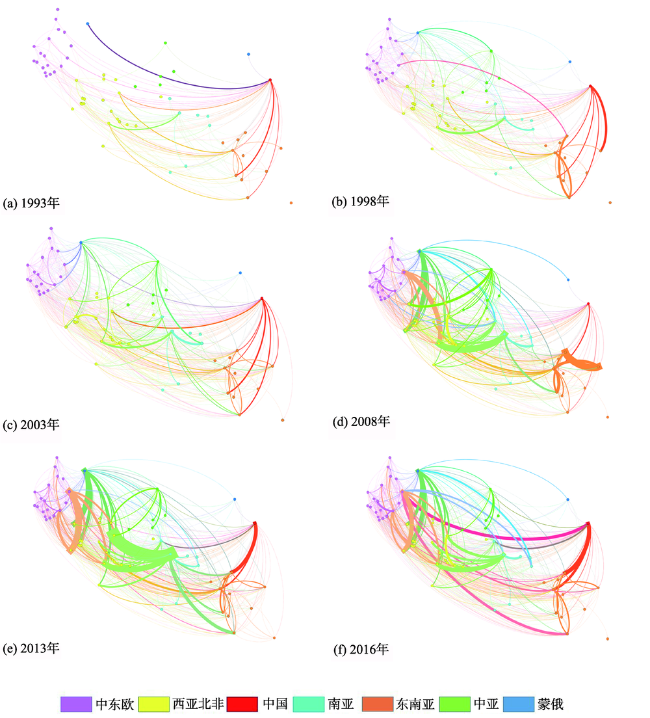
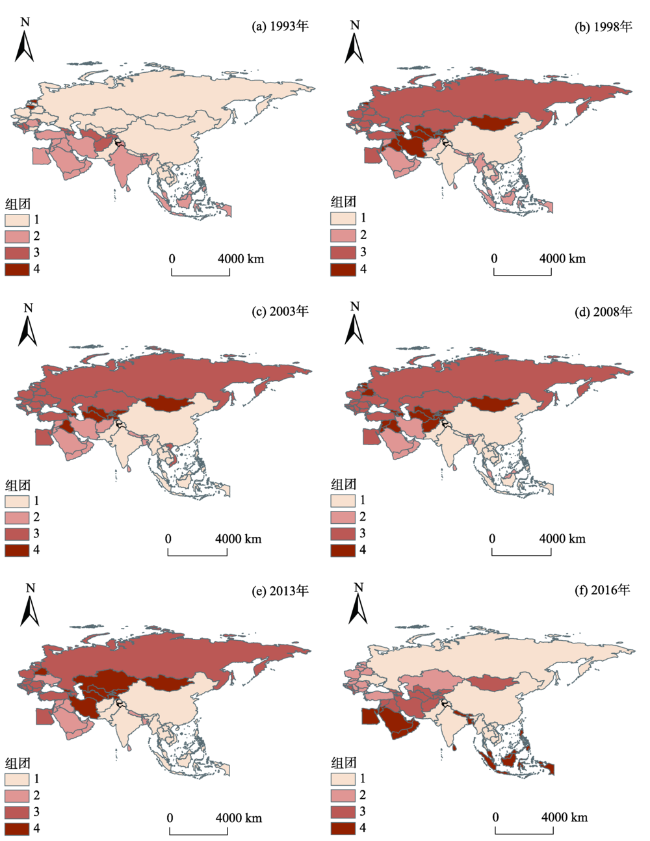
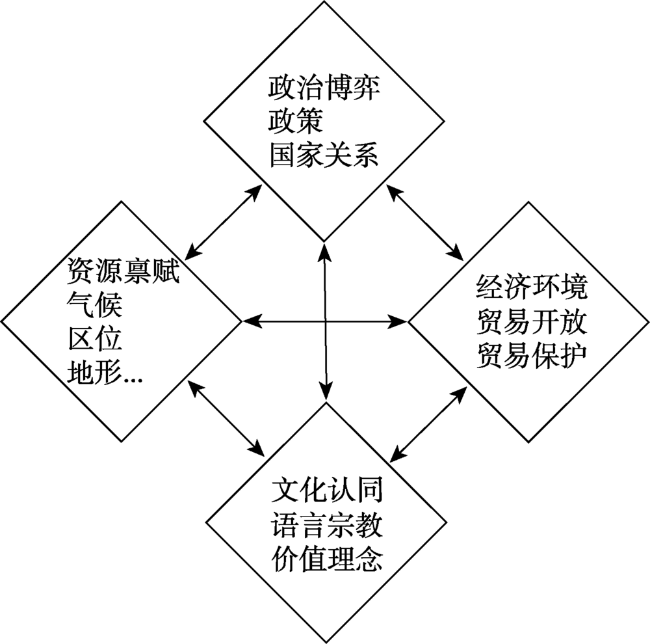
Trade of agricultural commodities is an important part of the economic and trade cooperation between the Belt and Road countries, but the existing trade theories cannot fully explain the pattern and change of the cereal trade network between these countries. This study set up a four-dimensional analytical framework, combined social network analysis with spatial econometric analysis, and analyzed the spatial structure characteristics and mechanism of change of cereal trade network between the Belt and Road countries based on the United Nations Comtrade data from 1993 to 2016. The results show that: 1) The cereal trade network density of the Belt and Road countries is constantly increasing while the trade relations and trade intensity between these countries are constantly deepening. The position of the Belt and Road countries in the global grain trade network is on the rise and there is a clear phenomenon of trade club. 2) The network of trade relations has evolved from non-nuclear to multi-nuclear, and then to reshaping. 3) China's cereal trade with other Belt and Road countries has undergone an evolution from export-oriented to import-oriented. The Belt and Road initiative has enhanced China's position in the global grain trade network. 4) The evolution of the national cereal trade network of the Belt and Road countries is the product of resource endowment, economic environment, cultural identity, and political games. Compared with other trade networks, grain trade network has distinct characteristics and stronger stability. This study may provide some guidance for promoting cereal trade cooperation among the Belt and Road countries, optimizing trade structure, and ensuring food security.
CHEN Yiwen , LI Erling . Spatial pattern and evolution of cereal trade networks among the Belt and Road countries[J]. PROGRESS IN GEOGRAPHY, 2019 , 38(10) : 1643 -1654 . DOI: 10.18306/dlkxjz.2019.10.018
表1 1993—2016年“一带一路”粮食贸易网络中心性指标排名前10位国家Tab.1 Top 10 countries of centrality index in the cereal trade network of the Belt and Road region, 1993-2016 |
| 1993年 | 1998年 | 2003年 | |||||||||||||||||
|---|---|---|---|---|---|---|---|---|---|---|---|---|---|---|---|---|---|---|---|
| 中介度 | 度中心性 | 中介度 | 度中心性 | 中介度 | 度中心性 | ||||||||||||||
| 国家 | 得分 | 国家 | 得分 | 国家 | 得分 | 国家 | 得分 | 国家 | 得分 | 国家 | 得分 | ||||||||
| 中国 | 1.00 | 中国 | 1.00 | 印度 | 1.00 | 泰国 | 1.00 | 泰国 | 1.00 | 泰国 | 1.00 | ||||||||
| 泰国 | 0.52 | 泰国 | 0.90 | 泰国 | 0.94 | 中国 | 0.95 | 中国 | 0.64 | 中国 | 0.88 | ||||||||
| 印度 | 0.24 | 印度 | 0.68 | 中国 | 0.80 | 印度 | 0.95 | 埃及 | 0.64 | 印度 | 0.84 | ||||||||
| 土耳其 | 0.22 | 土耳其 | 0.65 | 俄罗斯 | 0.50 | 乌克兰 | 0.86 | 巴基斯坦 | 0.61 | 巴基斯坦 | 0.82 | ||||||||
| 捷克 | 0.19 | 沙特阿拉伯 | 0.40 | 乌克兰 | 0.45 | 俄罗斯 | 0.82 | 印度 | 0.42 | 俄罗斯 | 0.79 | ||||||||
| 罗马尼亚 | 0.12 | 罗马尼亚 | 0.38 | 沙特阿拉伯 | 0.35 | 巴基斯坦 | 0.66 | 俄罗斯 | 0.41 | 菲律宾 | 0.77 | ||||||||
| 沙特阿拉伯 | 0.04 | 斯里兰卡 | 0.30 | 巴基斯坦 | 0.22 | 匈牙利 | 0.64 | 菲律宾 | 0.41 | 乌克兰 | 0.73 | ||||||||
| 克罗地亚 | 0.03 | 新家坡 | 0.30 | 哈萨克斯坦 | 0.20 | 哈萨克斯坦 | 0.61 | 哈萨克斯坦 | 0.25 | 哈萨克斯坦 | 0.64 | ||||||||
| 匈牙利 | 0.02 | 马来西亚 | 0.28 | 埃及 | 0.20 | 土耳其 | 0.61 | 乌克兰 | 0.23 | 埃及 | 0.63 | ||||||||
| 斯里兰卡 | 0.02 | 匈牙利 | 0.28 | 土耳其 | 0.16 | 埃及 | 0.59 | 越南 | 0.19 | 越南 | 0.63 | ||||||||
| 2008年 | 2013年 | 2016年 | |||||||||||||||||
| 中介度 | 度中心性 | 中介度 | 度中心性 | 中介度 | 度中心性 | ||||||||||||||
| 国家 | 得分 | 国家 | 得分 | 国家 | 得分 | 国家 | 得分 | 国家 | 得分 | 国家 | 得分 | ||||||||
| 泰国 | 1.00 | 泰国 | 1.00 | 印度 | 1.00 | 印度 | 1.00 | 泰国 | 1.00 | 印度 | 1.00 | ||||||||
| 中国 | 0.80 | 中国 | 0.97 | 泰国 | 0.67 | 泰国 | 0.93 | 印度 | 0.77 | 泰国 | 0.97 | ||||||||
| 巴基斯坦 | 0.55 | 巴基斯坦 | 0.92 | 越南 | 0.63 | 俄罗斯 | 0.90 | 中国 | 0.69 | 俄罗斯 | 0.97 | ||||||||
| 俄罗斯 | 0.48 | 印度 | 0.90 | 中国 | 0.61 | 乌克兰 | 0.90 | 俄罗斯 | 0.69 | 乌克兰 | 0.97 | ||||||||
| 印度 | 0.45 | 乌克兰 | 0.88 | 俄罗斯 | 0.58 | 巴基斯坦 | 0.88 | 巴基斯坦 | 0.65 | 巴基斯坦 | 0.95 | ||||||||
| 乌克兰 | 0.41 | 越南 | 0.85 | 乌克兰 | 0.55 | 中国 | 0.87 | 乌克兰 | 0.63 | 中国 | 0.93 | ||||||||
| 越南 | 0.39 | 俄罗斯 | 0.83 | 巴基斯坦 | 0.49 | 越南 | 0.83 | 越南 | 0.44 | 土耳其 | 0.88 | ||||||||
| 埃及 | 0.30 | 埃及 | 0.78 | 土耳其 | 0.36 | 土耳其 | 0.82 | 土耳其 | 0.44 | 越南 | 0.86 | ||||||||
| 阿联酋 | 0.23 | 阿联酋 | 0.75 | 哈萨克斯坦 | 0.32 | 阿联酋 | 0.65 | 黎巴嫩 | 0.27 | 阿联酋 | 0.76 | ||||||||
| 哈萨克斯坦 | 0.21 | 土耳其 | 0.69 | 阿联酋 | 0.17 | 罗马尼亚 | 0.63 | 阿联酋 | 0.26 | 罗马尼亚 | 0.66 | ||||||||
| [1] |
程中海, 冯梅 . 2017. 基于动态复杂网络的世界棉花贸易时空分异特征与贸易格局分析[J]. 国际经贸探索, ( 10):37-51.
[
|
| [2] |
崔莉 . 2017. “一带一路”沿线国家农产品贸易格局分析[J]. 统计与决策, ( 16):152-156.
[
|
| [3] |
蒋小荣 . 2018. 全球贸易网络研究及对中国地缘战略的启示[D]. 兰州: 兰州大学资源环境学院.
[
|
| [4] |
刘卫东, 宋周莺, 刘志高 , 等. 2018. “一带一路”建设研究进展[J]. 地理学报, 73(4):620-636.
[
|
| [5] |
陆大道, 杜德斌 . 2013. 关于加强地缘政治地缘经济研究的思考[J]. 地理学报, 68(6):723-727.
[
|
| [6] |
马述忠, 任婉婉, 吴国杰 . 2016. 一国农产品贸易网络特征及其对全球价值链分工的影响: 基于社会网络分析视角[J]. 管理世界, ( 3):60-72.
[
|
| [7] |
宋周莺, 车姝韵, 张薇 . 2017. 我国与“一带一路”沿线国家贸易特征研究[J]. 中国科学院院刊, 32(4):365-369.
[
|
| [8] |
王磊 . 2001. 无政府状态下的国际合作: 从博弈论角度分析国际关系[J]. 世界经济与政治, ( 8):11-15.
[
|
| [9] |
魏素豪 . 2018. 中国与“一带一路”国家农产品贸易: 网络结构、关联特征与策略选择[J]. 农业经济问题, ( 11):101-113.
[
|
| [10] |
詹淼华 . 2018. “一带一路”沿线国家农产品贸易的竞争性与互补性: 基于社会网络分析方法[J]. 农业经济问题, ( 2):103-114.
[
|
| [11] |
种照辉, 覃成林 . 2017. “一带一路”贸易网络结构及其影响因素: 基于网络分析方法的研究[J]. 国际经贸探索, ( 5):17-29.
[
|
| [12] |
|
| [13] |
|
| [14] |
|
| [15] |
|
| [16] |
|
| [17] |
|
| [18] |
|
| [19] |
|
| [20] |
|
| [21] |
|
| [22] |
|
| [23] |
|
| [24] |
|
| [25] |
|
| [26] |
|
| [27] |
|
/
| 〈 |
|
〉 |