
Change of rural human resources from 2000 to 2010 in China
Received date: 2018-12-12
Request revised date: 2019-04-10
Online published: 2019-08-25
Supported by
National Natural Science Foundation of China(41871171)
Copyright
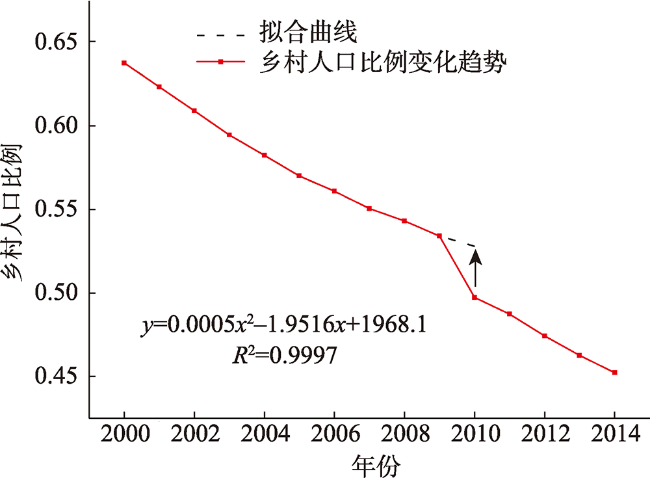
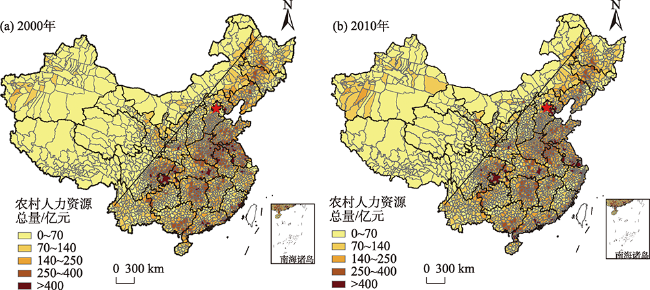
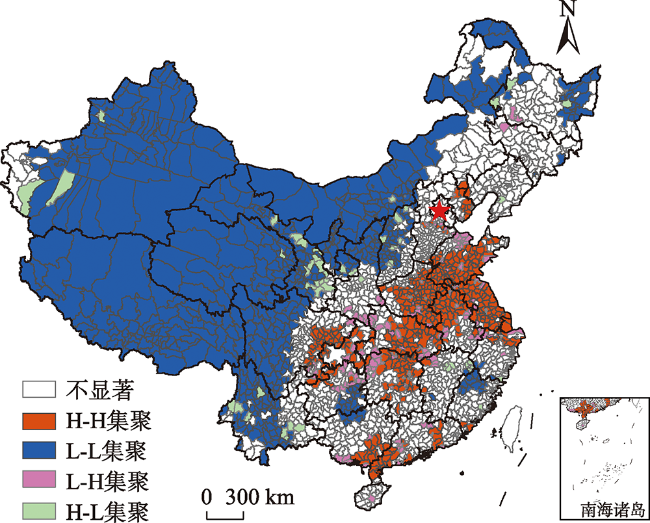
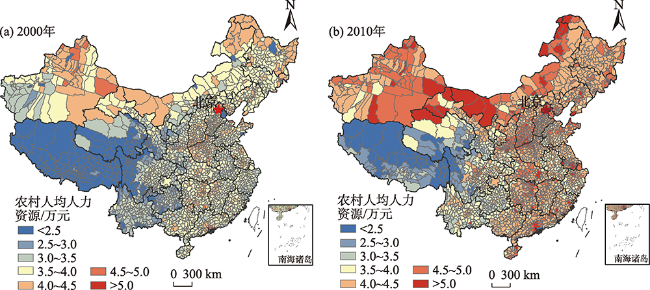
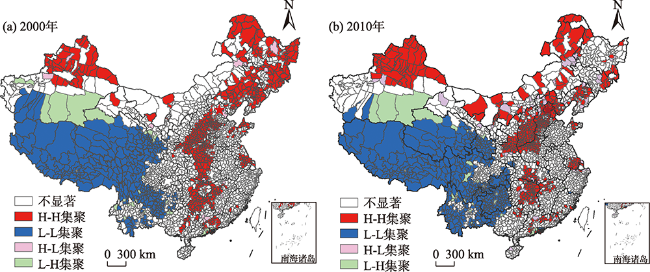
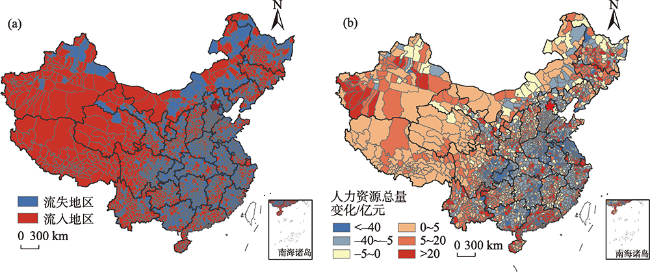
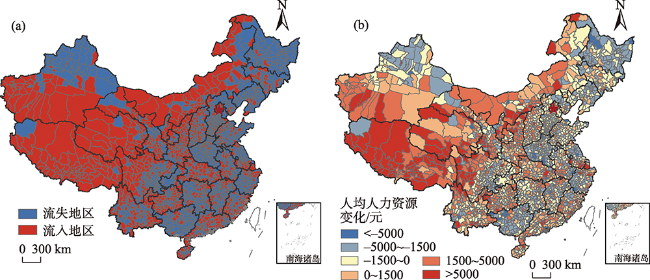
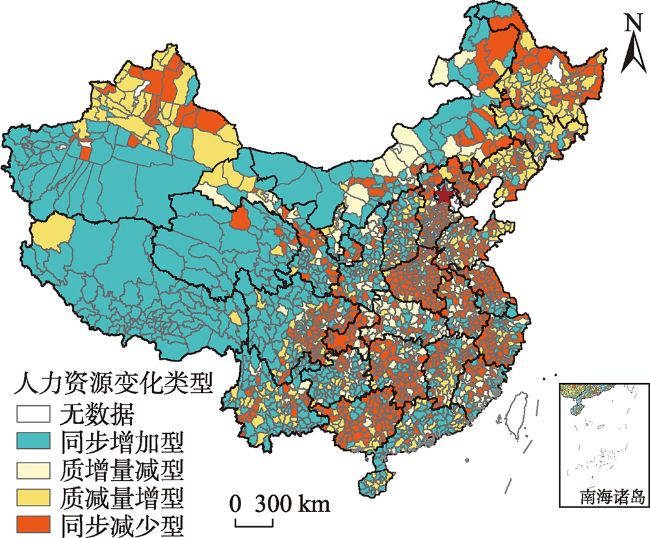
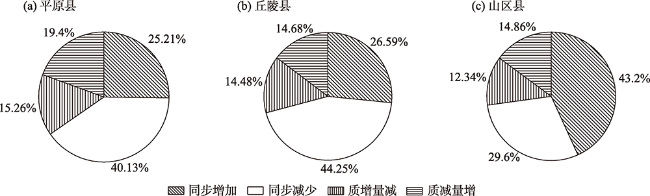
Population structure has changed remarkably in rural China along with rapid urbanization and rural-urban migration. Maintaining population quality in source areas of migration is crucial for rural revitalization and sustainable development. By means of the iterative proportional fitting (IPF) algorithm, this study estimated the number of rural population and their years of education in 2000 and 2010 for 2294 counties of China. The spatial pattern and trend of change of rural human resources of the county units in 2000 and 2010 were analyzed based on the quantitative model of human resources. It is found that: 1) Gross human resources decreased by 3.0% in rural areas in China from 2000-2010. Differences between eastern and western regions and variations at the provincial level were the most obvious spatial differences. Spatial agglomeration was significant and more evenly distributed. 2) Human resources per capita had increased by 17.4% in this decade. The outflow of rural human resources had mostly taken place in central China and Northeast provinces. Rural human resources increased in the western region, the Yangtze River Delta, the Pearl River Delta, and prefecture-level cities; the proportion of areas with decreased per capita human resources exceeded 50%. 3) Based on the change of rural gross and per capita human resources, there are four types of county units, that is, the simultaneously increasing type, the simultaneously decreasing type, the increasing quality and decreasing quantity type, and the decreasing quality and increasing quantity type. Change of human resources in counties of hilly areas, plain areas, major grain production areas, and national-level poverty-stricken counties should be paid particular attention to. The proportion of simultaneously decreasing type in hilly counties and plain counties exceeded 40%. The advantage of gross rural human resources in major grain production areas was obvious but the proportion of counties with decreased per capita human resources reached 64.6%. The proportion of simultaneously increasing type in national-level poverty-stricken counties was 43.9%, but there remained a gap with other counties. Based on the results, the priority for sustainable development of rural areas is to prevent the decrease of human resources of hilly counties, plain counties, and major grain production areas, and to improve the gross human resource level in poverty-stricken counties.
XU Zening , GAO Xiaolu , WU Danxian , LIAO Liuwen . Change of rural human resources from 2000 to 2010 in China[J]. PROGRESS IN GEOGRAPHY, 2019 , 38(8) : 1259 -1270 . DOI: 10.18306/dlkxjz.2019.08.014
表1 2010年全国各级学校生均教育经费统计Tab.1 Average education expense by levels of school in China, 2010 |
| 学校 | 年教育经费 支出/亿元 | 在校学生数 /万人 | 年人均教育经费 支出ej /(元/人) |
|---|---|---|---|
| 普通高等学校 | 5497.9 | 2386 | 23042 |
| 普通高中 | 2003.3 | 2427 | 8254 |
| 普通初中 | 3413.1 | 5276 | 6469 |
| 普通小学 | 4887.1 | 9941 | 4916 |
注:数据来源于《中国统计年鉴(2011)》和《中国统计年鉴(2012)》。 |
表2 2000年和2010年人口普查中乡村受教育程度人口数据的精度统计Tab.2 Spatial accuracy of rural population by educational attainment in 2000 and 2010 census |
| 数据精度 | 2000年 | 2010年 | |||
|---|---|---|---|---|---|
| 县级单元数量(占比) | 覆盖省、市、区(数量) | 县级单元数量(占比) | 覆盖省、市、区(数量) | ||
| 县级 | 808 (28.2%) | 山西、吉林、黑龙江、上海、浙江、河南、海南、西藏、甘肃、青海(10) | 2195 (76.5%) | 北京、天津、山西、内蒙古、吉林、黑龙江、上海、江苏、浙江、安徽、福建、江西、山东、河南、湖北、广东、广西、海南、重庆、贵州、云南、西藏、陕西、甘肃、青海、宁夏(26) | |
| 市级 | 110 (3.9%) | 广西(1) | 501 (17.5%) | 辽宁、湖南、四川、新疆(4) | |
| 省级 | 1944 (67.9%) | 北京、河北、内蒙古、辽宁、江苏、安徽、福建、江西、山东、湖北、湖南、广东、重庆、四川、贵州、云南、陕西、宁夏、新疆(19) | 172 (6.0%) | 河北(1) | |
注:县级单元数量为市辖区未合并的数字;数据不包含香港、澳门和台湾地区,2000年天津市人口普查资料中无乡村受教育程度人口统计数据。 |
表3 粮食主产区和非粮食主产区农村人力资源变化类型统计Tab.3 Rural human resource variation in major and non-major grain production areas |
| 地域类型 | 2010年农村人力 资源总量均值/亿元 | 2010年农村人均 人力资源均值/万元 | 空间单元总数 /个 (%) | 同步增加型 /个 (%) | 质增量减型 /个 (%) | 质减量增型 /个 (%) | 同步减少型 /个 (%) |
|---|---|---|---|---|---|---|---|
| 13个粮食主产区省区 | 140.4 | 4.3 | 1200 (100) | 242 (20.2) | 182 (15.2) | 220 (18.3) | 556 (46.3) |
| 其他省区 | 96.4 | 4.0 | 1054 (100) | 510 (48.4) | 119 (11.2) | 183 (17.4) | 242 (23.0) |
表4 贫困县和非贫困县的农村人力资源变化类型统计Tab.4 Rural human resource variation in national-level poverty-stricken and other counties |
| 地域类型 | 2010年农村人力资源 总量均值/亿元 | 2010年农村人均 人力资源均值/万元 | 空间单元总数 /个 (%) | 同步增加型 /个 (%) | 质增量减型 /个 (%) | 质减量增型 /个 (%) | 同步减少型 /个 (%) |
|---|---|---|---|---|---|---|---|
| 贫困县 | 99.6 | 3.9 | 572 (100) | 251 (43.9) | 75 (13.1) | 70 (12.2) | 176 (30.8) |
| 其他 | 126.6 | 4.3 | 1682 (100) | 501 (29.8) | 226 (13.4) | 333 (19.8) | 622 (37.0) |
| 1 |
杜鹏 . 2005. 基于基尼系数对中国学校教育差距状况的研究[J]. 教育与经济, ( 3):32-36.
[
|
| 2 |
高晓路, 吴丹贤, 许泽宁 , 等. 2015. 中国老龄化地理学综述和研究框架构建[J]. 地理科学进展, 34(12):1480-1494.
[
|
| 3 |
郭瑜 . 2013. 人口老龄化对中国劳动力供给的影响[J]. 经济理论与经济管理, ( 11):49-58.
[
|
| 4 |
黄乾, 李修彪 . 2015. 我国省域人力资本的收敛性分析: 基于三种测算方法的比较[J]. 人口与经济, ( 4):94-106.
[
|
| 5 |
李恩平 . 2012. 基于六普、五普的城镇化人口统计数据修补[J]. 人口与经济, ( 4):64-70.
[
|
| 6 |
李萌, 张佑林, 张国平 . 2007. 中国人力资本区际分布差异实证研究[J]. 教育与经济, ( 1):12-17.
[
|
| 7 |
李玉江 . 2005. 区域人力资本研究 [M]. 北京: 科学出版社.
[
|
| 8 |
廖柳文, 高晓路 . 2018. 人口老龄化对乡村发展影响研究进展与展望[J]. 地理科学进展, 37(5):617-626.
[
|
| 9 |
刘晶 . 2012. 中国人力资本空间分布差异的实证分析[J]. 西北人口, 33(3):33-37.
[
|
| 10 |
杨俊, 李雪松 . 2007. 教育不平等、人力资本积累与经济增长: 基于中国的实证研究[J]. 数量经济技术经济研究, ( 2):37-45.
[
|
| 11 |
张兴华 . 2013. 中国农村剩余劳动力的重新估算[J]. 中国农村经济, ( 8):49-54.
[
|
| 12 |
周一星, 于海波 . 2002. 以“五普”数据为基础对我国城镇化水平修补的建议[J]. 统计研究, ( 4):44-47.
[
|
| 13 |
朱启臻, 杨汇泉 . 2011. 谁在种地: 对农业劳动力的调查与思考[J]. 中国农业大学学报(社会科学版), 28(1):162-169.
[
|
| 14 |
中国国家统计局. 2017. 2016年农民工监测调查报告 [EB/OL]. [ 2018- 11- 01]. .
[ National Bureau of Statistics of China. 2017. 2016 rural migrant workers monitoring survey report.[ 2018-11-01]. ]
|
| 15 |
中国国家统计局. 2017. 第三次全国农业普查主要数据公报 [EB/OL].[2018-11-01]. .
[ National Bureau of Statistics of China. The main data bulletin of the third national agricultural census.[2018-11-01]. . ]
|
| 16 |
|
| 17 |
|
| 18 |
|
| 19 |
|
| 20 |
|
| 21 |
|
| 22 |
|
| 23 |
|
| 24 |
|
| 25 |
|
| 26 |
|
/
| 〈 |
|
〉 |