
Spatiotemporal distribution of high flood risk areas in China, 1736-1911
Received date: 2017-09-04
Request revised date: 2017-11-16
Online published: 2018-04-20
Supported by
National Natural Science Foundation of China, No.41501207, No.41771572, No.41701219
Copyright
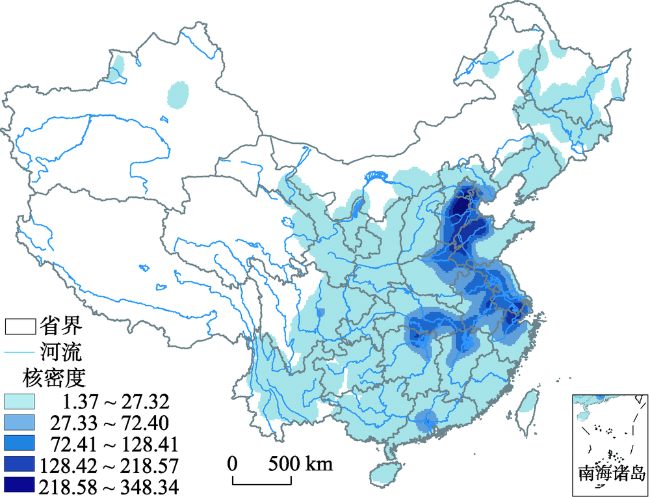
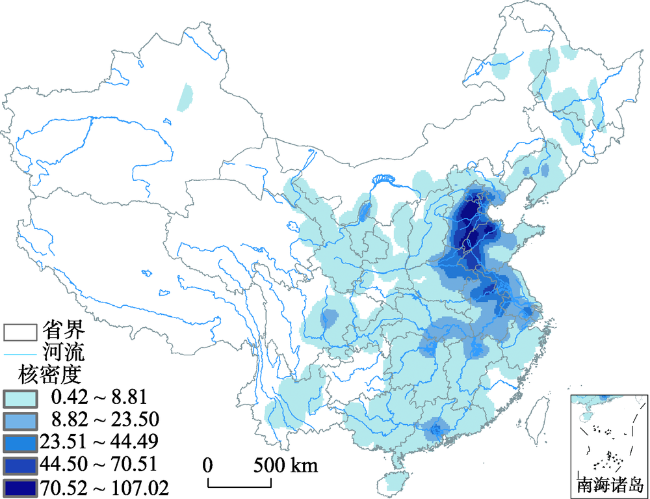
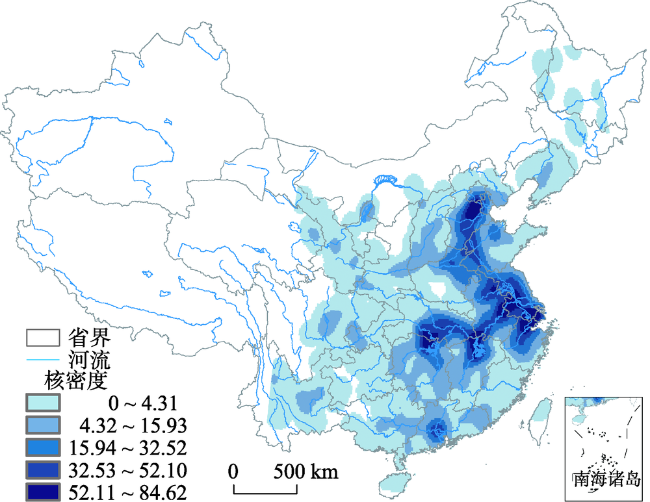
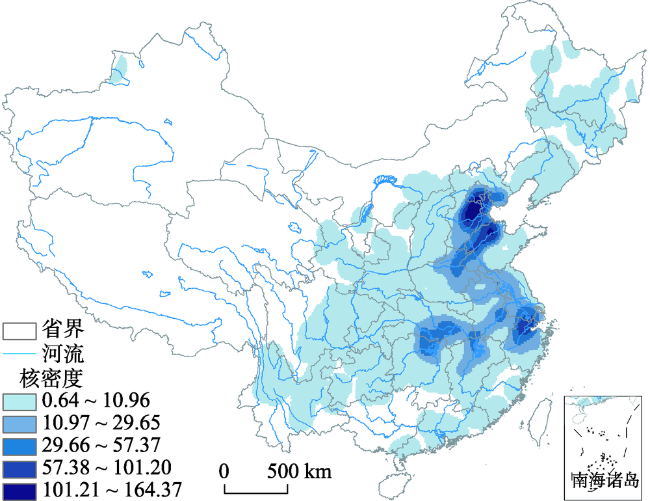
The reconstruction of spatiotemporal distribution of extreme climatic disasters in the past is important for the identification of high risk zones at present, the prediction of change in the future, and improved response to the challenges of climate change. In this study, information about historical floods was extracted from the Qing History, and counties suffered from floods during 1736-1911 were identified year by year, which sum to 8,582. Using the kernel density estimation method, spatial distribution of hotspots where floods occurred frequently during 1736-1911 was reconstructed, and the spatial differences among three periods (1736-1795, 1796-1850, and 1851-1911) were analyzed with the theoretical framework of disaster risk developed by the Intergovernmental Panel on Climate Change (IPCC). It is found that the main high risk areas during 1736-1911were the lower reaches of the Yellow River and the Hai River on the North China Plain, the lower reach of the Huai River, and the three great plains (Jianghan-Dongting Lake, Poyang Lake, and Tai Lake) in the middle-lower Yangtze River Basin and riparian areas, and the spatial pattern of floods was slightly different from the modern time. The lower Yellow River and Hai River were the most significant hotspots where floods were concentrated. It was partly because in the 18th and the 19th centuries the annual precipitation in the North China Plain was more than the 20th century, and the high vulnerability of regional socioeconomic system throughout the 19th century also played a negative role in damage control. After the Yellow River changed its course in 1855, new levees were not built until the 1870s because of social unrest and financial crisis, which led to a new high risk area with a banding distribution along the course of the Yellow River in northeast Shandong Province. In the 19th century, flood occurred much more frequently in the middle-lower Yangtze River Basin than the 18th century. On the one hand, due to the change of Meiyu, extreme precipitation events significantly increased in the area; on the other hand, inappropriate agricultural development (such as diked field) led to rapid disappearance of natural wetlands and lakes, which meant higher water level in flood period and more exposure to flood.
XIAO Lingbo . Spatiotemporal distribution of high flood risk areas in China, 1736-1911[J]. PROGRESS IN GEOGRAPHY, 2018 , 37(4) : 495 -503 . DOI: 10.18306/dlkxjz.2018.04.005
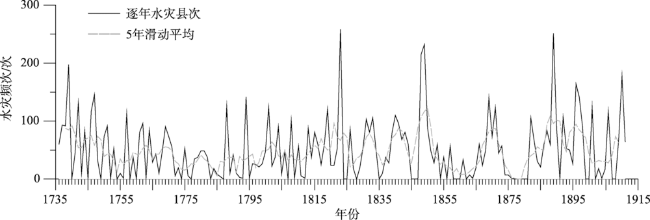
Fig.1 Frequency series of floods in China, 1736-1911图1 1736-1911年中国水灾频次序列 |
Fig.2 Kernel density distribution of flood frequency in China, 1736-1911图2 1736-1911年中国水灾频次核密度分布 |
Fig.3 Kernel density distribution of flood frequency in China, 1736-1795图3 1736-1795年中国水灾频次核密度分布 |
Fig.4 Kernel density distribution of flood frequency in China, 1796-1850图4 1796-1850年中国水灾频次核密度分布 |
Fig.5 Kernel density distribution of flood frequency in China, 1851-1911图5 1851-1911年中国水灾频次核密度分布 |
The authors have declared that no competing interests exist.
| [1] |
[
|
| [2] |
[
|
| [3] |
[
|
| [4] |
[
|
| [5] |
[
|
| [6] |
[
|
| [7] |
[
|
| [8] |
[
|
| [9] |
[
|
| [10] |
[
|
| [11] |
[
|
| [12] |
[
|
| [13] |
[
|
| [14] |
[
|
| [15] |
[
|
| [16] |
[
|
| [17] |
[
|
| [18] |
[
|
| [19] |
[
|
| [20] |
[
|
| [21] |
[
|
| [22] |
[
|
| [23] |
[
|
| [24] |
[
|
| [25] |
[
|
| [26] |
[
|
| [27] |
中央气象局气象科学研究院. 1981. 中国近五百年旱涝分布图集[M]. 北京: 地图出版社.
[Chinese Academy of Meteorological Sciences. 1981. Yearly charts of dryness/wetness in China for the last 500-year period[M]. Beijing, China: Cartographic Publishing House.]
|
| [28] |
[
|
| [29] |
[
|
| [30] |
[
|
| [31] |
|
| [32] |
|
| [33] |
|
| [34] |
|
| [35] |
|
/
| 〈 |
|
〉 |