
Investigating spatiotemporal patterns of passenger flows in the Beijing metro system from smart card data
Received date: 2017-07-05
Request revised date: 2018-01-08
Online published: 2018-03-28
Supported by
National Natural Science Foundation of China, No.41701132
Strategic Priority Research Program of the Chinese Academy of Sciences, No.XDA19040402
Copyright
Urban railway systems can reduce environmental footprints by residents' commuting and alleviate traffic congestion in mega-cities. Investigating the characteristics of the spatiotemporal distribution of passenger flows is significant in the examination of traffic demand in public transportation systems. Moreover, the study can help decision makers in traffic demand management. Taking the metro system of Beijing as an example, this study calculated the travel time of over 4 million trips and their origin-destination (OD) matrix. In the investigation of the spatiotemporal patterns, we found that: (1) travel time distribution of all trips and trips during the morning and afternoon peaks well fit with Gamma distribution; (2) patterns of passenger flows between districts or ring roads are symmetric; and (3) spatial inequity has been captured from the evaluation of average transit trips per person per day.
HUANG Jie , WANG Jiaoe , JIN Haitao , JIN Fengjun . Investigating spatiotemporal patterns of passenger flows in the Beijing metro system from smart card data[J]. PROGRESS IN GEOGRAPHY, 2018 , 37(3) : 397 -406 . DOI: 10.18306/dlkxjz.2018.03.010
Tab. 1 Examples of data records of smart cards in Beijing metro system表1 北京市智能交通卡刷卡数据示例 |
| 卡号 | 检入线路 | 检入站点 | 刷卡时间 | 刷卡次序 | 检出线路 | 检出站点 | 检入时间 | 是否包含终点 |
|---|---|---|---|---|---|---|---|---|
| 00000002 | 13 | 33 | 2014/04/14 10:44:00 | 7387916344 | 0 | 0 | 2014/04/14 10:44:00 | 0 |
| 00000002 | 13 | 33 | 2014/04/14 11:22:27 | 7388858193 | 3 | 31 | 2014/04/14 10:44:00 | 1 |
注:*13号线31站点表示西二旗站,33站点表示龙泽站;检出线路0和检出站点0表示数据无记录。 |
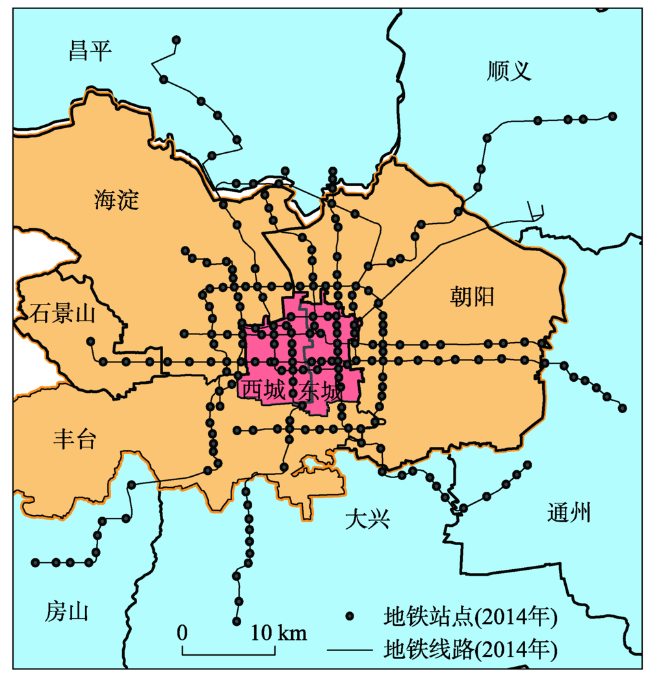
Fig.1 Map of municipal districts studied and the metro system in Beijing图1 研究区域与北京市地铁线路和站点分布图 |
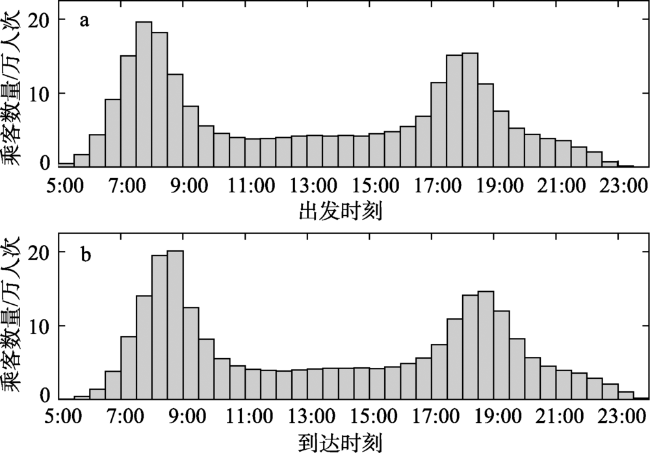
Fig.2 Total passengers in every 30 minutes in the Beijing metro system图2 北京市地铁分时段进出乘客数量 |
Tab.2 Statistic attributes of travel time表2 乘客出行时间的基本属性 |
| 时段 | 平均值(min) | 标准偏差(min) |
|---|---|---|
| 全天 | 38.9817 | 21.8475 |
| 早高峰 | 35.5971 | 17.3755 |
| 晚高峰 | 33.7665 | 18.6590 |
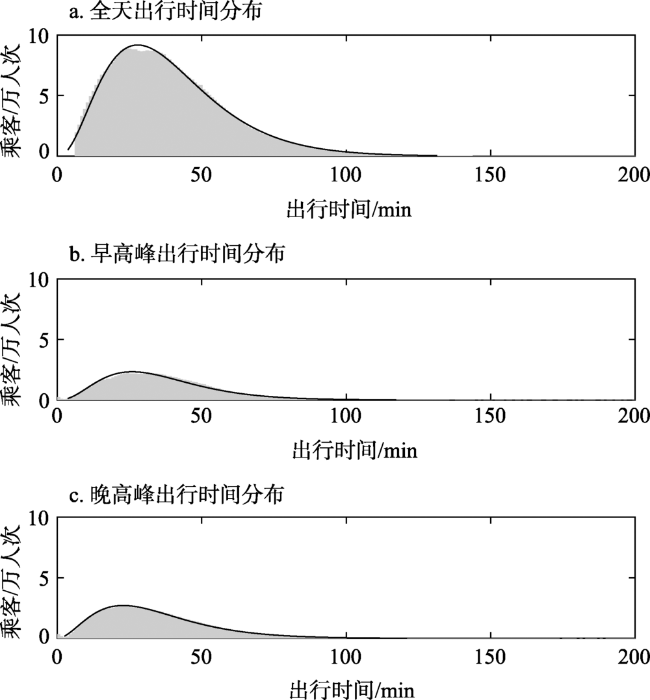
Fig.3 Distribution of travel time and fitting results from Gamma distribution图3 乘客出行时间分布及Gamma分布拟合结果 |
Tab.3 Fitting parameters of Gamma distribution and 95% confidence interval表3 Gamma分布拟合系数和置信区间 |
| 时段 | 形状参数 | 95%置信区间 | 比例参数 | 95%置信区间 | ||
|---|---|---|---|---|---|---|
| 下限 | 上限 | 下限 | 上限 | |||
| 全天 | 3.4945 | 3.4900 | 3.4990 | 11.1551 | 11.1397 | 11.1705 |
| 早高峰 | 3.6509 | 3.6410 | 3.6608 | 9.7629 | 9.7346 | 9.7912 |
| 晚高峰 | 3.0142 | 3.0067 | 3.0217 | 11.2505 | 11.2201 | 11.2810 |
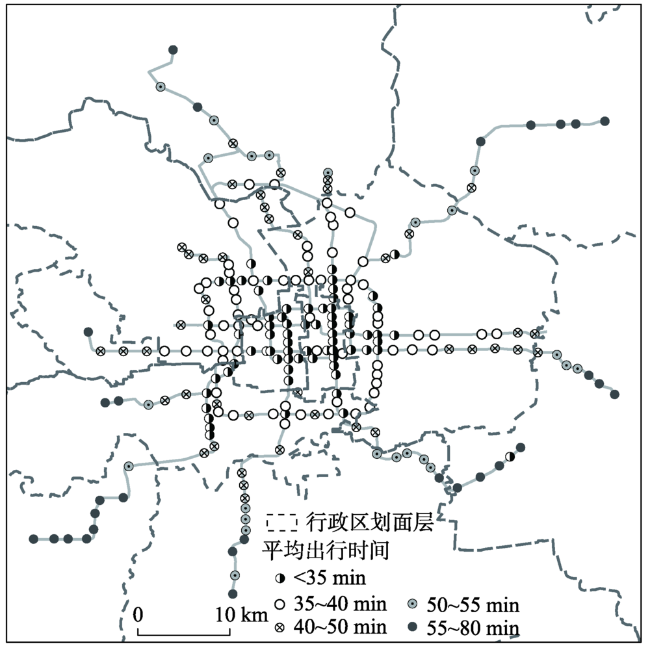
Fig.4 Distribution of average travel time at each metro station图4 基于进站点的平均出行时间分布 |
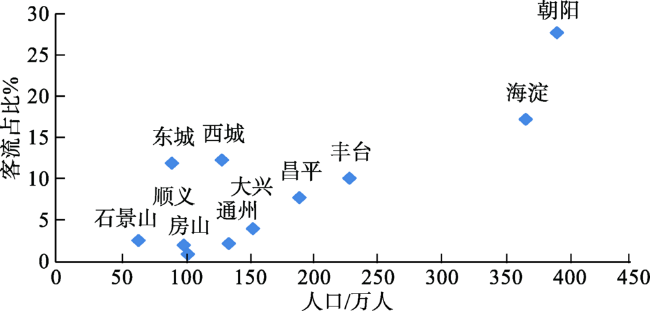
Fig.5 The correlation between population size and the number of passengers in municipal districts in Beijing图5 北京市辖区人口与地铁客流相关性 |
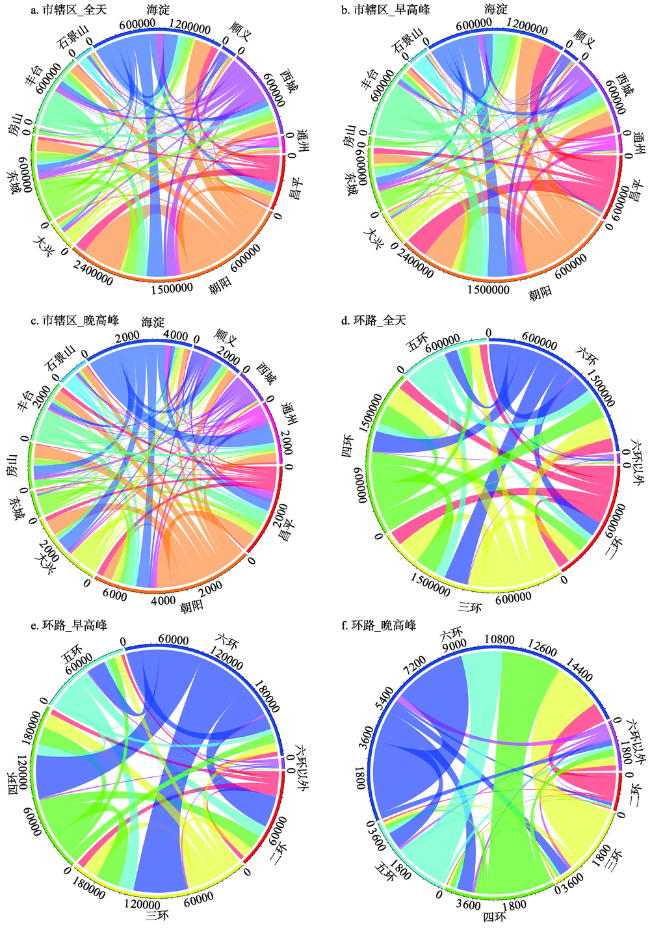
Fig.6 Origin-destination (OD) flows of the metro system in Beijing图6 北京地铁客流的时空分布 |
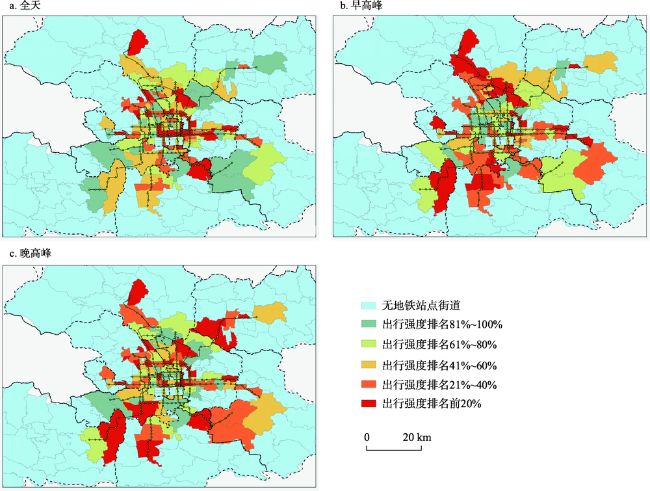
Fig.7 Analysis of commuting frequencies by transit in street-based communities图7 基于街道人口的平均乘坐地铁出行强度分析 |
The authors have declared that no competing interests exist.
| [1] |
[
|
| [2] |
[
|
| [3] |
[
|
| [4] |
[
|
| [5] |
[
|
| [6] |
[
|
| [7] |
[
|
| [8] |
[
|
| [9] |
[
|
| [10] |
[
|
| [11] |
[
|
| [12] |
[
|
| [13] |
[
|
| [14] |
[
|
| [15] |
|
| [16] |
|
| [17] |
|
| [18] |
|
| [19] |
|
| [20] |
|
| [21] |
|
| [22] |
|
| [23] |
|
| [24] |
|
| [25] |
|
| [26] |
|
| [27] |
|
| [28] |
|
| [29] |
|
| [30] |
|
| [31] |
|
| [32] |
|
| [33] |
|
| [34] |
|
/
| 〈 |
|
〉 |