
Impact of public services on housing prices in different functional spaces:A case study of metropolitan Chengdu
Online published: 2017-08-28
Supported by
National Natural Science Foundation of China, No.41471469, No.41601141
Presidential Foundation of the Chinese Academy of Sciences, China(2017)
Soft Science Research Projects of Science and Technology Office of Sichuan Province, No.2015ZR0115
Copyright
In China, the rise of housing prices has become one of the most pressing issues that residents encountered in recent years and received considerable attention. Regulating housing prices and preventing them from overheating have become an urgent question in some regions. This study examined the impact of public service provision on the spatiotemporal patterns of housing prices and its explanatory power in Chengdu City, Sichuan Province. A dataset of Chengdu housing prices and selected public service factors were constructed for the year 2016, and geographical detector technique was adopted in this study. The results indicate that the average housing price was 8480 yuan/m2 in Chengdu in 2016, and it showed a progressive decrease from the city center to the suburbs between the traffic circles and along the radial arteries, forming the circular and radial patterns. In general, housing prices were high in the western and southern parts while low in the eastern and north parts of the city. The impact of public service provision (mainly health care, financing, and education services) on housing prices was most pronounced in the third circular zone and southwest of the downtown area, where it was higher than the overall impact in Chengdu downtown areas. The impact of public services on housing prices was significantly affected by the difference of spatial functions in different zones. Differences in public service provision and spatial functions will further deepen the differentiation pattern of housing prices, and promote the overheating of local property prices. We argue that a better understanding of the influence of public services on housing prices will help Chinese policymakers not only to formulate traditional financial and economic policies, but also to optimize spatial functions and public services.
ZHANG Shaoyao , SONG Xueqian , DENG Wei . Impact of public services on housing prices in different functional spaces:A case study of metropolitan Chengdu[J]. PROGRESS IN GEOGRAPHY, 2017 , 36(8) : 995 -1005 . DOI: 10.18306/dlkxjz.2017.08.008
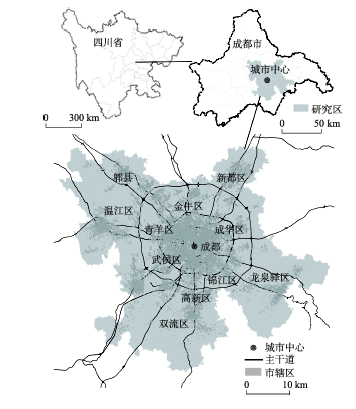
Fig.1 The study area图1 研究区概况图 |
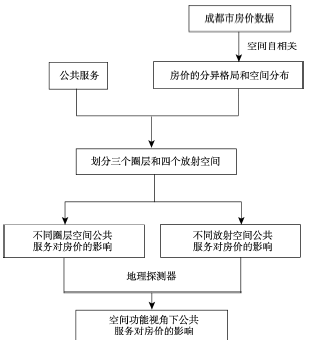
Fig.2 Flow chart of the assessment图2 研究设计图 |
Table.1 Public service categories and public service facilities表1 公共服务类别与具体公共服务设施 |
| 公共服务类别 | 工作 | 教育 | 医疗 | 交通出行 | 文化娱乐 | 金融理财 | 生活购物 |
|---|---|---|---|---|---|---|---|
| 具体公共 服务设施 | 公司企业、政府部门 | 幼儿园、小学、中学、大学 | 综合医院、专科医院、诊所 | 道路、公交站、停车场 | 文化宫和博物馆、公园 | ATM、银行、金融机构 | 餐馆、商场、酒店 |
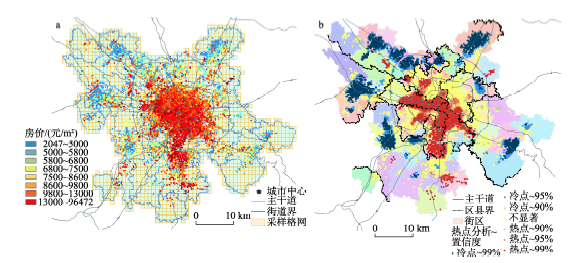
Fig.3 Spatial differentiation of housing prices in Chengdu City (a) and hotspot analysis (b)图3 成都市房价的空间分布(a)和热点分析(b) |
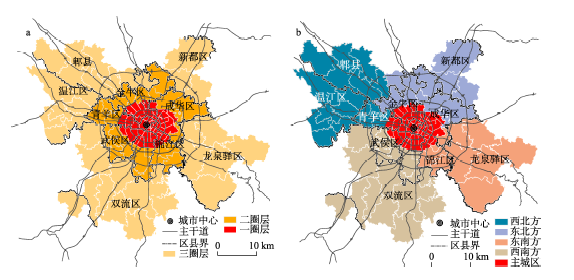
Fig.4 Circular and radiating zones delineated by the ring roads and main roads radiating from the city center of Chengdu图4 成都市圈层格局和放射格局 |
Table.2 Average housing prices of different zones encircled by the ring roads of Chengdu City (unit: yuan/m2)表2 不同圈层上成都平均房价/(元/m2) |
| 圈层结构 | 圈层 | 一圈层 | 二圈层 | 三圈层 | 整体区域 |
|---|---|---|---|---|---|
| 均价 | 10287 | 9748 | 7022 | 8480 | |
| 标准差 | 3699 | 5328 | 4120 | 4628 |
Table.3 Average housing prices of different zones along the main roads radiating from the city center of Chengdu (unit: yuan/m2)表3 不同放射方向上成都平均房价/(元/m2) |
| 放射结构 | 方向 | 西南 | 东南 | 东北 | 西北 |
|---|---|---|---|---|---|
| 均价 | 9191 | 7990 | 7533 | 6744 | |
| 标准差 | 5782 | 4620 | 4051 | 3756 |
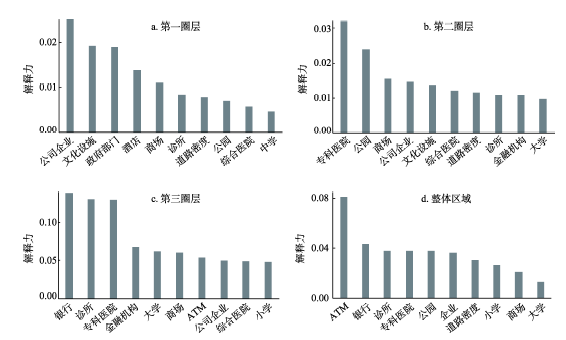
Fig.5 Housing prices explained by the provision of public services in different circular zones of Chengdu City图5 不同圈层公共服务对房价解释力 |
Table.4 Housing prices explained by the provision of public service factors in different circular zones of Chengdu City and confidence level表4 不同圈层上公共服务解释力(q)及置信度(p) |
| 第一圈层 | 第二圈层 | 第三圈层 | 整体区域 | ||||||||
|---|---|---|---|---|---|---|---|---|---|---|---|
| 因子 | q | p | 因子 | q | p | 因子 | q | p | 因子 | q | p |
| 公司企业 | 0.0250* | 0.0000 | 专科医院 | 0.0318* | 0.0000 | 银行 | 0.1387* | 0.0000 | ATM | 0.0810* | 0.0000 |
| 文化设施 | 0.0193* | 0.0112 | 公园 | 0.0240* | 0.0325 | 诊所 | 0.1307* | 0.0032 | 银行 | 0.0435 | 0.3649 |
| 政府部门 | 0.0188* | 0.0024 | 商场 | 0.0157* | 0.0067 | 专科医院 | 0.1301* | 0.0000 | 诊所 | 0.0381 | 0.8911 |
| 酒店 | 0.0140 | 0.1699 | 公司企业 | 0.0147* | 0.0040 | 金融机构 | 0.0680* | 0.0000 | 专科医院 | 0.0381 | 0.7273 |
| 商场 | 0.0112 | 0.0751 | 文化设施 | 0.0137* | 0.0026 | 大学 | 0.0625* | 0.0000 | 公园 | 0.0379* | 0.0000 |
| 诊所 | 0.0084 | 0.1949 | 综合医院 | 0.0120 | 0.6489 | 商场 | 0.0611* | 0.0000 | 企业 | 0.0368* | 0.0000 |
| 道路密度 | 0.0079 | 0.7662 | 道路密度 | 0.0116 | 0.0924 | ATM | 0.0540* | 0.0000 | 道路密度 | 0.0306* | 0.0000 |
| 公园 | 0.0071 | 0.1805 | 诊所 | 0.0109* | 0.0390 | 公司企业 | 0.0502* | 0.0000 | 小学 | 0.0267* | 0.0000 |
| 综合医院 | 0.0057 | 0.6585 | 金融机构 | 0.0106 | 0.0718 | 综合医院 | 0.0493* | 0.0000 | 商场 | 0.0215* | 0.0043 |
| 中学 | 0.0047 | 0.1748 | 大学 | 0.0098 | 0.3616 | 小学 | 0.0484* | 0.0000 | 大学 | 0.0134* | 0.0023 |
| 停车场 | 0.0033 | 0.7667 | 公交站 | 0.0066 | 0.1657 | 幼儿园 | 0.0444* | 0.0000 | 金融机构 | 0.0115* | 0.0025 |
| ATM | 0.0025 | 0.7138 | 中学 | 0.0056 | 0.2890 | 餐馆 | 0.0443* | 0.0000 | 政府部门 | 0.0093* | 0.0000 |
| 金融机构 | 0.0024 | 0.7978 | ATM | 0.0052 | 0.3843 | 中学 | 0.0404* | 0.0000 | 停车场 | 0.0088* | 0.0000 |
| 大学 | 0.0016 | 0.8776 | 餐馆 | 0.0031 | 0.4899 | 酒店 | 0.0365* | 0.0000 | 餐馆 | 0.0076 | 0.4029 |
| 小学 | 0.0013 | 0.8761 | 幼儿园 | 0.0025 | 0.7851 | 道路密度 | 0.0337* | 0.0000 | 中学 | 0.0073 | 0.1348 |
| 公交站 | 0.0012 | 0.9573 | 政府机构 | 0.0009 | 0.9166 | 文化设施 | 0.0300* | 0.0000 | 幼儿园 | 0.0045 | 0.0891 |
| 幼儿园 | 0.0008 | 0.9817 | 停车场 | 0.0006 | 0.9915 | 停车场 | 0.0286* | 0.0000 | 酒店 | 0.0045* | 0.0120 |
| 餐馆 | 0.0002 | 0.9733 | 银行 | 0.0002 | 0.9878 | 政府机构 | 0.0236* | 0.0000 | 综合医院 | 0.0040 | 0.3767 |
| 银行 | 0.0000 | 0.9551 | 小学 | 0.0001 | 0.9934 | 公交站 | 0.0190* | 0.0000 | 文化设施 | 0.0034 | 0.4094 |
| 专科医院 | 0.0000 | 0.9871 | 酒店 | 0.0001 | 0.9620 | 公园 | 0.0051 | 0.8104 | 公交站 | 0.0026 | 0.1869 |
注:*表示在0.05的置信度上统计显著。 |
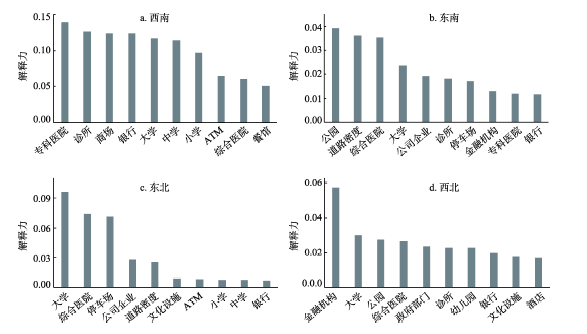
Table.5 Housing prices explained by the provision of public services in different directions along the main radiating roads of Chengdu City and confidence level表5 不同方向上公共服务因子解释力(q)及置信度(p) |
| 西南 | 东南 | 东北 | 西北 | ||||||||
|---|---|---|---|---|---|---|---|---|---|---|---|
| 因子 | q | p | 因子 | q | p | 因子 | q | p | 因子 | q | p |
| 专科医院 | 0.1394* | 0.0067 | 公园 | 0.0393 | 0.0740 | 大学 | 0.0960* | 0.0000 | 金融机构 | 0.0575* | 0.0000 |
| 诊所 | 0.1266 | 0.1117 | 道路密度 | 0.0360* | 0.0076 | 综合医院 | 0.0737* | 0.0000 | 大学 | 0.0303 | 0.1072 |
| 商场 | 0.1241 | 0.0642 | 综合医院 | 0.0353 | 0.0872 | 停车场 | 0.0713* | 0.0277 | 公园 | 0.0275 | 0.2393 |
| 银行 | 0.1236 | 0.0878 | 大学 | 0.0236 | 0.3519 | 公司企业 | 0.0279* | 0.0000 | 综合医院 | 0.0264* | 0.0310 |
| 大学 | 0.1166 | 0.2988 | 公司企业 | 0.0192 | 0.1489 | 道路密度 | 0.0255 | 0.0552 | 政府机构 | 0.0236* | 0.0000 |
| 中学 | 0.1142 | 0.1982 | 诊所 | 0.0181* | 0.0241 | 文化设施 | 0.0088 | 0.2071 | 诊所 | 0.0231* | 0.0437 |
| 小学 | 0.0966 | 0.6664 | 停车场 | 0.0170 | 0.5457 | ATM | 0.0082 | 0.7248 | 幼儿园 | 0.0228* | 0.0304 |
| ATM | 0.0649* | 0.0000 | 金融机构 | 0.0129 | 0.3790 | 小学 | 0.0077 | 0.3561 | 银行 | 0.0200* | 0.0000 |
| 综合医院 | 0.0600* | 0.0000 | 诊所 | 0.0119 | 0.1267 | 中学 | 0.0074 | 0.5692 | 文化设施 | 0.0180* | 0.0128 |
| 餐馆 | 0.0509* | 0.0000 | 银行 | 0.0116 | 0.1543 | 银行 | 0.0068 | 0.2857 | 酒店 | 0.0172* | 0.0046 |
| 金融机构 | 0.0495* | 0.0227 | 幼儿园 | 0.0108 | 0.2363 | 公园 | 0.0062 | 0.8610 | 小学 | 0.0141 | 0.5092 |
| 公园 | 0.0441* | 0.0000 | 餐馆 | 0.0106 | 0.2605 | 酒店 | 0.0054 | 0.3398 | 停车场 | 0.0116 | 0.2723 |
| 公司企业 | 0.0385* | 0.0000 | 文化设施 | 0.0096 | 0.4849 | 幼儿园 | 0.0052 | 0.8092 | 公司企业 | 0.0098 | 0.6152 |
| 幼儿园 | 0.0311* | 0.0000 | 酒店 | 0.0078 | 0.5019 | 商场 | 0.0027 | 0.7411 | 诊所 | 0.0090 | 0.3210 |
| 公交站 | 0.0264* | 0.0000 | ATM | 0.0076 | 0.6185 | 诊所 | 0.0021 | 0.8423 | ATM | 0.0082 | 0.4160 |
| 文化设施 | 0.0232 | 0.0672 | 小学 | 0.0059 | 0.6026 | 金融机构 | 0.0021 | 0.9336 | 道路密度 | 0.0063 | 0.5144 |
| 酒店 | 0.0216* | 0.0000 | 政府机构 | 0.0029 | 0.8794 | 公交站 | 0.0015 | 0.8648 | 商场 | 0.0041 | 0.7936 |
| 停车场 | 0.0164 | 0.0915 | 中学 | 0.0026 | 0.8737 | 政府机构 | 0.0009 | 0.8824 | 餐馆 | 0.0028 | 0.7482 |
| 道路密度 | 0.0140 | 0.1179 | 公交站 | 0.0018 | 0.8382 | 专科医院 | 0.0008 | 0.8557 | 中学 | 0.0023 | 0.9385 |
| 政府机构 | 0.0095 | 0.0507 | 商场 | 0.0016 | 0.9417 | 餐馆 | 0.0007 | 0.9168 | 公交站 | 0.0018 | 0.8545 |
注:*表示在0.05的置信度上统计显著。 |
Fig.6 Housing prices explained by the provision of public services in different directions along the mainradiating roads of Chengdu City 图6 不同方向上公共服务因子对房价解释力② |
The authors have declared that no competing interests exist.
| 1 |
[
|
| 2 |
[
|
| 3 |
[
|
| 4 |
[
|
| 5 |
|
| 6 |
|
| 7 |
[
|
| 8 |
|
| 9 |
[
|
| 10 |
[
|
| 11 |
[
|
| 12 |
[
|
| 13 |
[
|
| 14 |
[
|
| 15 |
[
|
| 16 |
[
|
| 17 |
|
| 18 |
|
| 19 |
[
|
| 20 |
[
|
| 21 |
|
| 22 |
[
|
| 23 |
[
|
| 24 |
|
| 25 |
[
|
| 26 |
|
| 27 |
|
| 28 |
|
| 29 |
|
| 30 |
|
| 31 |
|
| 32 |
|
| 33 |
|
| 34 |
|
| 35 |
|
| 36 |
|
| 37 |
|
| 38 |
|
| 39 |
|
/
| 〈 |
|
〉 |