
Use of community networks and its impact on community participation: A case study of Nanjing City
Received date: 2016-08-01
Request revised date: 2017-02-01
Online published: 2017-07-31
Supported by
National Natural Science Foundation of China, No.41571146]
Copyright
In the 1970s, the United States launched a large number of practices and research focusing on "community network" in community informatics area. In recent years, with the rapid penetrating of information and communication technology in the daily life of community residents, virtual network platforms based on the community entity also appear in large numbers in urban communities of China, which brings an opportunity to improve community participation of urban residents. However, research by Chinese scholars rarely concerned with community networks, especially that quantitative research in this area has been few. Under this background and taking into consideration the practice of community networks in China, this study analyzed the characteristics of community network use and community participation of residents in Nanjing City based on a sample survey. Furthermore, the study used multiple-linear regression method to investigate the factors influencing community participation. The survey was conducted in 35 communities of Nanjing City by a research group at Nanjing University. The results show that overall community network use was characterized by high popularity and low intensity. Although the average coverage of community network use of Nanjing residents was high, the intensity of use only remained at the "occasional use" level. Most users were from newly built communities. As for the usage type of community networks, "mobile Internet" was most popular among the residents, and community QQ/WeChat groups showed the highest use intensity, followed by community Official Accounts/APPs, and community websites/community forums had the lowest use intensity. With regard to community "O2O", community participation was significantly promoted by using community networks. The use of community networks will enhance the depth of participation by promoting transaction type community participation. This article proposes that smart community development should compensate for the lack of attention to community networks and community involvement, and facilitate a return to community public life through participation in community activities that increases the vitality of communities.
CHANG Enyu , ZHEN Feng , SUN Chen . Use of community networks and its impact on community participation: A case study of Nanjing City[J]. PROGRESS IN GEOGRAPHY, 2017 , 36(7) : 785 -794 . DOI: 10.18306/dlkxjz.2017.07.001
Tab.1 Sample description表1 样本统计性描述 |
| 变量 | 样本量 | 比例% | 变量 | 样本量 | 比例% |
|---|---|---|---|---|---|
| 性别 | 硕士及以上 | 177 | 14.08 | ||
| 男性 | 611 | 48.61 | 家庭总计年收入 | ||
| 女性 | 646 | 51.39 | <5万 | 186 | 14.80 |
| 年龄 | 5~10万 | 325 | 25.86 | ||
| ≤24岁 | 203 | 16.15 | 10~20万 | 430 | 34.21 |
| 25~44岁 | 747 | 59.43 | 20~30万 | 178 | 14.16 |
| 45~59岁 | 179 | 14.24 | >30万 | 117 | 9.31 |
| ≥60岁 | 129 | 10.26 | 社区类型 | ||
| 受教育水平 | 新型商品房社区 | 617 | 49.09 | ||
| 小学及以下 | 25 | 1.99 | 老旧商品房社区 | 197 | 15.67 |
| 初中 | 135 | 10.74 | 单位改制房社区 | 167 | 13.29 |
| 高中/中专 | 208 | 16.55 | 保障房社区 | 276 | 21.96 |
| 大专/本科 | 708 | 56.32 |
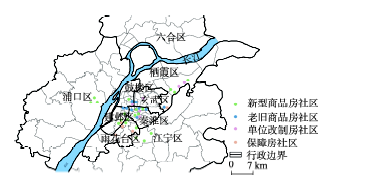
Fig.1 Location of the studied communities图1 调研社区分布图 |
Tab.3 Usage intensity of community networks表3 社区网络的使用强度分布 |
| 年龄 | 社区网络使用强度 | 受教育水平 | 社区网络使用强度 |
|---|---|---|---|
| 25岁以下 | 2.61 | 初中及以下 | 1.60 |
| 25~45 | 2.36 | 高中 | 2.12 |
| 45~60 | 1.89 | 本科/大专 | 2.42 |
| 60岁以上 | 1.62 | 研究生及以上 | 2.34 |
| 平均值 | 2.12 | 平均值 | 2.12 |
注:1~5分分别代表从不、偶尔、一般、较多、非常频繁。 |
Tab.2 Measurement index system of community network usage表2 社区参与度测度指标体系 |
| 一级变量 | 二级变量 | 具体测度问题 |
|---|---|---|
| 社区参与度 | 信息查找 | 查找社区文化教育类活动的频率 |
| 查找社区娱乐休闲类活动的频率 | ||
| 查找社区志愿/公益类活动的频率 | ||
| 查找社区公共事务类活动的频率 | ||
| 参与活动 | 参与文化教育类活动的频率 | |
| 参与娱乐休闲类活动的频率 | ||
| 参与社区志愿/公益类活动的频率 | ||
| 参与社区公共事务类活动的频率 | ||
| 社区组织 | 参与网上社区组织的数量(如社区QQ群、社区微信群等) | |
| 参与过的线下社区组织的数量 |
Tab.4 Usage type of community networks表4 社区网络媒介类型使用特征分布 |
| 社区类型 | 社区QQ群/微信群 | 社区网站/ 论坛 | 社区公众号/APP | 总体 |
|---|---|---|---|---|
| 新型商品房社区 | 2.75 | 2.26 | 2.52 | 2.51 |
| 老旧商品房社区 | 2.41 | 2.06 | 2.01 | 2.16 |
| 单位型社区 | 1.99 | 1.79 | 1.75 | 1.84 |
| 保障房社区 | 2.10 | 1.92 | 1.88 | 1.97 |
| 总体 | 2.32 | 2.01 | 2.04 | 2.12 |
注:1~5分分别代表从不、偶尔、一般、较多、非常频繁。 |
Tab.5 Levels of community participation表5 不同类型社区的社区参与度分布 |
| 参与度 | 极高/% | 较高/% | 一般/% | 较低/% | 极低/% | 平均值 |
|---|---|---|---|---|---|---|
| 新型商品房社区 | 3.2 | 5.7 | 20.6 | 51.9 | 18.7 | 0.35 |
| 老旧商品房社区 | 1.2 | 7.2 | 22.9 | 48.2 | 20.5 | 0.33 |
| 单位型社区 | 1.2 | 10.2 | 28.7 | 40.7 | 19.2 | 0.37 |
| 保障房社区 | 2.2 | 6.9 | 26.1 | 45.7 | 19.2 | 0.35 |
| 总体 | 2.0 | 7.5 | 24.6 | 46.6 | 19.4 | 0.35 |
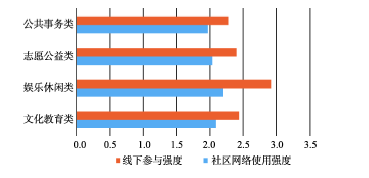
Fig.2 Participation rate of online and offline community participation types图2 线上线下社区活动类型的参与率分布 |
Tab.6 Community participation and characteristics of community network use表6 社区参与度与社区网络使用特征 |
| 社区参与度 | 极高 | 较高 | 一般 | 较低 | 低 |
|---|---|---|---|---|---|
| 社区网络使用强度 | 3.53 | 2.58 | 2.28 | 2.24 | 1.96 |
| 社区网络使用率/% | 90.0 | 72.9 | 72.8 | 68.9 | 58.4 |
Tab.7 Results of multiple regression model of influencing factors of community participation表7 社区参与影响因素的多元回归模型 |
| 自变量 | 模型一 | 模型二 | |||||
|---|---|---|---|---|---|---|---|
| 系数(B) | 标准误差 | Beta | 系数(B) | 标准误差 | Beta | ||
| (常量) | -0.225 | 0.039 | -0.174 | 0.034 | |||
| 社区网络的类型 | |||||||
| 社区网站/论坛 | 0.010* | 0.005 | 0.059 | ||||
| 社区QQ群/微信群 | 0.024** | 0.010 | 0.061 | ||||
| 社区公众号/APP | 0.030*** | 0.005 | 0.197 | ||||
| 社区网络的用途 | |||||||
| 文化教育类 | 0.016** | 0.007 | 0.098 | ||||
| 休闲娱乐类 | 0.009 | 0.006 | 0.060 | ||||
| 公益志愿类 | 0.023*** | 0.007 | 0.132 | ||||
| 公共事务类 | 0.035*** | 0.007 | 0.193 | ||||
| 社区组织信任度 | |||||||
| 社区居委会 | 0.035*** | 0.006 | 0.163 | 0.032*** | 0.006 | 0.151 | |
| 物业管理部门 | 0.000 | 0.006 | 0.001 | -0.005 | 0.005 | -0.028 | |
| 业主委员会 | 0.000 | 0.006 | -0.001 | 0.002 | 0.005 | 0.012 | |
| 社区自发团体 | 0.018*** | 0.006 | 0.091 | 0.011** | 0.005 | 0.056 | |
| 邻里联系 | 0.015*** | 0.002 | 0.214 | 0.012*** | 0.002 | 0.172 | |
| 社区归属感 | 0.016*** | 0.002 | 0.183 | 0.011*** | 0.002 | 0.135 | |
| 性别(女性为参照) | |||||||
| 男性 | 0.027*** | 0.009 | 0.071 | 0.027*** | 0.008 | 0.071 | |
| 年龄(小于25岁为参照) | |||||||
| 25~44 | -0.021** | 0.011 | -0.056 | -0.025*** | 0.010 | -0.067 | |
| 45~59 | -0.005 | 0.010 | -0.013 | -0.003 | 0.009 | -0.008 | |
| 60以上 | 0.035*** | 0.013 | 0.074 | 0.026** | 0.012 | 0.055 | |
| 受教育水平(初中及以下为参照) | |||||||
| 高中、中专 | 0.015 | 0.017 | 0.029 | -0.010 | 0.016 | -0.019 | |
| 大专、本科 | -0.016 | 0.016 | -0.042 | -0.025 | 0.015 | -0.066 | |
| 硕士及以上 | -0.013 | 0.021 | -0.025 | -0.028 | 0.019 | -0.053 | |
| 家庭总计年收入 | -0.005* | 0.003 | -0.051 | -0.004* | 0.002 | -0.044 | |
| 社区类型(老旧型商品房社区为参照) | |||||||
| 新型商品房社区 | 0.052*** | 0.020 | 0.137 | 0.043** | 0.017 | 0.115 | |
| 单位改制型社区 | 0.057*** | 0.022 | 0.106 | 0.072*** | 0.019 | 0.132 | |
| 保障房社区 | 0.050** | 0.021 | 0.112 | 0.035* | 0.018 | 0.078 | |
| R2 | 0.330 | 0.429 | |||||
| 调整R2 | 0.318 | 0.419 | |||||
注:因变量:社区参与度;***、**、*分别表示在0.01、0.05、0.1水平上显著。 |
The authors have declared that no competing interests exist.
| 1 |
[
|
| 2 |
[
|
| 3 |
[
|
| 4 |
[
|
| 5 |
[
|
| 6 |
[
|
| 7 |
[
|
| 8 |
[
|
| 9 |
[
|
| 10 |
[
|
| 11 |
[
|
| 12 |
[
|
| 13 |
[
|
| 14 |
[
|
| 15 |
[
|
| 16 |
[
|
| 17 |
[
|
| 18 |
|
| 19 |
|
| 20 |
|
| 21 |
|
| 22 |
|
| 23 |
|
| 24 |
|
| 25 |
|
| 26 |
|
| 27 |
|
| 28 |
|
| 29 |
|
| 30 |
|
| 31 |
|
| 32 |
|
| 33 |
|
| 34 |
|
| 35 |
|
/
| 〈 |
|
〉 |