
Spatial pattern and its evolution of population in Tanzania
Online published: 2017-05-20
Supported by
Overseas Science and Education Base Construction Project of Chinese Academy of Sciences, No.SAJC201319
Copyright
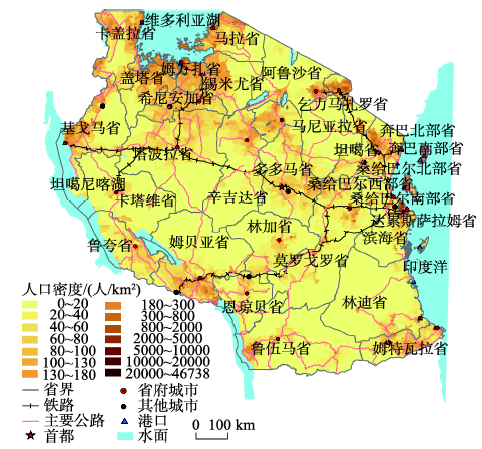
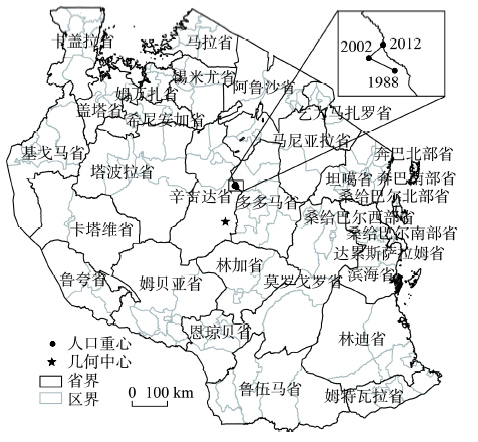
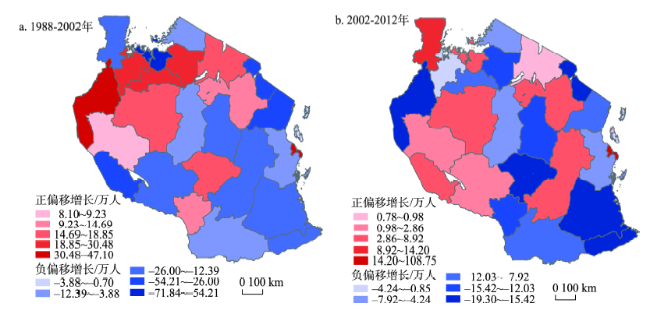
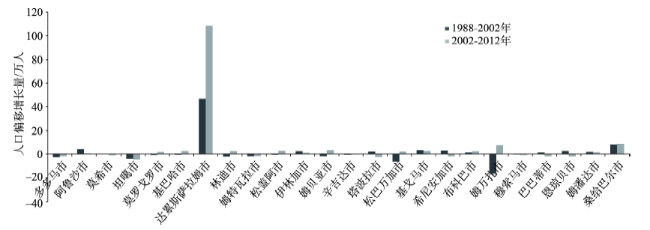
Tanzania is an important part of China's 'the Belt and Road' strategy, and China has become the largest trade partner of Tanzania. For the extensive cooperation in infrastructure, housing and public services, spatial pattern of population in Tanzania aroused broad attention. Based on the national census and regional statistics data of Tanzania, population density analysis, distribution concentration index, gravity center model, and population growth shift model were used to analyze Tanzania's population spatial distribution pattern and evolution since its economic reform in the late 1980s. The results shows that: (1) Divided by the central railway line, the population of Tanzania showed a characteristic of sparse distribution in the south and dense distribution in the north; (2) There was a growing trend of uneven population distribution during the period of 1988-2012. The population gravity center was always in the central-north region and had a tendency to continue to move northward; (3) Population movement to urban areas was the major process of population redistribution. The capacity of core cities in attracting migrants was growing. The Dar Es Salaam region experienced most rapid population growth that led to significant negative population growth shift in its surrounding areas; (4) Infrastructure such as railways and ports had evident effect on population agglomeration.
ZHANG Jiaqi , CHEN Shuang , Damas W. MAPUNDA . Spatial pattern and its evolution of population in Tanzania[J]. PROGRESS IN GEOGRAPHY, 2017 , 36(5) : 610 -617 . DOI: 10.18306/dlkxjz.2017.05.008
Fig.1 Ward-level population density distribution of Tanzania in 2012图1 2012年坦桑尼亚亚区人口密度分布图 |
Tab.1 High population density areas surrounding the ports of Tanzania表1 坦桑尼亚各港口周边的高人口密度区范围 |
| 主要港口 | >100人/km2的亚区数量/个 | 面积/km2 | 最大半径/km | |
|---|---|---|---|---|
| 海港 | 达累斯萨拉姆港 | 103 | 2488 | 65 |
| 姆特瓦拉港 | 16 | 255 | 25 | |
| 坦噶港 | 27 | 730 | 46 | |
| 基尔瓦港 | 0 | 0 | 0 | |
| 林迪港 | 13 | 265 | 20 | |
| 马飞亚港 | 3 | 150 | 30 | |
| 潘加尼港 | 5 | 117 | 15 | |
| 巴加莫约港 | 3 | 209 | 27 | |
| 桑给巴尔港 | 170 | 904 | 45 | |
| 查凯查凯港 | 88 | 755 | 42 | |
| 姆科阿尼港 | 32 | 252 | 18 | |
| 内陆港 | 姆万扎港 | 143 | 9983 | 110 |
| 布科巴港 | 88 | 3857 | 91 | |
| 穆索马港 | 94 | 5377 | 107 | |
| 基戈马港 | 60 | 4047 | 105 |
资料来源:《Basic Facts and Figures, 2012 on Human Settlements in Tanzania Mainland》和《Tanzania transport sector review 2013》。 |
Fig.2 Change trajectory of the population gravity center of Tanzania from 1988 to 2002 and 2002 to 2012图2 1988-2012年坦桑尼亚人口重心变动轨迹 |
Fig.3 Regional population growth shift of Tanzania in 1988-2002 and 2002-2012图3 1988-2012年坦桑尼亚各省人口偏移增长情况 |
Fig.4 Population growth shift of major urban areas of Tanzania in 1988-2002 and 2002-2012图4 1988-2012年坦桑尼亚主要城市地区人口偏移增长情况 |
The authors have declared that no competing interests exist.
| [1] |
[
|
| [2] |
[
|
| [3] |
[
|
| [4] |
[
|
| [5] |
[
|
| [6] |
[
|
| [7] |
[
|
| [8] |
[
|
| [9] |
[
|
| [10] |
[
|
| [11] |
[
|
| [12] |
[
|
| [13] |
|
| [14] |
|
| [15] |
|
| [16] |
|
| [17] |
|
| [18] |
|
| [19] |
|
| [20] |
|
| [21] |
|
| [22] |
|
| [23] |
|
| [24] |
|
| [25] |
|
| [26] |
|
| [27] |
UN-HABITAT.2010. The state of African cities 2010: Governance, inequalities and urban land markets[R]. Nairobi, Kenya: UN Centre for Human Settlements.
|
| [28] |
|
| [29] |
|
/
| 〈 |
|
〉 |