
Simulation and projection of land-use change in Beijing under different scenarios
Online published: 2015-08-25
Copyright
Land-use change is a dynamic process through which human and natural systems interact and the link between social economic activities and ecological processes, and plays an important role in the understanding of human-environment relationship. It has important implications for land management, therefore exploring the many factors influencing land use and land cover has been the focus of scientific study across multiple disciplines, locations, and scales. Simulation of land use spatial pattern under different scenarios may reveal the driving factors of regional land-use change spatially, which is an important way to analyze future land-use demand. In this study, using Beijing as an example we examined characteristics of land-use change and simulated future land-use demand by a CLUE-S model, and identified related driving factors using a Logistic model combine with land use data extracted from remote sensing images in 1985, 2000, and 2010. We simulated the land use requirements of Beijing in 2020 under different scenarios based on economic and social development, land use planning, resources and ecological protection and other conditions. The results are as follows: (1) different driving factors resulted in some different changes in various land-use types. Transportation and socioeconomic factors may have played an important role in the conversion of land-use types especially through affecting accessibility to the administrative center and level of urbanization. The effect of topographic factors, slope in particular, on land-use types is clear, with higher slope conducive to forest land and lower slope for other land-use types.(2) Consistency between the projected and actual land-use situations is high—the kappa index is 0.87. (3) Comparison of simulated land-use changes under various scenarios shows that future land use differs under different scenarios. Spatial pattern of land use in Beijing is optimized to a certain degree under the ecological protection and water resources conservation scenario, which promotes rational expansion of construction land. Under the natural development scenario land use should be based on the Land Use Plan to ensure the sustainability of land resources by setting urban growth boundary and so on.
Key words: Land-use change; spatial pattern; scenario simulation; CLUE-S model; Beijing
. Simulation and projection of land-use change in Beijing under different scenarios[J]. PROGRESS IN GEOGRAPHY, 2015 , 34(8) : 976 -986 . DOI: 10.18306/dlkxjz.2015.08.005
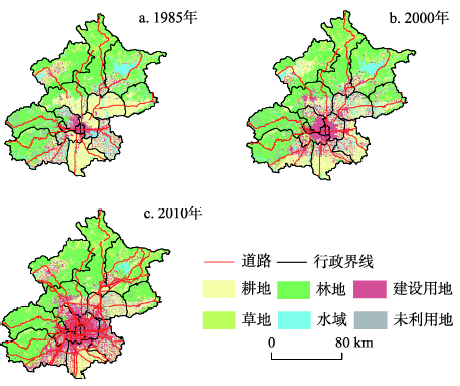
Fig.1 Land-use pattern in Beijing, 1985-2010图1 1985-2010年北京市土地利用类型图 |
Tab.1 Logistic regression results of spatial distribution of land-use types in Beijing, 1985-2000表1 1985-2000年北京市不同土地利用类型Logistic回归结果 |
| 驱动因子 | 耕地 | 林地 | 草地 | 水域 | 建设用地 | 未利用地 |
|---|---|---|---|---|---|---|
| exp(β) | exp(β) | exp(β) | exp(β) | exp(β) | exp(β) | |
| 高程 | 0.9989 | 1.0004 | 1.0011 | |||
| 坡度 | 0.7734 | 1.0337 | 0.9739 | 0.9783 | 0.9435 | |
| 到河流距离 | 0.9404 | 1.0960 | 0.9535 | 0.8366 | 1.0640 | |
| 到市(区、县)中心距离 | 1.0669 | 1.0187 | 1.0533 | 0.9196 | 1.0628 | |
| 到一般公路距离 | 1.0358 | 0.8623 | ||||
| 到铁路距离 | 1.0517 | 0.9389 | 0.9598 | 1.0640 | 0.9585 | |
| 到高速公路距离 | 1.0577 | 1.0625 | 1.0206 | 0.9468 | ||
| GDP | 0.9777 | 0.9815 | 1.0327 | |||
| 城镇化水平 | 0.9726 | 0.9062 | 0.9225 | 0.9828 | 1.0369 | |
| 人口密度 | 1.0006 | 1.0002 | 0.9998 | |||
| 常量 | 0.6923 | 2.6440 | 0.1726 | 0.0339 | 0.2714 | 0.0014 |
| ROC检验 | 0.7730 | 0.8460 | 0.8100 | 0.7470 | 0.8250 | 0.7990 |
Tab.2 Logistic regression results of spatial distribution of land-use types in Beijing, 2000-2010表2 2000-2010年北京市不同土地利用类型Logistic回归结果 |
| 驱动因子 | 耕地 | 林地 | 草地 | 水域 | 建设用地 | 未利用地 |
|---|---|---|---|---|---|---|
| exp(β) | exp(β) | exp(β) | exp(β) | exp(β) | exp(β) | |
| 高程(DEM) | 0.9992 | 0.9997 | 1.0015 | |||
| 坡度 | 0.8980 | 1.0173 | 0.9785 | |||
| 到河流距离 | 0.9412 | 1.1001 | 0.9579 | 0.7812 | 1.0263 | |
| 到市(区、县)中心距离 | 1.0212 | 1.0156 | 1.0654 | 0.9160 | 0.9177 | |
| 到一般公路距离 | 1.0518 | 1.0301 | 1.0475 | 0.8472 | ||
| 到铁路距离 | 1.0336 | 0.9521 | 0.9787 | 1.0603 | ||
| 到高速公路距离 | 1.0349 | 1.0648 | 0.9364 | |||
| GDP | 1.0015 | 1.0015 | 1.0013 | |||
| 城镇化水平 | 0.9943 | 0.9855 | 0.9659 | |||
| 人口密度 | 0.9584 | 0.9989 | 0.9995 | 0.9986 | 1.0013 | |
| 常量 | 0.9654 | 0.4281 | 0.0436 | 0.0133 | 1.2785 | 0.0077 |
| ROC检验 | 0.7080 | 0.8300 | 0.7970 | 0.7980 | 0.8390 | 0.7320 |
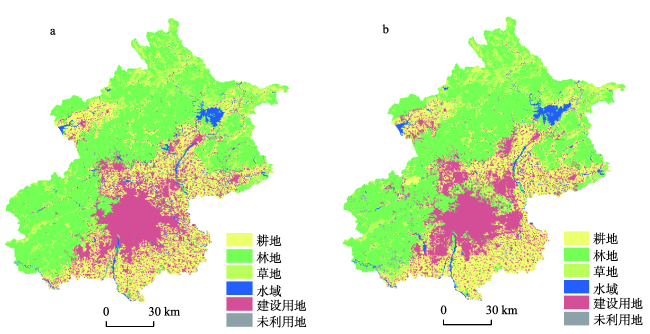
Fig.2 Comparison of observed (a) and simulated (b) land-use patterns in Beijing in 2010图2 2010年北京市土地利用现状图(a)与模拟图(b)比较 |
Tab. 3 Projected land use demand under different scenarios in Beijing in 2020 /hm2表3 不同情景下2020年北京各种土地类型需求量预测/hm2 |
| 情景设计 | 年份/变化量 | 耕地 | 林地 | 草地 | 水域 | 建设用地 | 未利用地 |
|---|---|---|---|---|---|---|---|
| 基准年 | 2010年 | 406692 | 741789 | 119772 | 44082 | 311013 | 10305 |
| 自然发展情景 | 2020年 | 333279 | 756891 | 115083 | 21330 | 400014 | 7056 |
| 变化量 | -73413 | 15102 | -4689 | -22752 | 89001 | -3249 | |
| 规划情景 | 2020年 | 358100 | 750007 | 111000 | 23934 | 381700 | 8912 |
| 变化量 | -48592 | 8218 | -8772 | -20148 | 70687 | -1392 | |
| 快速发展情景 | 2020年 | 328534 | 757222 | 114975 | 17333 | 408672 | 6916 |
| 变化量 | -78157 | 15433 | -4797 | -26749 | 97659 | -3389 | |
| 水资源约束情景 | 2020年 | 349858 | 753737 | 116064 | 29466 | 378751 | 5776 |
| 变化量 | -56833 | 11948 | -3708 | -14616 | 67738 | -4529 | |
| 生态与耕地保护情景 | 2020年 | 360912 | 751635 | 116718 | 34890 | 364575 | 4923 |
| 变化量 | -45780 | 9846 | -3054 | -9192 | 53562 | -5382 |
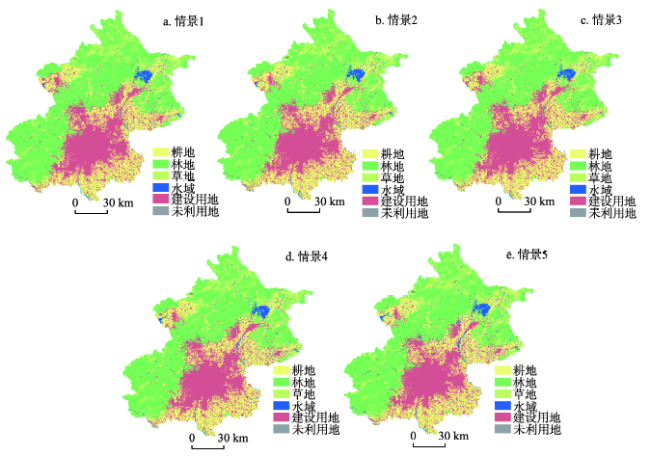
Fig.3 Simulation of land-use demand under different scenarios in Beijing in 2020图3 不同情景下2020年北京市土地利用空间模拟预测 |
The authors have declared that no competing interests exist.
| 1 |
[
|
| 2 |
[
|
| 3 |
[
|
| 4 |
[
|
| 5 |
[
|
| 6 |
[
|
| 7 |
[
|
| 8 |
[
|
| 9 |
[
|
| 10 |
[
|
| 11 |
[
|
| 12 |
[
|
| 13 |
[
|
| 14 |
[
|
| 15 |
[
|
| 16 |
[
|
| 17 |
[
|
| 18 |
[
|
| 19 |
[
|
| 20 |
[
|
| 21 |
[
|
| 22 |
[
|
| 23 |
[
|
| 24 |
[
|
| 25 |
[
|
| 26 |
|
| 27 |
|
| 28 |
|
| 29 |
|
| 30 |
|
| 31 |
|
| 32 |
|
| 33 |
|
| 34 |
|
| 35 |
|
| 36 |
|
| 37 |
|
/
| 〈 |
|
〉 |