
Characteristics of services development of core cities in urban agglomerations of China
Online published: 2015-08-25
Copyright
Under the new normality of China's economic development, service industries are becoming the strong driver for maintaining and advancing growth. Urban agglomerations are an important spatial carrier of China's service industries. The development level of core cities' service industries is pivotal for the comprehensive competitiveness of these cities and a symbol of modernization degree in urban agglomerations. This article uses the entropy method, location quotient, and external service flow model to analyze the characteristics of services specialization, external function, and development level of 32 core cities of China in 2003 and 2012. Conclusions can be drawn as follows: Territorial division of service industries was clear in these core cities. The division degree of producer services was much higher than consumer and public services. Internal differences of producer services' exhibited an increasing trend. The core cities' external service ability showed strong correlation with city scale. The majority of the core cities were predominantly producer service-oriented, and fewer core cities were consumer service-oriented. Spatial concentration of external function of the core cities' service sectors was clearly different. Overall, spatial concentration of producer service was higher than that of consumer service. The spatial differentiation of services development level of the core cities was significant—core cities of national urban agglomerations generally had higher levels of services development than the regional and local urban agglomerations.
. Characteristics of services development of core cities in urban agglomerations of China[J]. PROGRESS IN GEOGRAPHY, 2015 , 34(8) : 957 -965 . DOI: 10.18306/dlkxjz.2015.08.003
Tab.1 Service sectors specialization level of the top 15 cities and average location quotient (LQ) values in 2012表1 2012年服务业内部行业专业化水平前15位的城市及其区位熵平均值及变化 |
| 行业分类 | ALQ15城市 | 区位熵 | 区位熵变化 | 标准差变化 |
|---|---|---|---|---|
| 生产性服务业 | 1.98 | 0.20 | 0.17 | |
| 交通运输、仓储及邮政业 | 乌鲁木齐(2.84)沈阳(2.09)北京(2.04)南宁(1.92)广州(1.86)武汉(1.85)南昌(1.81)哈尔滨(1.79)深圳(1.79)太原(1.78)西宁(1.75)上海(1.72)济南(1.64)石家庄(1.62)西安(1.58) | 1.98 | 0.27 | 0.14 |
| 信息传输、计算机服务和软件业 | 北京(4.77)西安(3.44)杭州(1.93)大连(1.92)呼和浩特(1.75)南京(1.59)长春(1.42)西宁(1.38)哈尔滨(1.23)深圳(1.21)济南(1.18)上海(1.09)沈阳(1.03)广州(1.02)长沙(1.02) | 2.06 | 0.39 | 0.41 |
| 金融业 | 呼和浩特(1.78)银川(1.70)上海(1.57)北京(1.56)石家庄(1.52)大连(1.45)深圳(1.35)南宁(1.27)济南(1.27)西宁(1.26)长沙(1.25)哈尔滨(1.24)兰州(1.22)长春(1.21)沈阳(1.15) | 1.47 | 0.11 | 0.09 |
| 租赁和商务服务业 | 北京(4.35)深圳(3.05)广州(2.03)南宁(2.01)银川(1.8)杭州(1.74)沈阳(1.70)南京(1.60)长春(1.58)乌鲁木齐(1.58)上海(1.57)长沙(1.20)重庆(1.18)济南(1.14)呼和浩特(1.06) | 2.14 | 0.19 | 0.16 |
| 科学研究、技术服务和地质勘查业 | 北京(3.57)西安(2.95)兰州(2.35)沈阳(2.33)西宁(2.24)长春(2.23)呼和浩特(2.03)成都(1.92)南宁(1.75)长沙(1.75)杭州(1.72)乌鲁木齐(1.72)南京(1.69)哈尔滨(1.55)石家庄(1.54) | 2.31 | 0.04 | 0.06 |
| 生活性服务业 | 1.71 | -0.29 | -0.08 | |
| 批发和零售业 | 重庆(2.19)上海(1.98)北京(1.77)广州(1.52)济南 (1.50)武汉(1.36)贵阳(1.35)南京(1.31)石家庄(1.16)杭州(1.14)长沙(1.13)天津(1.11)深圳(1.09)南宁(1.04)哈尔滨(1.04) | 1.53 | 0.26 | 0.09 |
| 住宿和餐饮业 | 重庆(3.28)北京(2.01)广州(1.92)长沙(1.63)上海(1.63)深圳(1.45)西安(1.42)杭州(1.35)南京(1.30)贵阳(1.29)厦门(1.28)济南(1.28)武汉(1.28)太原(1.26)大连(1.13) | 1.73 | -0.34 | -0.09 |
| 房地产业 | 北京(2.78)深圳(2.60)广州(2.13)贵阳(2.11)长沙(1.90)大连(1.88)厦门(1.60)西安(1.50)杭州(1.48)上海(1.47)哈尔滨(1.41)长春(1.39)沈阳(1.28)银川(1.25)重庆(1.23) | 1.94 | -0.28 | -0.19 |
| 居民服务和其他服务业 | 重庆(3.31)天津(3.18)北京(1.15) | 1.26 | -1.31 | -0.34 |
| 文化、体育和娱乐业 | 呼和浩特(3.12)北京(2.66)乌鲁木齐(2.14)长沙(2.04)长春(1.98)兰州(1.95)石家庄(1.90)西安(1.85)哈尔滨(1.85)银川(1.59)南宁(1.58)郑州(1.56)西宁(1.56)南京(1.52)沈阳(1.52) | 2.11 | 0.24 | 0.12 |
| 公共服务业 | 1.29 | 0.03 | -0.02 | |
| 水利、环境和公共设施管理业 | 呼和浩特(3.07)沈阳2.21)长春(1.92)兰州(1.62)哈尔滨(1.61)银川(1.46)南宁(1.33)石家庄(1.27)杭州(1.14)太原(1.11) | 1.67 | -0.1 | -0.02 |
| 教育 | 石家庄(1.40)呼和浩特(1.39)南宁(1.27)长春(1.25)哈尔滨(1.21)兰州(1.14)沈阳(1.10)西安(1.01) | 1.16 | 0.11 | -0.05 |
| 卫生和社会工作 | 西宁(1.39)沈阳(1.35)南宁(1.33)成都(1.19)乌鲁木齐(1.18)呼和浩特(1.17)长春(1.16)石家庄(1.15)哈尔滨(1.14)银川(1.13)长沙(1.11) | 1.22 | 0.04 | -0.03 |
| 公共管理、社会保障和社会组织 | 呼和浩特(1.54)石家庄(1.35)银川(1.26)乌鲁木齐(1.17)兰州(1.17) | 1.09 | 0.07 | 0.07 |
注:标准差变化是32个核心城市之间的区位熵标准差。 |
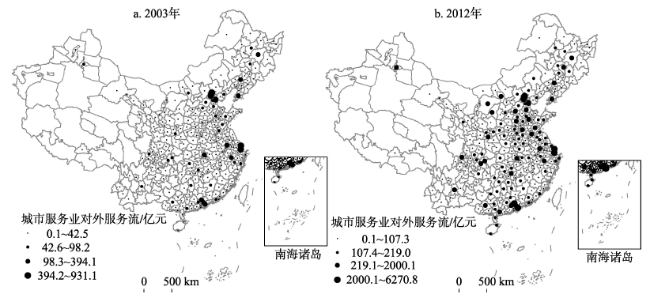
Fig.1 Spatial patterns of services' external service flow in 2003 and 2012图1 2003年和2012年中国城市服务业对外服务流空间格局 |
Tab.2 Services' external function level and classification of the 32 core cities in 2003 and 2012表2 2003年和2012年核心城市服务业对外服务功能等级及类型划分 |
| 服务等级 | 2003年 | 2012年 |
|---|---|---|
| I级服务中心 | 北京(PC)、上海(P) | 北京(P)、上海(PC)、广州(P)、深圳(P) |
| II级服务中心 | 杭州(P)、沈阳(P)、大连(P)、天津(P)、南京(P)、武汉(C)、哈尔滨(C)、深圳(C)、广州(PC) | 杭州(P)、沈阳(P)、大连(P)、天津(P)、南京(P)、武汉(P)、哈尔滨(P)、西安(P)、长春(P)、成都(P)、乌鲁木齐(P)、南宁(P)、长沙(C)、昆明(C)、重庆(C)、济南(PC)、呼和浩特(PC) |
| III级服务中心 | 西安(P)、重庆(P)、昆明(P)、长春(P)、成都(P)、呼和浩特(P)、南宁(P)、济南(P)、长沙(C) 、乌鲁木齐(PC) | 太原(P)、兰州(P)、青岛(P)、厦门(C) |
| IV级服务中心 | 合肥(P)、南昌(P)、太原(P)、兰州(P)、西宁(P)、银川(P)、厦门(C)、贵阳(C)、福州(C)、青岛(PC)、郑州(PC) | 合肥(P)、南昌(P)、贵阳(P)、福州(P)、西宁(P)、银川(P)、郑州(C) |
注:P为生产性服务功能主导型,C为生活性服务功能主导型,PC为生产性与生活性服务功能并重型。 |
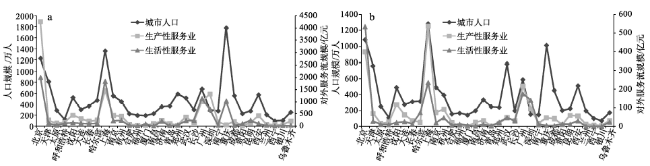
Fig.2 Population and producerand consumer services’ external service flow of the 32 core cities in 2003 and 2012图2 2003年和2012年核心城市人口规模与生产性、生活性服务业对外服务流规模 |
Tab.3 Proportion of the core cities' service sectors external service flow and change in 2003 and 2012表3 2003和2012年核心城市服务业内部各行业对外服务流比重及其变化 |
| 行业 | 2003年 | 2012年 | 变化量 | |
|---|---|---|---|---|
| 生产性服务业 | 交通运输、仓储和邮政业 | 23.5 | 18.7 | -4.8 |
| 信息传输、计算机服务和软件业 | 3.3 | 7.0 | 3.7 | |
| 金融业 | 3.9 | 5.9 | 2.0 | |
| 租赁和商务服务业 | 11.1 | 12.5 | 1.4 | |
| 科学研究、技术服务和地质勘查业 | 13.1 | 10.8 | -2.3 | |
| 生活性服务业 | 批发和零售业 | 10.6 | 16.4 | 5.8 |
| 住宿和餐饮业 | 11.7 | 9.1 | -2.6 | |
| 房地产业 | 8.8 | 9.6 | 0.8 | |
| 居民服务、修理和其他服务业 | 4.3 | 1.3 | -3.0 | |
| 文化、体育和娱乐业 | 3.6 | 3.7 | 0.1 | |
| 公共服务业 | 水利、环境和公共设施管理业 | 2.0 | 1.6 | -0.4 |
| 教育 | 1.7 | 1.6 | -0.1 | |
| 卫生和社会工作 | 1.8 | 1.3 | -0.5 | |
| 公共管理、社会保障和社会组织 | 0.5 | 0.6 | 0.1 | |
Tab.4 Spatial concentration ratio of producer and consumer services' external function in the core cities in 2012表4 2012年核心城市生产性和生活性服务业外向功能空间集中率 |
| 行业 | CR3/% | CR5/% | CR10城市 |
|---|---|---|---|
| 生产性服务业 | 74.1 | 88.4 | 北京、上海、深圳、广州、沈阳、南京、西安、杭州、武汉、大连 |
| 交通运输、仓储和邮政业 | 45.3 | 62.5 | 北京、上海、广州、深圳、天津、沈阳、南京、乌鲁木齐、武汉、青岛 |
| 信息传输、计算机服务和软件业 | 81.8 | 91.5 | 北京、上海、西安、杭州、大连、南京、深圳、长春、哈尔滨、济南 |
| 金融业 | 71.9 | 82.9 | 上海、北京、深圳、广州、天津、杭州、南京、哈尔滨、大连、武汉 |
| 租赁和商务服务业 | 73.3 | 87.2 | 北京、深圳、广州、上海、杭州、南京、沈阳、南宁、长春、昆明 |
| 科学研究、技术服务和地质勘查业 生活性服务业 | 52.3 69.7 | 63.1 83.2 | 北京、成都、上海、西安、杭州、广州、南京、天津、深圳、武汉 北京、上海、广州、重庆、深圳、杭州、昆明、长沙、武汉、南京 |
| 批发和零售业 | 68.4 | 84.4 | 上海、北京、重庆、广州、武汉、济南、南京、天津、深圳、杭州 |
| 住宿和餐饮业 | 56.1 | 68.8 | 重庆、北京、上海、广州、深圳、杭州、长沙、武汉、南京、西安 |
| 房地产业 | 62.0 | 76.0 | 北京、深圳、广州、上海、大连、长沙、杭州、厦门、贵阳、西安 |
| 文化、体育和娱乐业 | 58.6 | 67.7 | 北京、上海、南京、长沙、昆明、西安、哈尔滨、广州、深圳、长春 |
| 居民服务和其他服务业 | 68.3 | 87.9 | 沈阳、呼和浩特、长春、哈尔滨、杭州、兰州、南宁、银川、太原、南昌 |
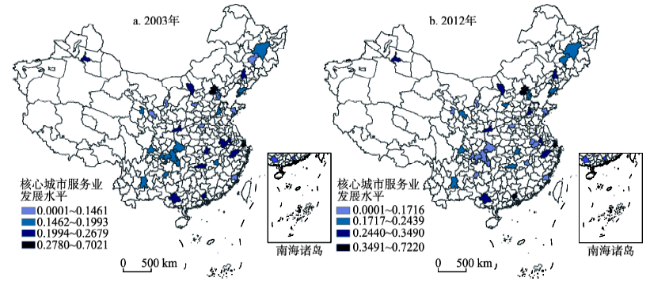
Fig.3 Spatial patterns of services comprehensive development level of Chinese cities in 2003 and 2012图3 2003、2012年中国城市服务业综合发展水平空间格局 |
The authors have declared that no competing interests exist.
| 1 |
[
|
| 2 |
[
|
| 3 |
[
|
| 4 |
[
|
| 5 |
[
|
| 6 |
[
|
| 7 |
[
|
| 8 |
[
|
| 9 |
[
|
| 10 |
[
|
| 11 |
[
|
| 12 |
[
|
| 13 |
[
|
| 14 |
[
|
| 15 |
[
|
| 16 |
[
|
| 17 |
[
|
| 18 |
[
|
| 19 |
[
|
| 20 |
[
|
| 21 |
[
|
| 22 |
|
/
| 〈 |
|
〉 |