
Spatial patterns of logistics industry based on a geographic analysis of hotness degree
Online published: 2015-06-17
Copyright
:Spatial patterns of logistics industry is formed by the spatial distribution and structure of logistics facilities and enterprises. In order to examine the current situation and change of spatial patterns of logistics industry in China, we put forward the concepts of "logistics hotness degree "and "primacy index of cities." In August 2014, we obtained 80507 samples of logistics hotness degree data at the prefecture level or above in China based on "logistics" key word search using Baidu maps (excluding Hong Kong, Macao, and Taiwan). Through establishing an index of logistics hotness degree, the correlation between logistics hotness degree and indicators were analyzed. This article presents the construction of the logistics hotness degree index and demonstrates the effectiveness and validity of Internet-based data on logistics industry. Spatial patterns of logistics industry are analyzed in terms of capacity, level of service, and spatial influence at the prefecture,provincial, metropolitan area, and economic zone scales. We explored the impact of economic development and logistics park construction on the evolution of the spatial patterns of logistics industry. Logistics centers were identified and compared to the national and regional logistics hub cities designated in the "Logistics Industry Restructuring and Revitalization Plan" issued by the State Council and the "National Logistics Park Development Planning" issued by the National Development and Reform Commission and 11 other ministries. Some conclusions can be drawn as follows: the logistics hotness degree information is a comprehensive representation of logistics facilities and logistics enterprises.It is highly correlated with GDP, number of primary industry corporation units in transportation, warehousing, and postal services. Economic development level is highly correlated with logistics industry development. The spatial layout of logistics facilities and enterprises is significant correlated with industrial demand and their locations in the transport system; and it increasingly influenced by the of consumption demand and distribution and socioeconomic conditions of population. In the eastern coastal region of China, logistics industry distribution shows the spatial characteristics of "single-center and multiple sub-centers" or "multiple-centers and multiple sub-centers." In the central and western regions, however, the spatial pattern of distribution is characterized by "single -centers," which shows a clear regional difference from the coastal region. The result of this research may provide some guidance for logistics plann ing and logistics industrial policy of the central and regional governments for the thirteenth Five-Year Plan period and beyond.
LI Guoqi , JIN Fengjun , CHEN Yu , LIU Sijing . Spatial patterns of logistics industry based on a geographic analysis of hotness degree[J]. PROGRESS IN GEOGRAPHY, 2015 , 34(5) : 629 -637 . DOI: 10.11820/dlkxjz.2015.05.011
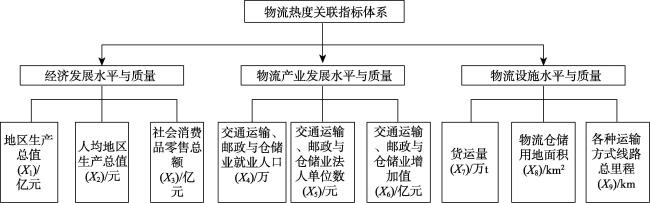
Fig.1 Index system of logistics hotness degree图1 物流热度的关联指标体系 |
Tab.1 Primacy index of logistics, economic activity, and population based on logistics hotness degree in central cities/%表1 基于物流热度的中心城市的物流、经济、人口首位度/% |
| 城市 | 物流热度 | 经济总量 | 常住人口 | 城市 | 物流热度 | 经济总量 | 常住人口 | 城市 | 物流热度 | 经济总量 | 常住人口 |
|---|---|---|---|---|---|---|---|---|---|---|---|
| 哈尔滨 | 41.86 | 29.98 | 27.76# | 银川 | 46.67 | 49.16 | 31.62 | 宁波* | 24.7 | 18.99 | 13.95 |
| 通辽* | 15.88 | 10.65 | 12.64# | 西宁 | 73.04 | 44.94 | 39.21 | 长沙 | 37.94 | 28.89 | 10.77 |
| 乌鲁木齐 | 32.71 | 26.58 | 14.97# | 青岛* | 20.20 | 14.60 | 9.16 | 南昌 | 24.79 | 23.17 | 11.39 |
| 长春 | 47.78 | 37.32 | 27.95** | 拉萨 | 56.10 | 37.10 | 18.58# | 昆明 | 46.88 | 29.21 | 14.02 |
| 沈阳 | 33.43 | 22.66 | 18.75 | 郑州 | 31.02 | 18.75 | 9.60 | 贵阳 | 36.99 | 24.81 | 12.78 |
| 兰州 | 34.57 | 27.68 | 14.12# | 苏州* | 18.20 | 22.22 | 13.32 | 厦门* | 31.77 | 14.30 | 9.79 |
| 保定* | 18.51 | 10.50 | 15.57# | 合肥 | 29.05 | 24.19 | 12.65 | 南宁 | 31.20 | 19.20 | 14.50 |
| 太原 | 29.00 | 19.08 | 11.79 | 成都 | 50.16 | 34.09 | 17.56 | 广州 | 25.39 | 23.75 | 12.12 |
| 西安 | 48.52 | 30.21 | 22.79 | 武汉 | 48.75 | 35.97 | 17.51 | 海口 | 54.86 | 28.67 | 24.14 |
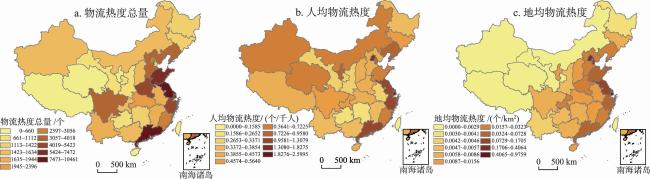
Fig.2 Distribution pattern of logistics hotness degree in prefectural-level cities图2 地级市尺度的物流热度分布格局 |
Fig.3 Provincial-level distribution pattern of logistics hotness degree图3 省域尺度的物流热度空间分布格局 |
Tab.2 Correlation coefficients of logistics hotness degree and indicators表2 物流热度与主要关联指标的相关系数 |
| 相关系数 | P值 | 标准误差 | 相关系数 | P值 | 标准误差 | ||
|---|---|---|---|---|---|---|---|
| X1 | 0.9270 | <0.0001 | 910.679 | X6 | 0.8194 | <0.0001 | 1391.790 |
| X2 | 0.4631 | 0.0087 | 2151.779 | X7 | 0.6149 | 0.0002 | 1914.555 |
| X3 | 0.9302 | <0.0001 | 891.010 | X8 | 0.4787 | 0.0064 | 2131.502 |
| X4 | 0.8040 | <0.0001 | 1443.656 | X9 | 0.2925 | 0.1103 | 2321.605 |
| X5 | 0.9281 | <0.0001 | 903.672 | - | - | - | - |
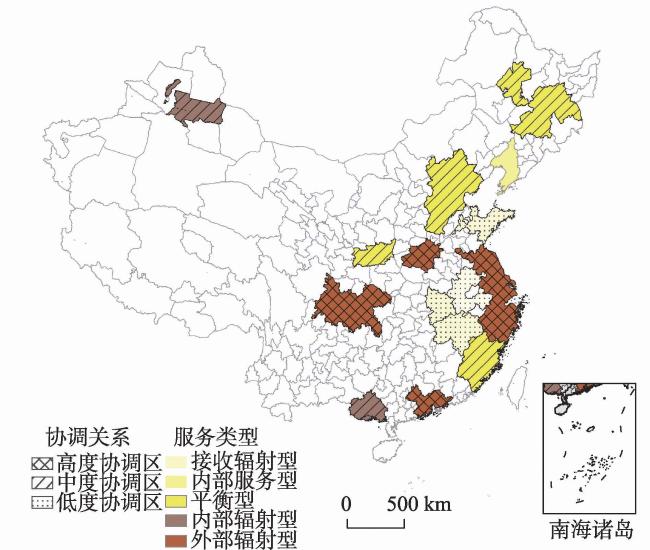
Fig.4 Distribution pattern of logistics service types and assessment in metropolitan areas based on logistics hotness degree图4 基于物流热度的城市群物流服务类型与协调关系分区 |
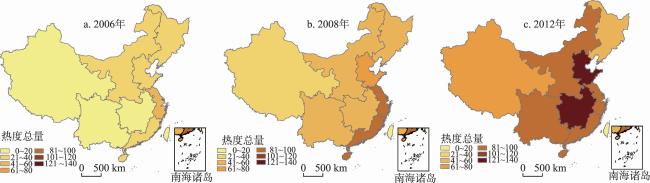
Fig.5 Distribution pattern and evolution of logistics parks in eight major economic zones of China图5 中国各经济区物流园区分布格局演变图 |
Tab.3 Number of logistics parks in major economic zones and their relation with logistics hotness degree表3 分经济区物流园区数量与物流热度的相关性 |
| 2006 | 2008 | 2012 | ||||||||||||
|---|---|---|---|---|---|---|---|---|---|---|---|---|---|---|
| 总量 | 运营 | 建设 | 规划 | 总量 | 运营 | 建设 | 规划 | 总量 | 运营 | 建设 | 规划 | |||
| 东北经济区 | 21 | 4 | 12 | 5 | 48 | 18 | 24 | 6 | 56 | 26 | 23 | 7 | ||
| 北部沿海经济区 | 28 | 10 | 8 | 10 | 67 | 22 | 29 | 16 | 128 | 88 | 35 | 5 | ||
| 东部沿海经济区 | 52 | 11 | 11 | 30 | 97 | 32 | 41 | 24 | 93 | 65 | 14 | 14 | ||
| 南部沿海经济区 | 36 | 8 | 9 | 19 | 96 | 25 | 31 | 40 | 83 | 52 | 25 | 6 | ||
| 西南经济区 | 17 | 3 | 8 | 8 | 56 | 3 | 36 | 17 | 98 | 28 | 41 | 29 | ||
| 西北经济区 | 13 | 1 | 1 | 11 | 21 | 3 | 8 | 10 | 64 | 14 | 25 | 25 | ||
| 黄河中游经济区 | 21 | 6 | 7 | 8 | 47 | 7 | 25 | 15 | 93 | 35 | 47 | 11 | ||
| 长江中游经济区 | 17 | 7 | 9 | 1 | 43 | 12 | 25 | 6 | 139 | 40 | 31 | 68 | ||
| 相关系数 | 0.93 | 0.87 | 0.52 | 0.79 | 0.93 | 0.82 | 0.84 | 0.67 | 0.29 | 0.81 | -0.32 | 0.64 | ||
The authors have declared that no competing interests exist.
| 1 |
[
|
| 2 |
[
|
| 3 |
[
|
| 4 |
[
|
| 5 |
[
|
| 6 |
[
|
| 7 |
[
|
| 8 |
[
|
| 9 |
[
|
| 10 |
[
|
| 11 |
[
|
| 12 |
|
| 13 |
[
|
| 14 |
[
|
| 15 |
|
| 16 |
|
| 17 |
|
| 18 |
|
| 19 |
|
| 20 |
|
| 21 |
|
| 22 |
|
| 23 |
|
| 24 |
Van Den Heuvel F P,
|
| 25 |
|
| 26 |
注:*表示非省会城市;**表示第六次人口普查数据;#表示2011年数据.
|
/
| 〈 |
|
〉 |
